

Estimation of regional polygenicity from GWAS provides insights into the genetic architecture of complex traits
- PMID: 34673766
- PMCID: PMC8562817
- DOI: 10.1371/journal.pcbi.1009483
Estimation of regional polygenicity from GWAS provides insights into the genetic architecture of complex traits
Abstract
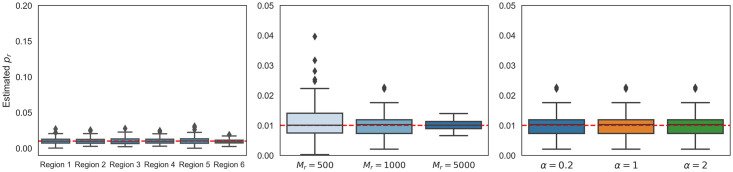
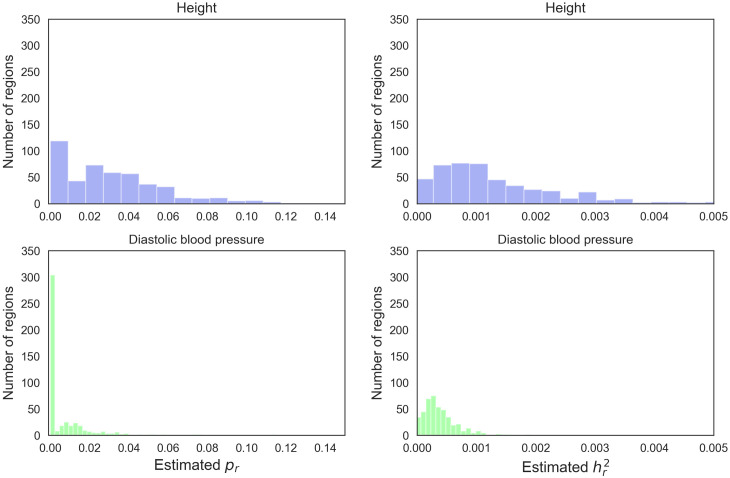
The number of variants that have a non-zero effect on a trait (i.e. polygenicity) is a fundamental parameter in the study of the genetic architecture of a complex trait. Although many previous studies have investigated polygenicity at a genome-wide scale, a detailed understanding of how polygenicity varies across genomic regions is currently lacking. In this work, we propose an accurate and scalable statistical framework to estimate regional polygenicity for a complex trait. We show that our approach yields approximately unbiased estimates of regional polygenicity in simulations across a wide-range of various genetic architectures. We then partition the polygenicity of anthropometric and blood pressure traits across 6-Mb genomic regions (N = 290K, UK Biobank) and observe that all analyzed traits are highly polygenic: over one-third of regions harbor at least one causal variant for each of the traits analyzed. Additionally, we observe wide variation in regional polygenicity: on average across all traits, 48.9% of regions contain at least 5 causal SNPs, 5.44% of regions contain at least 50 causal SNPs. Finally, we find that heritability is proportional to polygenicity at the regional level, which is consistent with the hypothesis that heritability enrichments are largely driven by the variation in the number of causal SNPs.
Conflict of interest statement
The authors have declared that no competing interests exist.
Figures


Similar articles
-
Localizing Components of Shared Transethnic Genetic Architecture of Complex Traits from GWAS Summary Data.Am J Hum Genet. 2020 Jun 4;106(6):805-817. doi: 10.1016/j.ajhg.2020.04.012. Epub 2020 May 21. Am J Hum Genet. 2020. PMID: 32442408 Free PMC article.
-
Partitioning gene-level contributions to complex-trait heritability by allele frequency identifies disease-relevant genes.Am J Hum Genet. 2022 Apr 7;109(4):692-709. doi: 10.1016/j.ajhg.2022.02.012. Epub 2022 Mar 9. Am J Hum Genet. 2022. PMID: 35271803 Free PMC article.
-
A global overview of pleiotropy and genetic architecture in complex traits.Nat Genet. 2019 Sep;51(9):1339-1348. doi: 10.1038/s41588-019-0481-0. Epub 2019 Aug 19. Nat Genet. 2019. PMID: 31427789
-
Methods for the Analysis and Interpretation for Rare Variants Associated with Complex Traits.Curr Protoc Hum Genet. 2019 Apr;101(1):e83. doi: 10.1002/cphg.83. Epub 2019 Mar 8. Curr Protoc Hum Genet. 2019. PMID: 30849219 Free PMC article. Review.
-
Revisiting the malaria hypothesis: accounting for polygenicity and pleiotropy.Trends Parasitol. 2022 Apr;38(4):290-301. doi: 10.1016/j.pt.2021.12.007. Epub 2022 Jan 19. Trends Parasitol. 2022. PMID: 35065882 Free PMC article. Review.
Cited by
-
Uncovering the genetic architecture and evolutionary roots of androgenetic alopecia in African men.HGG Adv. 2025 Jul 10;6(3):100428. doi: 10.1016/j.xhgg.2025.100428. Epub 2025 Mar 24. HGG Adv. 2025. PMID: 40134218 Free PMC article.
-
RegionScan: a comprehensive R package for region-level genome-wide association testing with integration and visualization of multiple-variant and single-variant hypothesis testing.Bioinform Adv. 2025 Mar 13;5(1):vbaf052. doi: 10.1093/bioadv/vbaf052. eCollection 2025. Bioinform Adv. 2025. PMID: 40160476 Free PMC article.
-
Uncovering the genetic architecture and evolutionary roots of androgenetic alopecia in African men.bioRxiv [Preprint]. 2024 Jan 15:2024.01.12.575396. doi: 10.1101/2024.01.12.575396. bioRxiv. 2024. Update in: HGG Adv. 2025 Jul 10;6(3):100428. doi: 10.1016/j.xhgg.2025.100428. PMID: 38293167 Free PMC article. Updated. Preprint.
-
Heritability of complex traits in sub-populations experiencing bottlenecks and growth.J Hum Genet. 2024 Jul;69(7):329-335. doi: 10.1038/s10038-024-01249-2. Epub 2024 Apr 8. J Hum Genet. 2024. PMID: 38589509 Free PMC article.
-
Inferring disease architecture and predictive ability with LDpred2-auto.Am J Hum Genet. 2023 Dec 7;110(12):2042-2055. doi: 10.1016/j.ajhg.2023.10.010. Epub 2023 Nov 8. Am J Hum Genet. 2023. PMID: 37944514 Free PMC article.
References
Publication types
MeSH terms
Grants and funding
LinkOut - more resources
Full Text Sources
Miscellaneous
