. 2021 Oct 21;16(10):e0258667.
doi: 10.1371/journal.pone.0258667. eCollection 2021.

Top-down resolution of visual ambiguity - knowledge from the future or footprints from the past?

Affiliations

Top-down resolution of visual ambiguity - knowledge from the future or footprints from the past?

Jürgen Kornmeier et al. PLoS One. .

Abstract

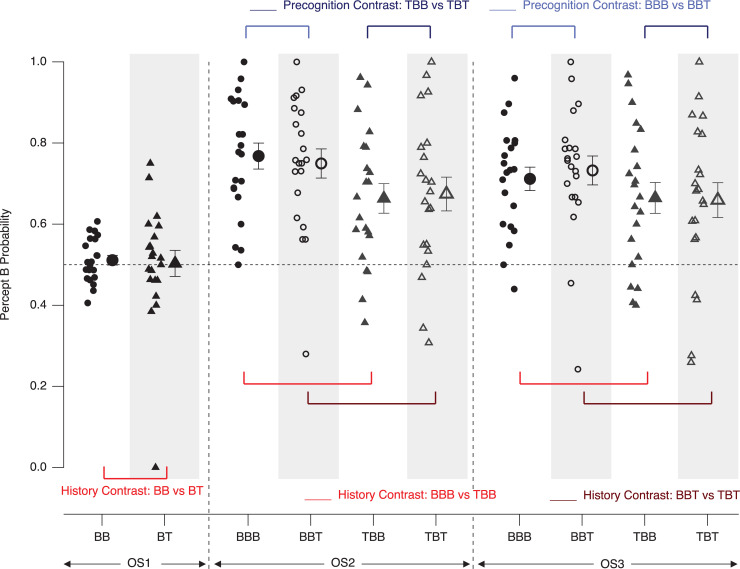
Current theories about visual perception assume that our perceptual system weights the a priori incomplete, noisy and ambiguous sensory information with previous, memorized perceptual experiences in order to construct stable and reliable percepts. These theories are supported by numerous experimental findings. Theories about precognition have an opposite point of view. They assume that information from the future can have influence on perception, thoughts, and behavior. Several experimental studies provide evidence for precognition effects, other studies found no such effects. One problem may be that the vast majority of precognition paradigms did not systematically control for potential effects from the perceptual history. In the present study, we presented ambiguous Necker cube stimuli and disambiguated cube variants and systematically tested in two separate experiments whether perception of a currently observed ambiguous Necker cube stimulus can be influenced by a disambiguated cube variant, presented in the immediate perceptual past (perceptual history effects) and/or in the immediate perceptual future (precognition effects). We found perceptual history effects, which partly depended on the length of the perceptual history trace but were independent of the perceptual future. Results from some individual participants suggest on the first glance a precognition pattern, but results from our second experiment make a perceptual history explanation more probable. On the group level, no precognition effects were statistically indicated. The perceptual history effects found in the present study are in confirmation with related studies from the literature. The precognition analysis revealed some interesting individual patterns, which however did not allow for general conclusions. Overall, the present study demonstrates that any future experiment about sensory or extrasensory perception urgently needs to control for potential perceptual history effects and that temporal aspects of stimulus presentation are of high relevance.


Conflict of interest statement

The authors have declared that no competing interests exist.

Figures

Fig 1
Fig 1
(a) Disambiguated lattice variant with the front-side to the bottom-right (B-perspective); (b) disambiguated variant with the front-side to the top left (T-perspective). (c) Necker lattice, composed of 3x3 Necker cubes, as introduced by Kornmeier et al. (2001).
Fig 2
Fig 2. Experimental task.
Lattice stimuli were presented in pairs, the first lattice stimulus S1 was followed by the second lattice stimulus S2. S1 was presented for 800 ms and participants indicated with different keys whether they perceived it in the B- or the T-perspective. After a grey screen inter-stimulus interval (ISI) of 400 ms lattice S2 was presented for 800 ms. Participants compared their percept of S2 with their memorized percept of S1 and indicated by key press either perceptual stability (same perceived perspectives of S1 and S2) or perceptual reversal (change between B- and T-perspective). S2 was followed by an inter-observation interval (IOSI) of 1000 ms. In the present example case, both S1 and S2 were disambiguated lattice versions. In our study, the ambiguity levels of S1 and S2 stayed constant within but varied between experimental conditions. A variant of this figure has already been presented in a recent publication from our lab [see Fig 2 in 61].
Fig 3
Fig 3. Experimental conditions–schematic overview.
In the present analysis of Experiment 1 we restricted the analysis to two out of four experimental conditions (AD and DA) where ambiguous lattices alternated continuously with disambiguated lattice variants. The conditions were subdivided into three experimental blocks of about 9 min duration. Each experimental block was composed of 180 repetitions of observation sequences (OS). Within one OS two lattice stimuli S1 and S2 were presented in succession and participants had to execute respective tasks, as explained in Fig 2. In Condition AD, stimulus 1 (S1) was always an ambiguous lattice (“A”) and S2 a disambiguated lattice variant (“D”). In Condition DA, S1 was the disambiguated lattice and S2 the ambiguous lattice variant. Lattice ambiguity levels stayed constant within but differed between experimental blocks/conditions. A variant of this figure has already been presented in a recent publication from our lab [see Fig 3 in 61].
Fig 4
Fig 4. Grouping of analysis sequences.
The logic behind the grouping underlying the data analysis, exemplified for the history effect analysis. We compared the percentage of group occurrences of percepts of the ambiguous stimulus (S1 current OS, green frame) given that the subsequently presented lattice variants will be identical but the preceding lattice variants differed. For the precognition effect analysis we varied the ambiguity level of the subsequent stimulus but kept it for the preceding stimuli constant.: P-perspective; T: T-perspective.
Fig 5
Fig 5. Groups of sequences.
Top: From Condition AD we selected separate groups of observation sequences (OS) to analyze precognition effects while controlling for the perceptual history and vice versa. The history effects contrasts compared group (AD1) with group (AD3) and group (AD2) with group (AD4). The precognition effect contrasts compared group (AD1) with group (AD2) and group (AD3) with group (AD4). The blue arrow indicates what participants observed at a current moment. Bottom: Grouping of Condition DA according to the same logic.
Fig 6
Fig 6. Perceptual probability results–Experiment 1.
Depicted are individual probability values as calculated with the formulas (1–4), introduced above. Any systematic deviation from the dashed grey 0.5 line indicates a perceptual bias in the respective direction, i.e. a long-term perceptual history effect. Small icons represent data from individual participants, large icons the respective grand means (± SEM). Blue and red lines indicate the precognition and short-term history effect contrasts, respectively.
Fig 7
Fig 7. Perceptual history and precognition contrasts.
Depicted are individual differential probability value contrasts as indicated on the abscissa. Any systematic deviation from zero indicates either immediate perceptual history effects (red icons) or precognition effects (blue icons). Small icons represent data from individual participants, large icons the respective grand means (± SEM).
Fig 8
Fig 8. Enlarged precognition contrasts.
Depicted are individual differential probability value contrasts (the same blue icons from Fig 7 on an enlarged y-axis). The dashed and dotted grey horizontal lines indicate 1.5 and 2 standard deviations (SDs). All colors other than blue indicate participants with differential probability values equal or larger than 1.5 SD in at least one data set (column). Of notice is the participant indicated by the red square (surrounded by a black circle), who showed such a deviation two times and in the same direction. Filled icons represent data from individual participants, open icons the respective grand means (± SEM).
Fig 9
Fig 9. Paradigm of Experiment 2 – schematic overview.
Blocks of Experiment 2 (top red framed) were interlaced with blocks of an unrelated experiment (top black frames). Blocks in Experiment 2 consisted of 3 observation sequences (OS1, OS2, OS3). OS1 was preceded by a symbolic announcement of the upcoming experimental condition (in blue rectangles). Experiment 2 consisted of two experimental conditions. Each stimulus pair in Condition AD consisted of an ambiguous lattice (S1) followed by a disambiguated lattice (S2). The stimulus pairs in Condition AA contained only ambiguous lattices. Like in Experiment 1, participants indicated the perceived 3D orientation of lattice S1 (Task 1). After presentation of S2 they compared the perceived 3D orientation of S2 with the memorized percept from S1 and indicated either reversed percepts or perceptual stability by key press (see Fig 2 for the graphical representation of the tasks). Notice, that for the focus of the current analysis we only analyzed Condition AD. A variant of this figure has already been presented in a recent publication from our lab [see Fig 8 in 61].
Fig 10
Fig 10. Perceptual probability results– Experiment 2.
Depicted are individual probability values, as calculated with the formulas (1–4), introduced above. Any systematic deviation from the dashed grey 0.5 line indicates a perceptual bias in the respective direction (long-term perceptual history effect). Small icons represent data from individual participants, large icons the respective grand means (± SEM). Blue and red lines indicate precognition and history contrasts, respectively.
Fig 11
Fig 11. Perceptual history contrasts– Experiment 2.
Depicted are individual differential probability value contrasts, as indicated on the abscissa. Any systematic deviation from zero indicates an effect of the immediate perceptual history on the perception of the ambiguous Necker lattice. Filled icons represent data from individual participants, open icons the respective grand means (± SEM). Remarkably, the history effects in this experiment had an opposite effect (priming) compared to Experiment 1. Notice that OS1 had no stimulus-specific perceptual history and was thus not analyzed in this way. OS = observation sequence.
Fig 12
Fig 12. Precognition contrasts– Experiment 2.
Depicted are individual differential probability value contrasts, as indicated on the abscissa. Any systematic deviation from zero would indicate a precognition effect. Filled icons represent data from individual participants, open icons the respective grand means (± SEM). We found no significant precognition effects. However three participants (indicated with a red star and light and dark green squares and surrounded by black circles) show systematically extreme values–exceeding 1.5 SDs–across different OS and data sets. Moreover, post-hoc analyses indicated smaller intra-group variability for OS1 (BB-BT) compared to all other data sets (see also Table 2).

Similar articles

Cited by

References

    1. Brascamp J, Sterzer P, Blake R, Knapen T. Multistable Perception and the Role of the Frontoparietal Cortex in Perceptual Inference. Annu Rev Psychol. 2018;69: 77–103. doi: 10.1146/annurev-psych-010417-085944 - DOI - PubMed
    1. Friston K. Prediction, perception and agency. International Journal of Psychophysiology. 2012;83: 248–252. doi: 10.1016/j.ijpsycho.2011.11.014 - DOI - PMC - PubMed
    1. Schmack K, Schnack A, Priller J, Sterzer P. Perceptual instability in schizophrenia: Probing predictive coding accounts of delusions with ambiguous stimuli. Schizophrenia Research: Cognition. 2015;2: 72–77. doi: 10.1016/j.scog.2015.03.005 - DOI - PMC - PubMed
    1. Sterzer P, Voss M, Schlagenhauf F, Heinz A. Decision-making in schizophrenia: A predictive-coding perspective. NeuroImage. 2019;190: 133–143. doi: 10.1016/j.neuroimage.2018.05.074 - DOI - PubMed
    1. van Boxtel JJA, Lu H. A predictive coding perspective on autism spectrum disorders. Frontiers in Psychology. 2013;4. doi: 10.3389/fpsyg.2013.00004 - DOI - PMC - PubMed

Publication types