. 2021 Oct 21;16(10):e0258737.
doi: 10.1371/journal.pone.0258737. eCollection 2021.

Proximal-end bias from in-vitro reconstituted nucleosomes and the result on downstream data analysis

Affiliations

Proximal-end bias from in-vitro reconstituted nucleosomes and the result on downstream data analysis

David A Bates et al. PLoS One. .

Abstract

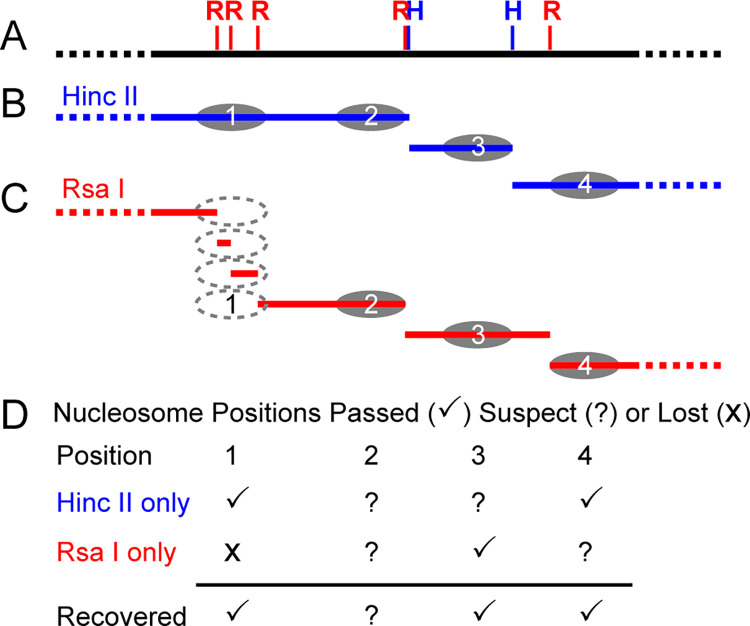
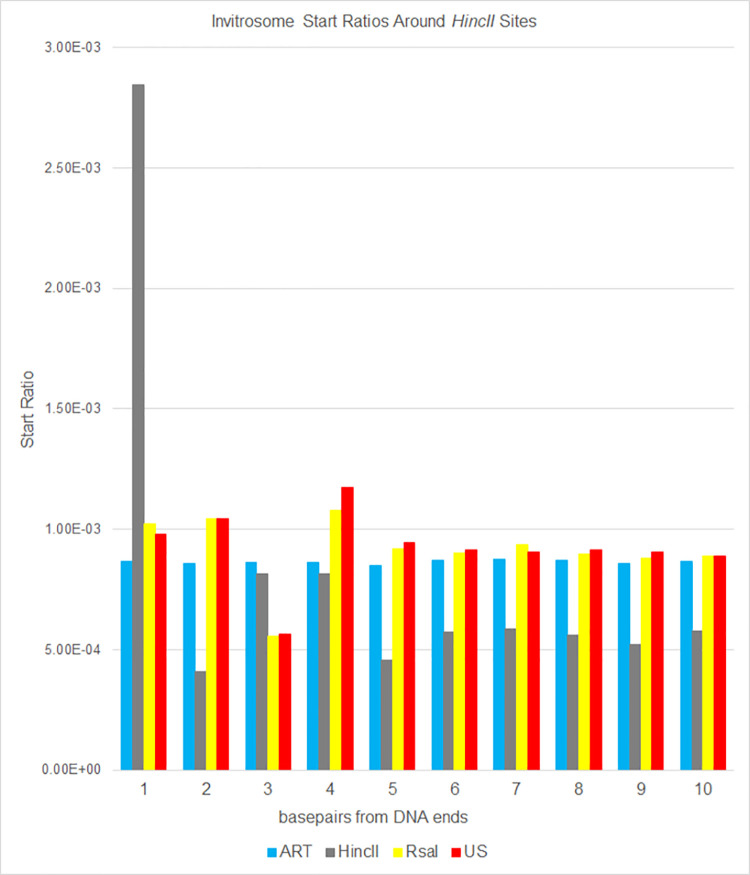
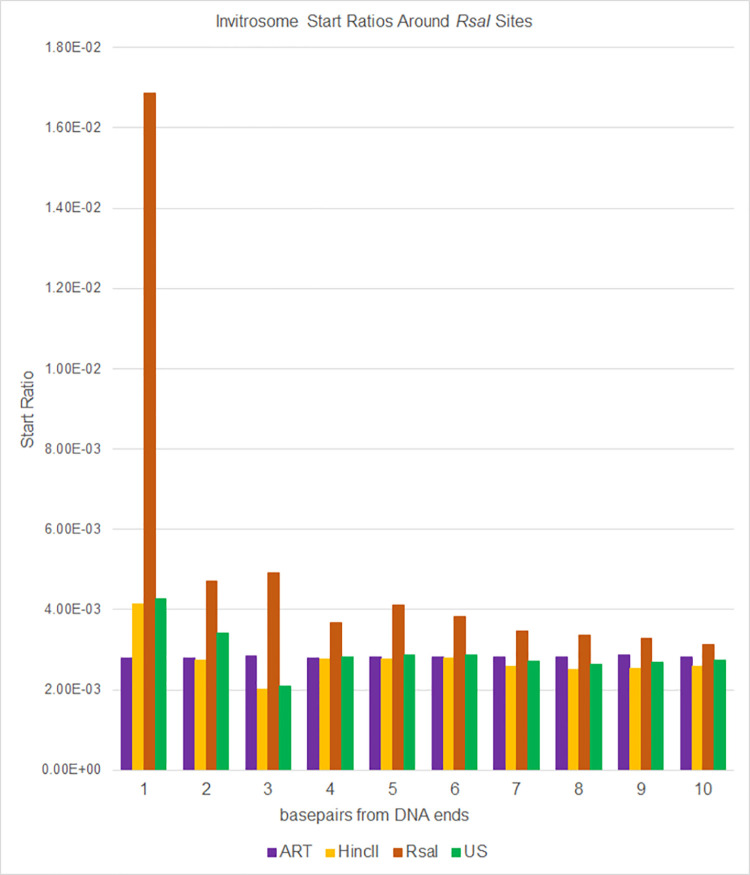
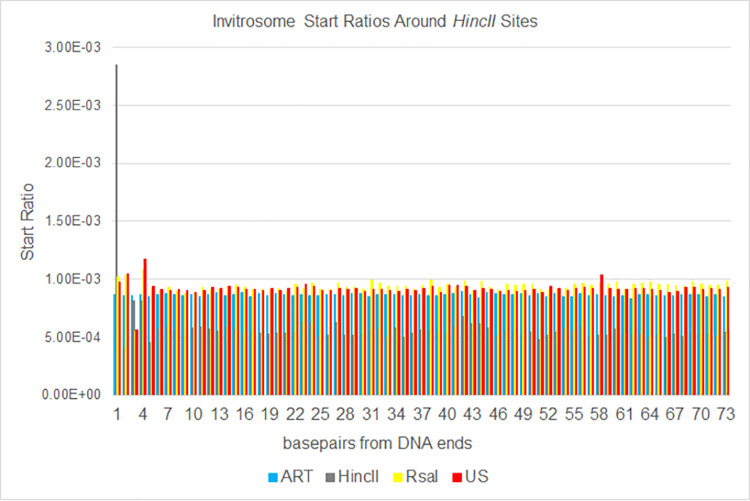
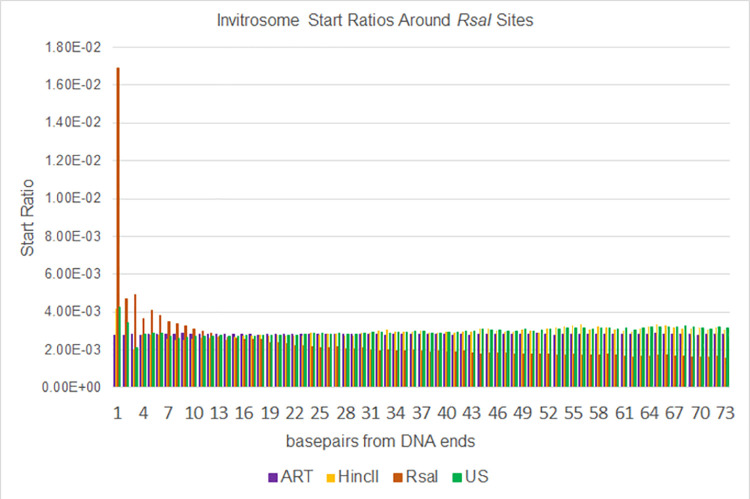
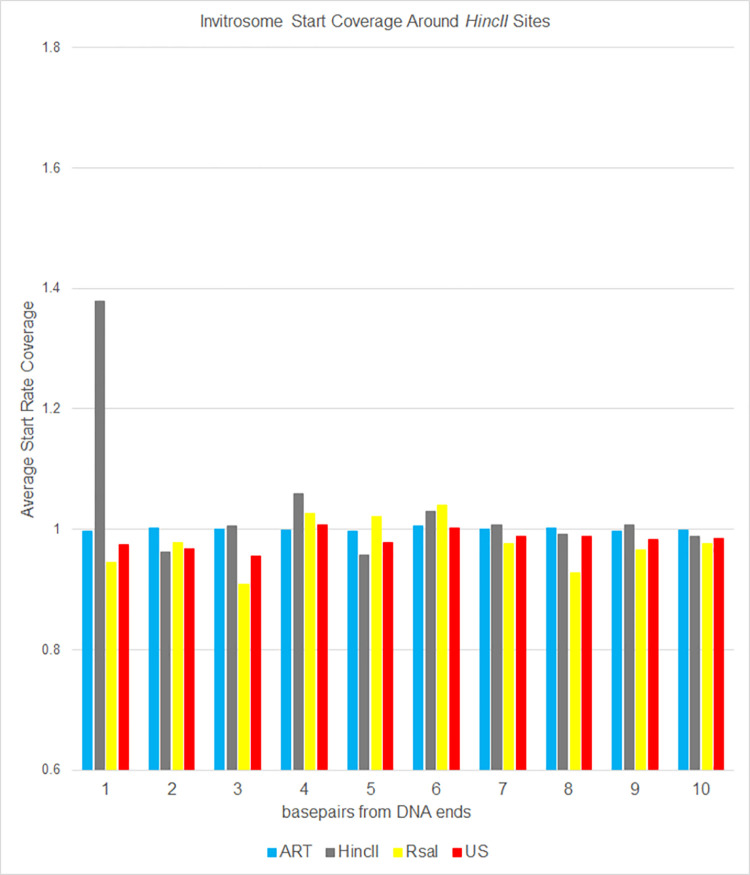
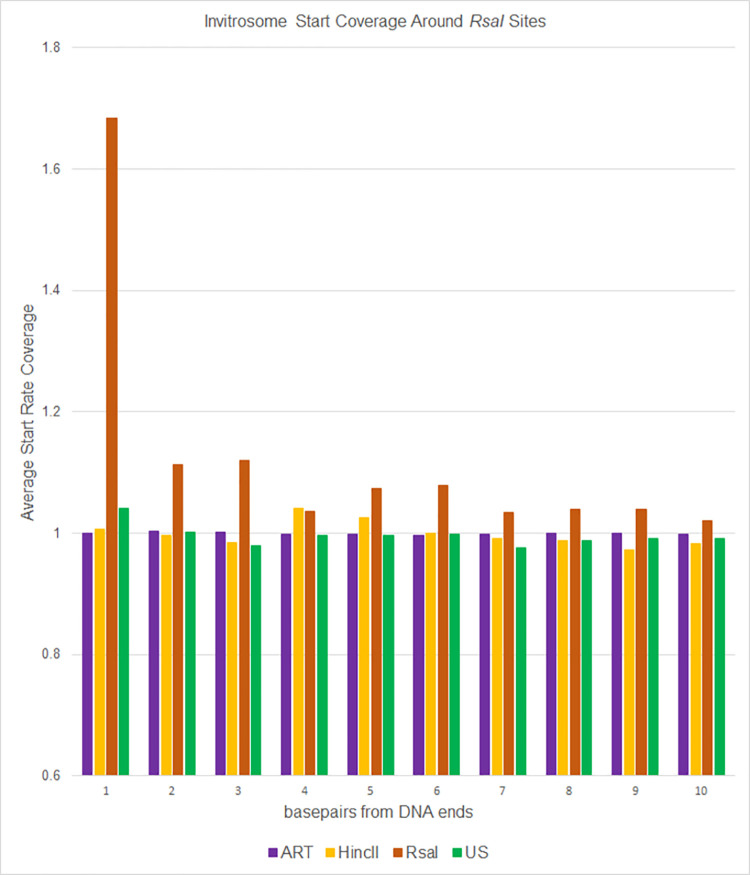
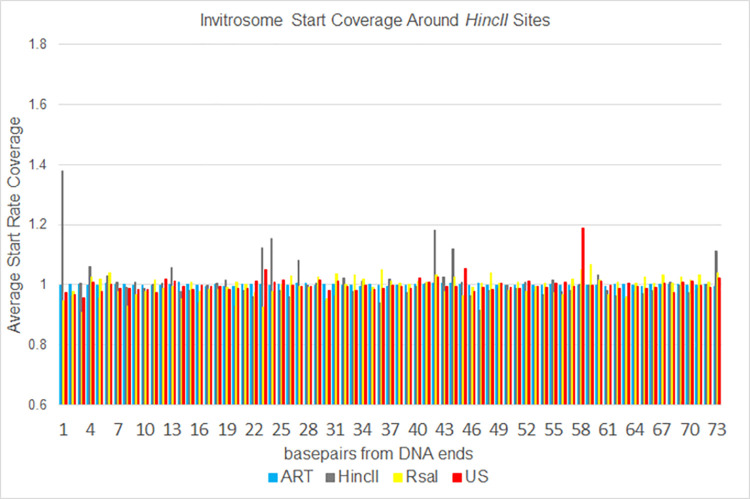
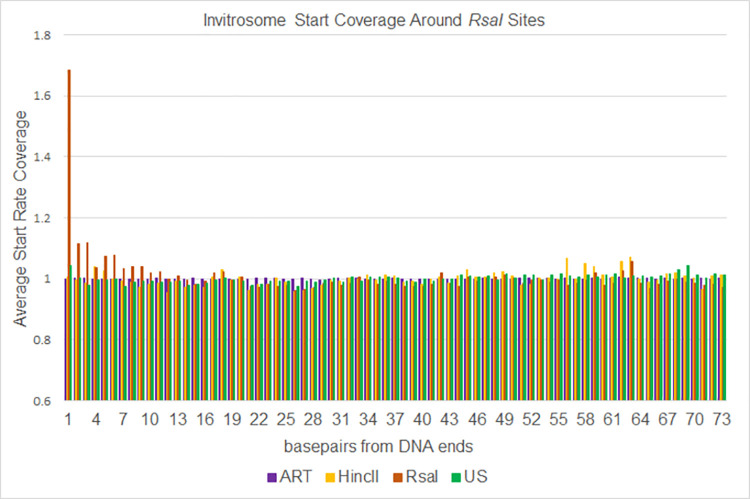
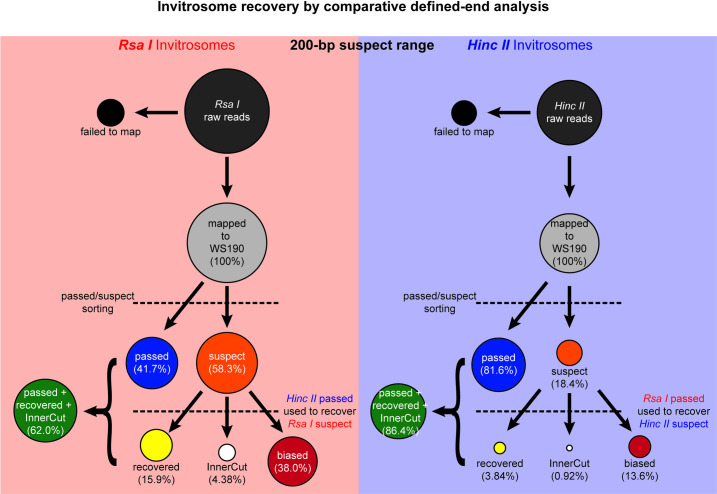
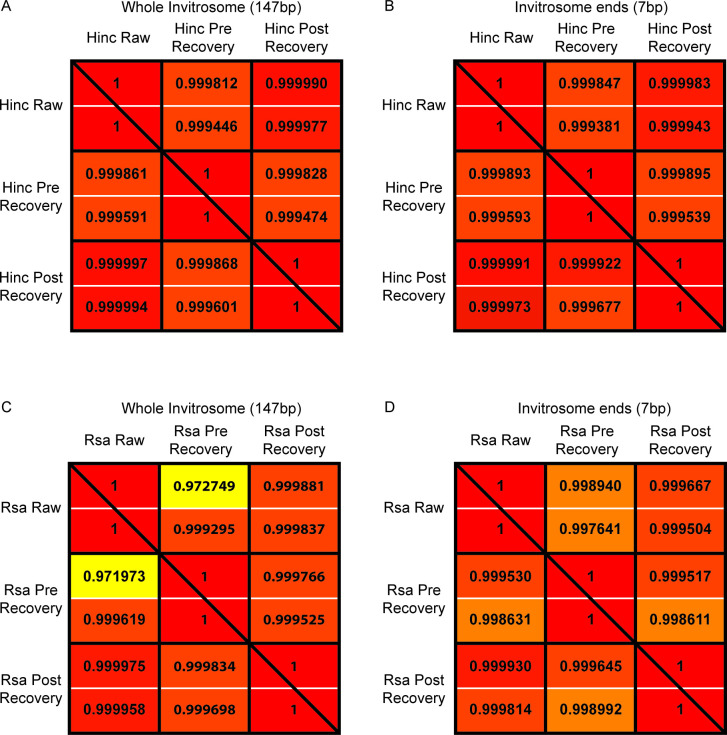
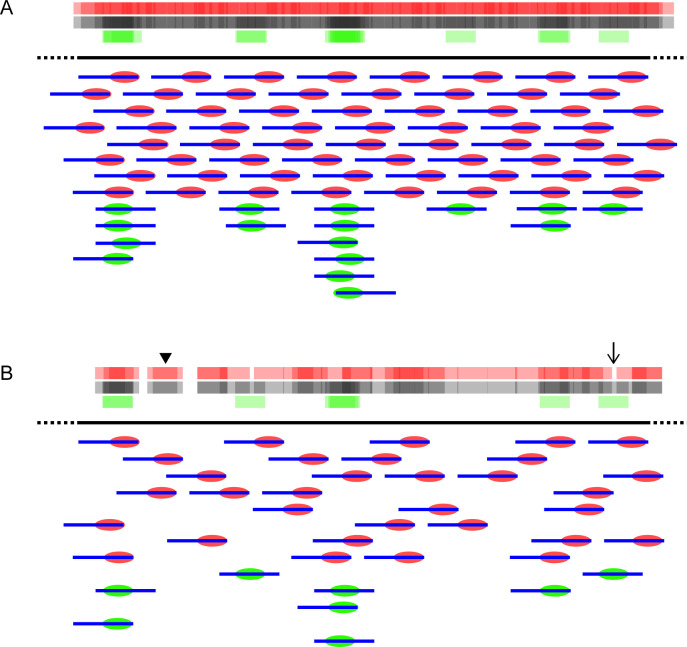
The most basic level of eukaryotic gene regulation is the presence or absence of nucleosomes on DNA regulatory elements. In an effort to elucidate in vivo nucleosome patterns, in vitro studies are frequently used. In vitro, short DNA fragments are more favorable for nucleosome formation, increasing the likelihood of nucleosome occupancy. This may in part result from the fact that nucleosomes prefer to form on the terminal ends of linear DNA. This phenomenon has the potential to bias in vitro reconstituted nucleosomes and skew results. If the ends of DNA fragments are known, the reads falling close to the ends are typically discarded. In this study we confirm the phenomenon of end bias of in vitro nucleosomes. We describe a method in which nearly identical libraries, with different known ends, are used to recover nucleosomes which form towards the terminal ends of fragmented DNA. Finally, we illustrate that although nucleosomes prefer to form on DNA ends, it does not appear to skew results or the interpretation thereof.


Conflict of interest statement

Two authors, DAB and CEB, are brothers. CEB owns and operates the software consulting company, Qubit Software LLC. The contributions of Qubit Software LLC were strictly pro bono, and the custom codes written are publicly available. This does not alter our adherence to PLOS ONE policies on sharing data and materials. Thus the authors declare no conflict of interest.

Figures

Fig 1
Fig 1. Visual depiction of the initial classification and re-classification method.
A) Represents a section of genomic DNA with RsaI and HincII cutsites. B) Representation of the initial fragments of genomic DNA (blue), digested with HincII and subsequent reconstituted nucleosomes. C) Representation of the initial fragments of genomic DNA (red), digested with RsaI and subsequent reconstituted nucleosomes. D) Invitrosome initial classification and subsequent re-classification when compared to the alternate library. A passed or non-suspect invitrosome from one dataset (such as HincII) can recover or save all suspect or lost invitrosomes in the same location in the other dataset (such as RsaI) as demonstrated by position 1 and position 4 nucleosomes.
Fig 2
Fig 2. Ratios of invitrosome starts around HincII restriction sites in the genome.
Ratios were calculated by taking all invitrosome starts at a given position and dividing that number by all invitrosome starts across the genome for each of the four invitrosome data sets (ART, HincII, RsaI and US) individually. Positions 1 through 10 on the x-axis are relative to HincII cut sites across the genome.
Fig 3
Fig 3. Ratios of invitrosome starts around RsaI restriction sites in the genome.
Ratios were calculated by taking all invitrosome starts at a given position and dividing that number by all invitrosome starts across the genome for each of the four invitrosome data sets (ART, HincII, RsaI and US) individually. Positions 1 through 10 on the x-axis are relative to RsaI cut sites across the genome.
Fig 4
Fig 4. Expanded Fig 2.
The same data as shown in Fig 2 expanded out to 73 bases from genomic HincII cut sites.
Fig 5
Fig 5. Expanded Fig 3.
The same data as shown in Fig 3 expanded out to 73 bases from genomic RsaI cut sites.
Fig 6
Fig 6. HincII occupancy of positions.
Average occupancy (or coverage) of invitrosome starts around HincII restriction sites in the genome for each of the four invitrosome data sets (ART, HincII, RsaI and US). Positions 1 through 10 on the x-axis are relative to HincII cut sites across the genome. A value of 1 indicates occupancy at an average rate across the genome. Higher than 1 indicates above average occupancy.
Fig 7
Fig 7. RsaI occupancy of positions.
Average occupancy (or coverage) of invitrosome starts around RsaI restriction sites in the genome for each of the four invitrosome data sets (ART, HincII, RsaI and US). Positions 1 through 10 on the x-axis are relative to RsaI cut sites across the genome. A value of 1 indicates occupancy at an average rate across the genome. Higher than 1 indicates above average occupancy.
Fig 8
Fig 8. Expanded Fig 6.
The same data as shown in Fig 6 expanded out to 73 bases from genomic HincII cut sites.
Fig 9
Fig 9. Expanded Fig 7.
The same data as shown in Fig 7 expanded out to 73 bases from genomic RsaI cut sites.
Fig 10
Fig 10. Reads suspected, recovered, and tossed at 200 bp.
Overview of the recovery method to “rescue” invitrosomes suspected of end bias. Depiction of the percentages of reads, and by extension invitrosomes, during the classification and re-classification method. Invitrosomes too close to DNA fragment ends (in this case within 200 base pairs) were deemed suspect to formation on fragment ends due to end bias. Invitrosomes outside of 200 base pairs from DNA ends were deemed as passed; while invitrosomes containing a cutsite for the respective restriction enzyme within the nucleosomal DNA would normally be discarded are recovered. Using the alternate library’s passed invitrosomes, suspect invitrosomes were re-classified as recovered if a passed invitrosome from the other library could be found at the same position as the suspect invitrosome. The comparative analysis increases the sequencing data available for downstream analysis.
Fig 11
Fig 11. Correlations within sub-libraries.
Correlation between k-mers at each step of recovery. Correlation values for k-mer usage from the HincII data are shown in panels A) and B). Correlation values for k-mer usage from the RsaI data are shown in panels C) and D). In all panels, within each black box, the Pearson correlation value is listed above, and the Spearman correlation value is listed below the white line. Correlation values in the bottom-left-triangle half of the entire panel are between sub-libraries with a 1-bp suspect range, and values in the top-right-triangle half are between sub-libraries with a 11-bp suspect range. Panels A) and C) are k-mer usage correlation values calculated across the entire 147-bp invitrosome DNA, while panels B) and D) are k-mer correlation values looking at k-mer usage only at the ends of invitrosome DNA.
Fig 12
Fig 12. Role of sequencing depth and end bias.
A) Regardless of proximal-end bias taking place, with adequate sequencing depth, the number of in vitro reconstituted nucleosomes (invitrosomes) formed and their proximity to each other prevent underlying sequence bias from obfuscating invitrosomes positioned by DNA sequence. B) With inadequate sequencing depth, the sparse invitrosome coverage in conjunction with proximal-end bias would produce erroneous invitrosome positioning data (black arrowhead) while missing real invitrosome positioning DNA sequences (arrow). In both panels red ovals represent invitrosomes affected by end bias and green ovals represent invitrosomes formed due to DNA sequence preference. Blue lines represent the DNA fragments upon which the invitrosomes have formed. The red bars, green bars and black bars at the top of each panel represent invitrosome occupancy density from end-biased, DNA-sequence positioned, and the combined invitrosome data respectively.

Similar articles

Cited by

References

    1. Khorasanizadeh S. The nucleosome: from genomic organization to genomic regulation. Cell 2004;116(2):259–272. doi: 10.1016/s0092-8674(04)00044-3 - DOI - PubMed
    1. Davey CA, Sargent DF, Luger K, Maeder AW, Richmond TJ. Solvent mediated interactions in the structure of the nucleosome core particle at 1.9 Å resolution. J Mol Biol 2002;319(5):1097–1113. doi: 10.1016/S0022-2836(02)00386-8 - DOI - PubMed
    1. Luger K, Mäder AW, Richmond RK, Sargent DF, Richmond TJ. Crystal structure of the nucleosome core particle at 2.8 Å resolution. Nature 1997;389(6648):251. doi: 10.1038/38444 - DOI - PubMed
    1. Drew HR, Travers AA. DNA bending and its relation to nucleosome positioning. J Mol Biol 1985;186(4):773–790. doi: 10.1016/0022-2836(85)90396-1 - DOI - PubMed
    1. Negri R, Buttinelli M, Panetta G, De Arcangelis V, Di Mauro E, Travers A. Sequence dependence of translational positioning of core nucleosomes. J Mol Biol 2001;307(4):987–999. doi: 10.1006/jmbi.2001.4546 - DOI - PubMed

Publication types