. 2022 Mar;24(3):1263-1278.
doi: 10.1111/1462-2920.15812. Epub 2021 Oct 21.

Differential response to prey quorum signals indicates predatory specialization of myxobacteria and ability to predate Pseudomonas aeruginosa

Affiliations

Differential response to prey quorum signals indicates predatory specialization of myxobacteria and ability to predate Pseudomonas aeruginosa

Shukria Akbar et al. Environ Microbiol. 2022 Mar.

Abstract

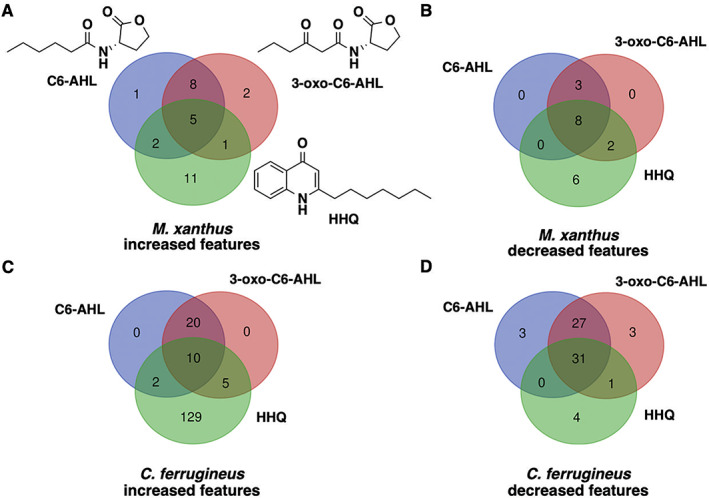
Multiomic analysis of transcriptional and metabolic responses from the predatory myxobacteria Myxococcus xanthus and Cystobacter ferrugineus exposed to prey signalling molecules of the acylhomoserine lactone and quinolone quorum signalling classes provided insight into predatory specialization. Acylhomoserine lactone quorum signals elicited a general response from both myxobacteria. We suggest that this is likely due to the generalist predator lifestyles of myxobacteria and ubiquity of acylhomoserine lactone signals. We also provide data that indicates the core homoserine lactone moiety included in all acylhomoserine lactone scaffolds to be sufficient to induce this general response. Comparing both myxobacteria, unique transcriptional and metabolic responses were observed from Cystobacter ferrugineus exposed to the quinolone signal 2-heptylquinolin-4(1H)-one (HHQ) natively produced by Pseudomonas aeruginosa. We suggest that this unique response and ability to metabolize quinolone signals contribute to the superior predation of P. aeruginosa observed from C. ferrugineus. These results further demonstrate myxobacterial eavesdropping on prey signalling molecules and provide insight into how responses to exogenous signals might correlate with prey range of myxobacteria.


Figures

Fig. 1
Fig. 1
Transcriptomic data from myxobacteria exposed to C6‐AHL. A. Differentially expressed genes and features from M. xanthus exposed to C6‐AHL when compared with signal unexposed M. xanthus control (p ≤ 0.05); * indicates features also impacted at p ≤ 0.01. B. Differentially expressed genes from C. ferrugineus exposed to C6‐AHL when compared with signal unexposed C. ferrugineus control (p ≤ 0.01). Data depicted as an average log2 fold change from three biological replicates. Impacted features annotated as hypothetical not included.
Fig. 2
Fig. 2
Putative roles of Prokaryotic Genome Annotation Pipeline (PGAP)‐annotated genes impacted by C6‐AHL exposure (from Fig. 1) comparing M. xanthus and C. ferrugineus.
Fig. 3
Fig. 3
Transcriptomic data from myxobacteria exposed to HHQ. A. Differentially expressed genes and features from M. xanthus exposed to HHQ when compared with signal unexposed M. xanthus control (p ≤ 0.05). B. Differentially expressed genes from C. ferrugineus exposed to HHQ when compared with signal unexposed C. ferrugineus control (p ≤ 0.05). Data depicted as an average log2 fold change from three biological replicates. Impacted features annotated as hypothetical not included.
Fig. 4
Fig. 4
Putative roles of PGAP‐annotated genes impacted by HHQ exposure (from Fig. 3) comparing M. xanthus and C. ferrugineus.
Fig. 5
Fig. 5
Comparison of metabolomic response to C6‐AHL, 3‐oxo‐C6‐AHL and HHQ exposure experiments with M. xanthus (A and B) and C. ferrugineus (C and D). Numbers included in each Venn diagram account for a unique detected feature with a significantly impacted intensity upon exposure to the indicated signalling molecule provided by XCMS‐multigroup analysis (n = 3, p ≤ 0.02).
Fig. 6
Fig. 6
Comparison of metabolomic response to C6‐AHL, 3‐oxo‐C6‐AHL, and HHQ exposure experiments with M. xanthus (A and B) and C. ferrugineus (C and D) including additional C6‐AHL + HHQ exposure experiments. Numbers included in each Venn diagram account for a unique detected feature with a significantly impacted intensity upon exposure to the indicated signalling molecule provided by XCMS‐multigroup analysis (n = 3, p ≤ 0.02).
Fig. 7
Fig. 7
Overlap in metabolic response to C6‐AHL, 3‐oxo‐C6‐AHL and l‐HSL exposure observed from C. ferrugineus. Venn diagrams include the number of metabolic features with a significant increase (A) or decrease (B) in detected ion intensity compared with signal unexposed controls provided by XCMS‐multigroup analysis (n = 3; p ≤ 0.02). Red circles indicate overlapping metabolic features of l‐HSL with C6‐AHL and 3‐oxo‐C6‐AHL.
Fig. 8
Fig. 8
A. Extracted ion chromatograph (EIC) depicting presence of HQNO and PQS in HHQ exposed extracts from C. ferrugineus and not observed in HHQ exposed extracts from M. xanthus. B. EIC depicting presence of PQS‐NO in HHQ exposed extracts of C. ferrugineus, also not present in M. xanthus extracts. Chromatographs rendered with MZmine v2.37. C. Oxidative detoxification of HHQ by C. ferrugineus including exact mass values from ChemDraw Professional v17.1. D. Detected ion intensities for PQS‐NO comparing crude extracts of C. ferrugineus exposed to HHQ, PQS and HQNO; detected intensity data provided by XCMS‐multigroup analysis (n = 3; p ≤ 0.02).
Fig. 9
Fig. 9
A. Lawn culture predation assay data depicting superior predation of P. aeruginosa by C. ferrugineus (n = 3; p ≤ 0.005). Statistical significance calculated using an unpaired t test with Welch's correction. B. Swarming expansion assay data depicting HHQ inhibition of M. xanthus swarming (n = 4) with significant differences in swarm diameters (p < 0.001) observed between HHQ exposed and unexposed data after day 3. C. Swarming expansion assay data depicting no significant inhibition of C. ferrugineus swarming (n = 4) during HHQ exposure conditions. Statistical significance for swarming assays was determined using two‐way ANOVA and Tukey's multiple comparisons test.

References

    1. Adusumilli, R. , and Mallick, P. (2017) Data conversion with ProteoWizard msConvert. Methods Mol Biol 1550: 339–368. - PubMed
    1. Akbar, S. , Dowd, S.E. , and Stevens, D.C. (2017) Draft genome sequence of Cystobacter ferrugineus strain Cbfe23. Genome Announc 5: e01601‐16. - PMC - PubMed
    1. Albataineh, H. , Duke, M. , Misra, S.K. , Sharp, J.S. , and Stevens, D.C. (2021) Identification of a solo acylhomoserine lactone synthase from the myxobacterium Archangium gephyra . Sci Rep 11: 3018. - PMC - PubMed
    1. Arend, K.I. , Schmidt, J.J. , Bentler, T. , Luchtefeld, C. , Eggerichs, D. , Hexamer, H.M. , and Kaimer, C. (2020) Myxococcus xanthus predation of gram‐positive or gram‐negative bacteria is mediated by different bacteriolytic mechanisms. Appl Environ Microbiol 87: e02382‐20. - PMC - PubMed
    1. Baikalov, I. , Schroder, I. , Kaczor‐Grzeskowiak, M. , Grzeskowiak, K. , Gunsalus, R.P. , and Dickerson, R.E. (1996) Structure of the Escherichia coli response regulator NarL. Biochemistry 35: 11053–11061. - PubMed

Supplementary concepts

LinkOut - more resources