

Intermediate Renal Outcomes, Kidney Failure, and Mortality in Obese Kidney Donors
- PMID: 34675059
- PMCID: PMC8806092
- DOI: 10.1681/ASN.2021040548
Intermediate Renal Outcomes, Kidney Failure, and Mortality in Obese Kidney Donors
Abstract
Background: Obesity is associated with the two archetypal kidney disease risk factors: hypertension and diabetes. Concerns that the effects of diabetes and hypertension in obese kidney donors might be magnified in their remaining kidney have led to the exclusion of many obese candidates from kidney donation.
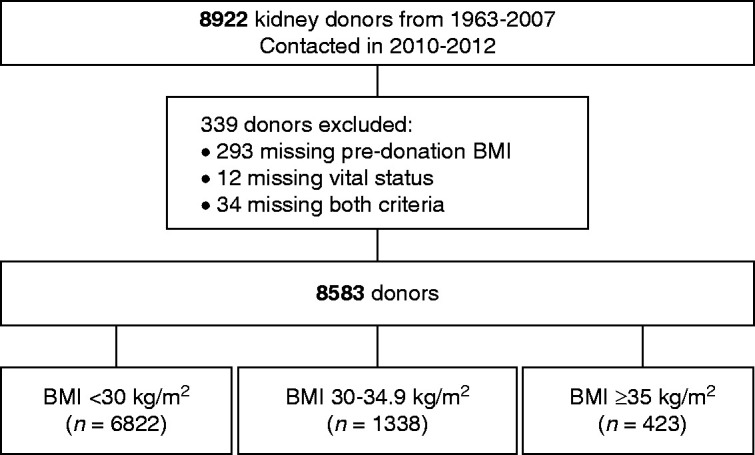
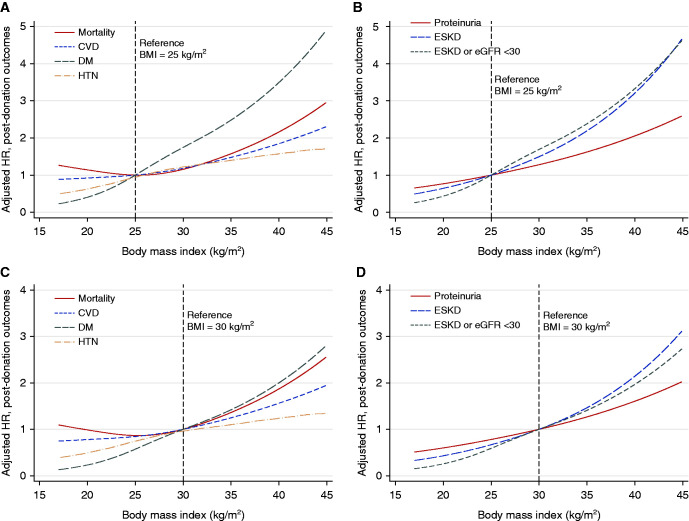
Methods: We compared mortality, diabetes, hypertension, proteinuria, reduced eGFR and its trajectory, and the development of kidney failure in 8583 kidney donors, according to body mass index (BMI). The study included 6822 individuals with a BMI of <30 kg/m2, 1338 with a BMI of 30-34.9 kg/m2, and 423 with a BMI of ≥35 kg/m2. We used Cox regression models, adjusting for baseline covariates only, and models adjusting for postdonation diabetes, hypertension, and kidney failure as time-varying covariates.
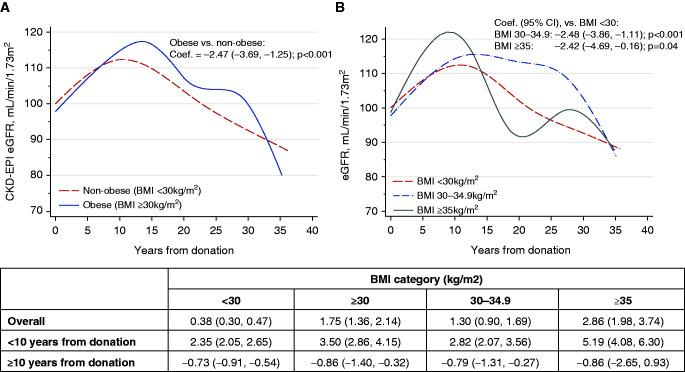
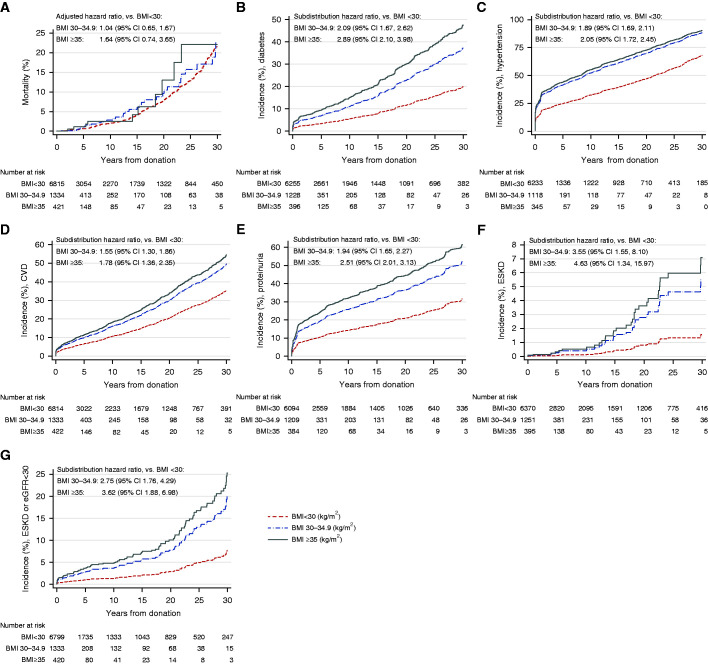
Results: Obese donors were more likely than nonobese donors to develop diabetes, hypertension, and proteinuria. The increase in eGFR in obese versus nonobese donors was significantly higher in the first 10 years (3.5 ml/min per 1.73m2 per year versus 2.4 ml/min per 1.73m2 per year; P<0.001), but comparable thereafter. At a mean±SD follow-up of 19.3±10.3 years after donation, 31 (0.5%) nonobese and 12 (0.7%) obese donors developed ESKD. Of the 12 patients with ESKD in obese donors, 10 occurred in 1445 White donors who were related to the recipient (0.9%). Risk of death in obese donors was not significantly increased compared with nonobese donors.
Conclusions: Obesity in kidney donors, as in nondonors, is associated with increased risk of developing diabetes and hypertension. The absolute risk of ESKD is small and the risk of death is comparable to that of nonobese donors.
Keywords: glomerular filtration rate; hypertension; kidney donation; living donation; obesity; outcomes.
Copyright © 2021 by the American Society of Nephrology.
Figures
Comment in
-
Understanding Risks and Our Responsibility to Living Donors.J Am Soc Nephrol. 2021 Nov;32(11):2691-2693. doi: 10.1681/ASN.2021081129. J Am Soc Nephrol. 2021. PMID: 34716238 Free PMC article. No abstract available.
References
-
- Wang Y, Chen X, Song Y, Caballero B, Cheskin LJ: Association between obesity and kidney disease: A systematic review and meta-analysis. Kidney Int 73: 19–33, 2008 - PubMed
-
- Mandelbrot DA, Pavlakis M, Danovitch GM, Johnson SR, Karp SJ, Khwaja K, et al. : The medical evaluation of living kidney donors: A survey of US transplant centers. Am J Transplant 7: 2333–2343, 2007 - PubMed
MeSH terms
Substances
LinkOut - more resources
Full Text Sources
Medical
Research Materials
Miscellaneous
