. 2022 Jan 11;98(2):e152-e163.
doi: 10.1212/WNL.0000000000013006. Epub 2021 Oct 21.

Bilateral Structural Network Abnormalities in Epilepsy Associated With Bottom-of-Sulcus Dysplasia

Affiliations

Bilateral Structural Network Abnormalities in Epilepsy Associated With Bottom-of-Sulcus Dysplasia

Remika Mito et al. Neurology. .

Abstract

Background and objectives: To identify white matter fiber tracts that exhibit structural abnormality in patients with bottom-of-sulcus dysplasia (BOSD) and investigate their association with seizure activity.

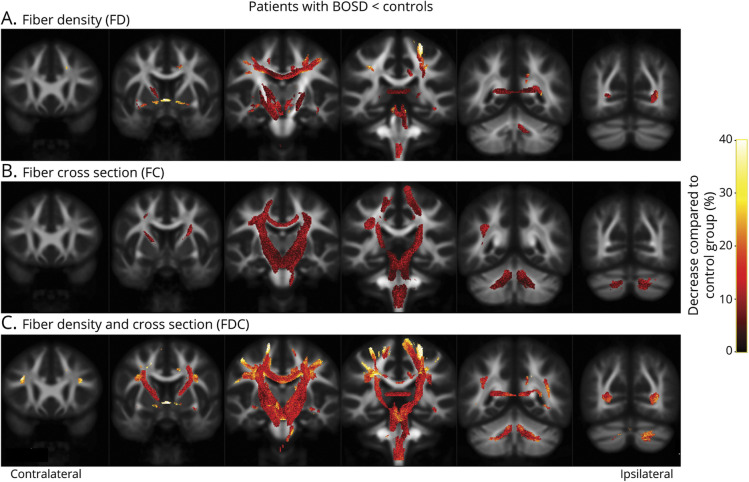
Methods: Whole-brain fixel-based analysis of diffusion MRI data was performed to identify white matter fiber tracts with significant reductions in fiber density and cross-section in patients with BOSD (n = 20) when compared to healthy control participants (n = 40). Results from whole-brain analysis were used to investigate the association of fiber tract abnormality with seizure frequency and epilepsy duration.

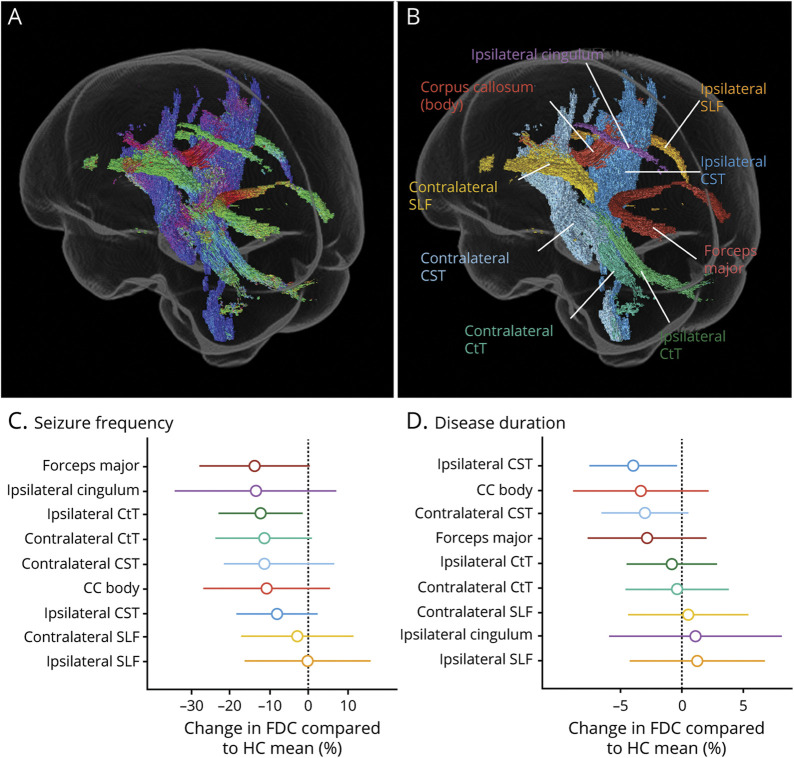
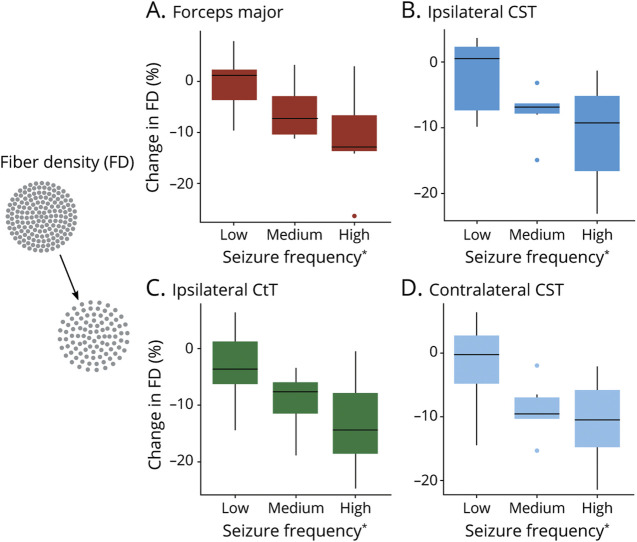
Results: Despite the focal nature of the dysplasia, patients with BOSD showed widespread abnormality in white matter fiber tracts, including the bilateral corticospinal, corticothalamic, and cerebellothalamic tracts, superior longitudinal fasciculi, corpus callosum (body), and the forceps major. This pattern of bilateral connectivity reduction was not related to the laterality of the lesion. Exploratory post hoc analyses showed that high seizure frequency was associated with greater reduction in fiber density at the forceps major, bilateral corticospinal, and cerebellothalamic tracts.

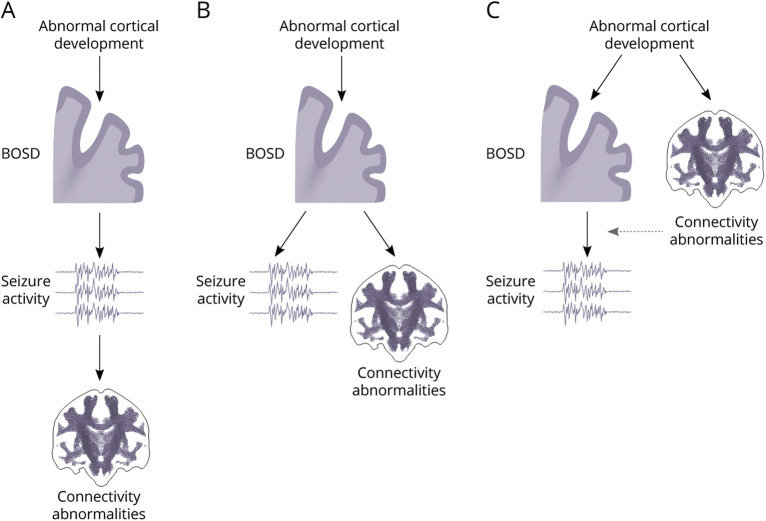
Discussion: We demonstrate evidence of a bilaterally distributed, specific white matter network that is vulnerable to disruption in BOSD. The degree of tract abnormality is partly related to seizure activity, but additional contributors such as the genetic background and effects of treatment or environment have not been excluded.


Figures

Figure 1
Figure 1. Fiber Tracts Exhibiting Significant Reductions in Patients With Bottom-of-Sulcus Dysplasia (BOSD) With Aligned Lesion Hemisphere
Fiber pathways exhibiting significant reductions in fiber density (FD; A), fiber bundle cross-section (FC; B), and fiber density and cross-section (FDC; C) in patients with BOSD compared to control participants are displayed on coronal slices at 18-mm increments. Significant results from whole-brain fixel-based analysis are shown on streamline segments that have been cropped from the template tractogram to include only streamline points that correspond to significant fixels (family-wise error–corrected p value <0.05). Streamlines are colored by percentage decrease in patients with BOSD compared to controls.
Figure 2
Figure 2. Fiber Tracts Exhibiting Significant Fiber Density and Cross-section (FDC) Reductions in Bottom-of-Sulcus Dysplasia (BOSD) and Their Association With Seizure Frequency and Disease Duration
The streamlines corresponding to fixels that exhibited significant reductions in FDC in the BOSD group (Figure 1C) are shown in a glass brain representation to demonstrate the 3D extent of structural white matter abnormalities. These streamlines are colored by direction in (A) (blue: superior-inferior; green: anterior-posterior; red: left-right). The same fiber structures are shown in (B), this time colored by the fiber tract to which they belong. Nine fiber tracts were identified and post hoc comparisons with clinical metrics were performed by extracting mean fixel-based metrics within each of this fiber tracts. Effect sizes from these linear models are shown for each tract in the bottom 2 panels, with bars representing 95% confidence intervals. (C) The effect sizes reflect the percentage change in FDC (compared to the healthy control [HC] mean) in each given tract going between low and high seizure frequency categories. The tracts are ordered by effect size (largest to smallest effect). The largest effect of seizure frequency on tract FDC was observed in the forceps major. (D) Effect sizes are shown for each tract and reflect the percentage change in FDC (compared to the HC mean) for that tract per 10 years of disease duration. The largest effect of disease duration on tract FDC was observed in the corticospinal tracts (CSTs). CC = corpus callosum; CtT = cerebellothalamic tract; SLF = superior longitudinal fasciculus.
Figure 3
Figure 3. Association Between Tract Fiber Density (FD) Metric and Seizure Frequency
Fixels that exhibited significant decreases in FD and cross-section in the BOSD group when compared to the healthy controls were categorized into 9 fiber tracts. Fiber tracts are shown in the glass brain representation in Figure 2B. We hypothesized that FD changes likely relate to acute injury as they reflect axonal loss, and thus we explored the association with seizure frequency (*patient-reported seizure frequency was categorized into low, medium, and high categories). The relationship between seizure frequency and tract FD (expressed as % change from the healthy control mean) is shown for the 4 tracts (A–D) that exhibited a significant relationship with seizure frequency adjusting for intracranial volume. These relationships were significant after FDR correction for the multiple tract comparisons. CST = corticospinal tract; CtT = cerebellothalamic tract.
Figure 4
Figure 4. Three Possible Models for the Occurrence of Connectivity Abnormalities in Bottom-of-Sulcus Dysplasia (BOSD)
Development of BOSD results from abnormal migration and apoptosis during cortical development. Here, we refer to abnormal cortical development as the mechanisms driving the formation of a BOSD, which may relate to genetic causes. There are a number of different mechanisms by which connectivity abnormalities may arise in BOSD. (A) BOSDs are epileptogenic lesions that drive seizure activity. Connectivity abnormalities could in turn be a secondary consequence of seizure activity. (B) Connectivity abnormalities could be secondary to the development of a BOSD, but independent of seizure activity. (C) Connectivity abnormalities could arise in parallel to the development of a BOSD, potentially related to the abnormal cortical development. The epileptogenicity of BOSD lesions may be affected by being associated with abnormal structural networks (dotted arrow), although there is no direct evidence of such an effect. It is possible that a combination of all 3 of these scenarios occurs in patients with BOSD, and that abnormalities in some fiber pathways arise in line with one model, while abnormalities in others arise in line with another.

Similar articles

Cited by

References

    1. Bernasconi A. Connectome-based models of the epileptogenic network: a step towards epileptomics? Brain. 2017;140(10):2525-2527. - PubMed
    1. Tavakol S, Royer J, Lowe AJ, et al. . Neuroimaging and connectomics of drug‐resistant epilepsy at multiple scales: from focal lesions to macroscale networks. Epilepsia. 2019;60(4):593-604. - PMC - PubMed
    1. Hong S-J, Lee H-M, Gill R, et al. . A connectome-based mechanistic model of focal cortical dysplasia. Brain. 2019;142(3):688-699. - PMC - PubMed
    1. Hong S-J, Bernhardt BC, Gill RS, Bernasconi N, Bernasconi A. The spectrum of structural and functional network alterations in malformations of cortical development. Brain. 2017;140(8):2133-2143. - PubMed
    1. Barkovich AJ, Kuzniecky RI, Jackson GD, Guerrini R, Dobyns WB. A developmental and genetic classification for malformations of cortical development. Neurology. 2005;65(12):1873-1887. - PubMed

Publication types

MeSH terms