. 2021 Oct 21;11(1):20818.
doi: 10.1038/s41598-021-00146-4.

Enhanced hyperspectral tomography for bioimaging by spatiospectral reconstruction

Affiliations

Enhanced hyperspectral tomography for bioimaging by spatiospectral reconstruction

Ryan Warr et al. Sci Rep. .

Abstract

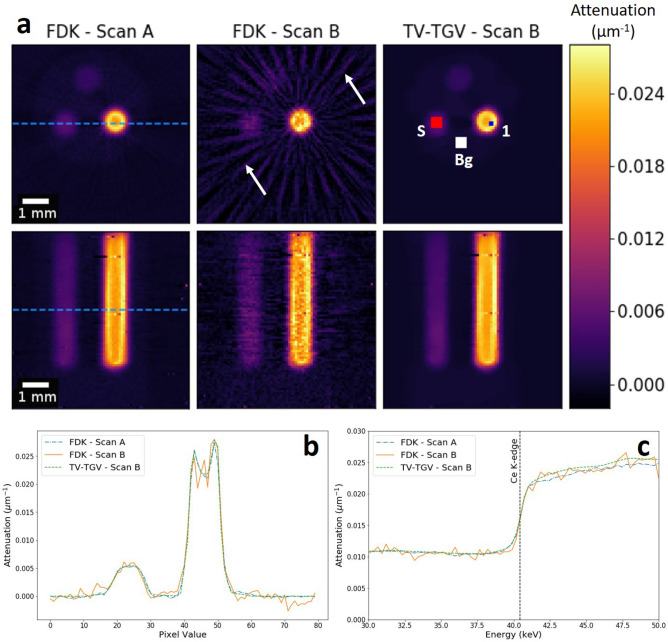
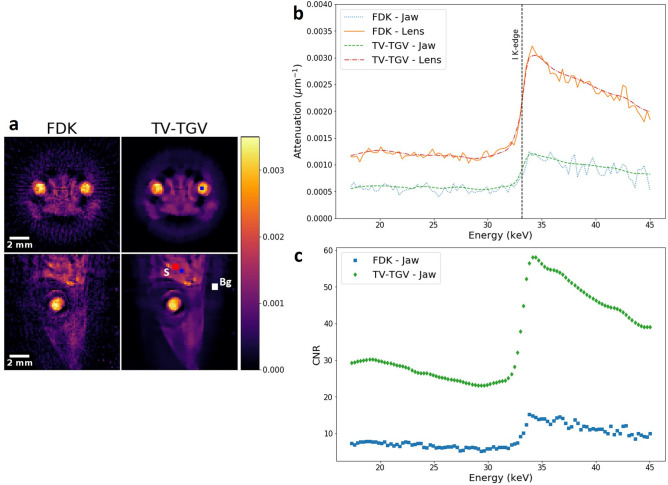
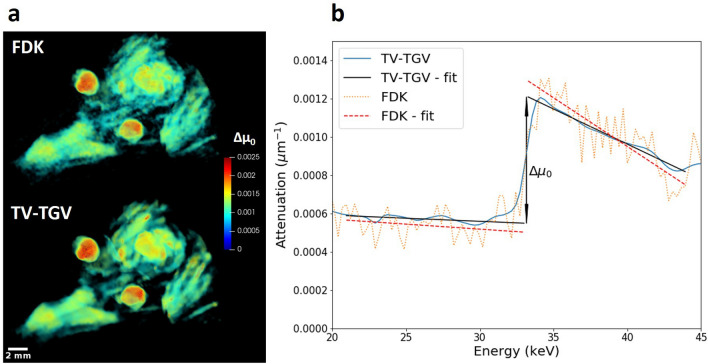
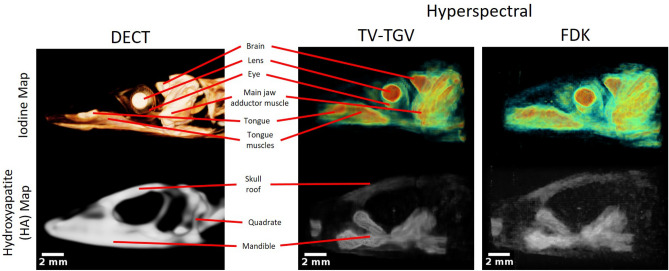
Here we apply hyperspectral bright field imaging to collect computed tomographic images with excellent energy resolution (~ 1 keV), applying it for the first time to map the distribution of stain in a fixed biological sample through its characteristic K-edge. Conventionally, because the photons detected at each pixel are distributed across as many as 200 energy channels, energy-selective images are characterised by low count-rates and poor signal-to-noise ratio. This means high X-ray exposures, long scan times and high doses are required to image unique spectral markers. Here, we achieve high quality energy-dispersive tomograms from low dose, noisy datasets using a dedicated iterative reconstruction algorithm. This exploits the spatial smoothness and inter-channel structural correlation in the spectral domain using two carefully chosen regularisation terms. For a multi-phase phantom, a reduction in scan time of 36 times is demonstrated. Spectral analysis methods including K-edge subtraction and absorption step-size fitting are evaluated for an ex vivo, single (iodine)-stained biological sample, where low chemical concentration and inhomogeneous distribution can affect soft tissue segmentation and visualisation. The reconstruction algorithms are available through the open-source Core Imaging Library. Taken together, these tools offer new capabilities for visualisation and elemental mapping, with promising applications for multiply-stained biological specimens.


Conflict of interest statement

The authors declare no competing interests.

Figures

Figure 1
Figure 1
Attenuation variation in the spectral dimension for a multi-phase powder phantom. (a) Set of four sinograms taken between channels 100-175 at equal spacing of 25 channels (corresponding average energies are shown-channel width 1.2 keV) for Scan A. A single discontinuity in the sinograms appears due to an interrupted scan. (b) The corresponding FDK reconstructions for each energy channel of the sinograms in (a). Three distinct regions are observed, corresponding to the three metal-based powders. The colour scale measures the attenuation, and is consistent across both images. Three ROIs are highlighted (white/blue squares, marked by numbers for each respective powder phase). (c) Average voxel spectra of powder phase ROI 1. A line signifying the theoretical position of the cerium K-edge is overlaid for comparison. (d) Comparison of measured absorption spectra (top) for ROIs 2 and 3 located in the zinc oxide and iron phases respectively, and the theoretical values (bottom) over the same spectral range.
Figure 2
Figure 2
Comparison of reconstruction algorithms. (a) Transverse and frontal slices, showing reconstructions for FDK of sample Scan A (left column), followed by Scan B reconstructions with FDK (middle column), and TV-TGV (right column). All reconstructed slices are shown for a single energy channel (42.27 keV-channel width 1.2 keV). Dashed lines indicate the positions from which spatial profiles were measured for each reconstruction. White arrows mark examples of streak artefacts due to photon starvation. ROIs in the ZnO phase (red-S) and the Al phase (white-Bg) are highlighted for use in CNR calculations. (b) Spatial profile across two powder phases for the same energy channel. (c) Absorption spectra for ROI 1 within the cerium powder region [blue square in (a)].
Figure 3
Figure 3
Reconstruction comparison using different image quality metrics. (a) Channelwise CNR calculations between the ZnO and the Al phase ROIs for an image slice in the transverse plane. Average values across the energy range were 27.44, 7.81 and 38.26 for FDK Scan A, FDK and TV-TGV Scan B respectively. (b) Channelwise RMSE values calculated using ROI 1 within the cerium phase. Values are calculated for all channels through comparison between Scan A and each respective Scan B reconstruction.
Figure 4
Figure 4
Biological feature identification via regularised reconstruction. (a) Reconstructed slices for channel 120 (33.95 keV-channel width 1.2 keV), along both the axial and sagittal dimensions, following FDK (left column) and TV-TGV (right column) reconstruction. General noise reduction and smoothing due to TV regularisation is observed over all spatial regions. (b) Absorption spectra measured for a ROI in two sections of the sample (blue squares in (a)-lens and jaw adductor muscle). A line signifying the theoretical position of the iodine K-edge is overlaid for comparison. (c) Channelwise CNR calculations of the stained jaw adductor muscle using the signal ROI (red-S) and the background ROI (white-Bg), for the image slice shown in the sagittal plane. Average CNR values across the energy range were 8.91 and 35.97 for FDK and TV-TGV respectively.
Figure 5
Figure 5
Attenuation step size analysis for the iodine K-edge. (a) 3D visualisations of the step size in the absorption edge, Δμ0, corresponding to relative iodine concentration. Images are shown for the lizard head sample following both FDK (upper left) and TV-TGV (lower left) reconstruction. (b) Absorption spectra acquired within the jaw adductor muscle for the same ROI in each reconstructed volume. Linear fits were acquired and extrapolated to the extremities of the absorption edge, where the relative changes in attenuation values were measured.
Figure 6
Figure 6
Lizard head segmentation comparison for hyperspectral and dual-energy imaging. Sagittal views of the segmented sample, producing maps of iodine-stained soft tissue (top row) and remaining hydroxyapatite (bottom row) bone structures. Results following K-edge subtraction for the TV-TGV reconstructed dataset (middle column) are directly compared to those following DECT acquisition of the same sample (left column), reduced to the same spatial resolution (137 μm). Labels indicate the successful segmentation of several iodine-stained soft tissue regions for the hyperspectral dataset, with similar structures identified in the DECT equivalent image. A comparison of HA maps show distinct bone structures observed across both datasets, as well as the accumulation of bone mineral in particular regions due to long term sample storage. Included is an example of a bone structure (quadrate) unidentified in TV-TGV segmentation. (Right column) Equivalent maps following FDK reconstruction of the hyperspectral dataset are also shown, with significant noise hiding a number of key features.

References

    1. Davis G, Jain N, Elliott J. A modelling approach to beam hardening correction. Dev. X-Ray Tomogr. VI. 2008;7078:70781E. doi: 10.1117/12.794808. - DOI
    1. Prebble H, et al. Induced macrophage activation in live excised atherosclerotic plaque. Immunobiology. 2018;223:526–535. doi: 10.1016/j.imbio.2018.03.002. - DOI - PubMed
    1. Aamir, R. et al. MARS spectral molecular imaging of lamb tissue: data collection and image analysis. J. Instrum.9, 10.1088/1748-0221/9/02/P02005 (2014).
    1. Anderson NG, et al. Spectroscopic (multi-energy) CT distinguishes iodine and barium contrast material in MICE. Eur. Radiol. 2010;20:2126–2134. doi: 10.1007/s00330-010-1768-9. - DOI - PubMed
    1. Anderson NG, Butler AP. Clinical applications of spectral molecular imaging: potential and challenges. Contrast Media Mol. Imaging. 2014;9:3–12. doi: 10.1002/cmmi.1550. - DOI - PubMed

Publication types