Multicenter Study
. 2021 Oct 21;11(1):20793.
doi: 10.1038/s41598-021-00190-0.

Cytokine signature and COVID-19 prediction models in the two waves of pandemics

Affiliations
Multicenter Study

Cytokine signature and COVID-19 prediction models in the two waves of pandemics

Serena Cabaro et al. Sci Rep. .

Abstract

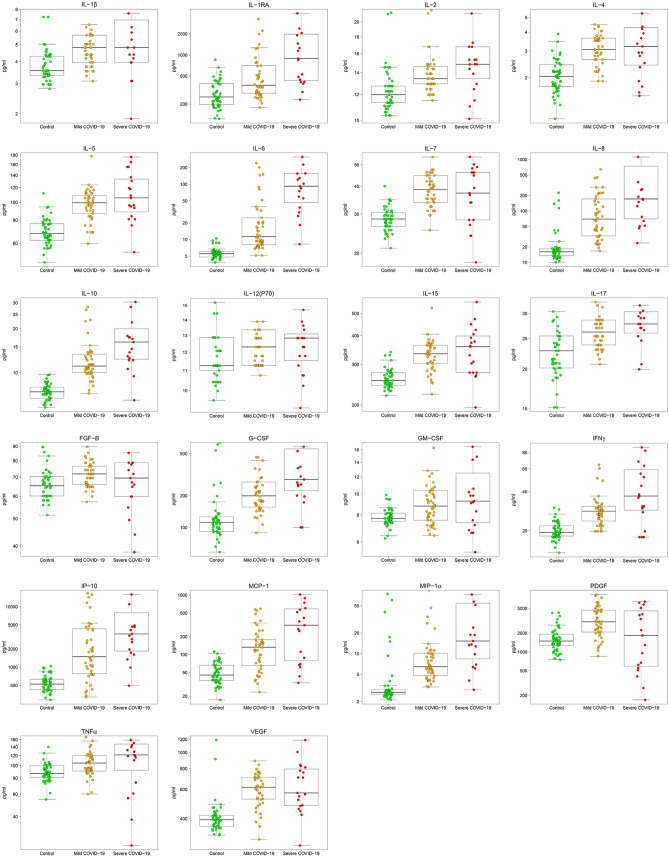
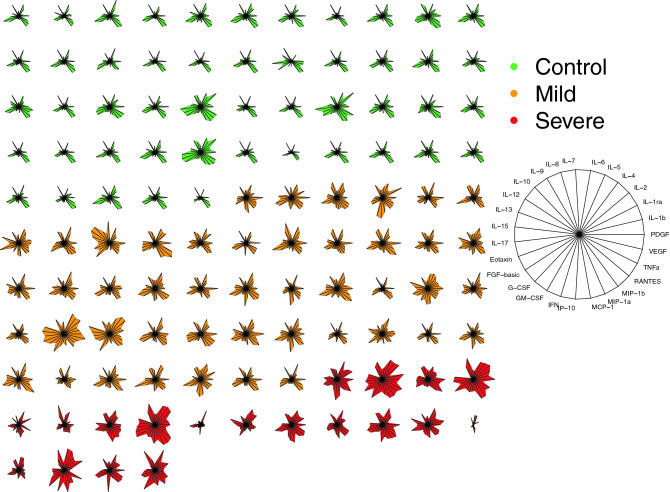
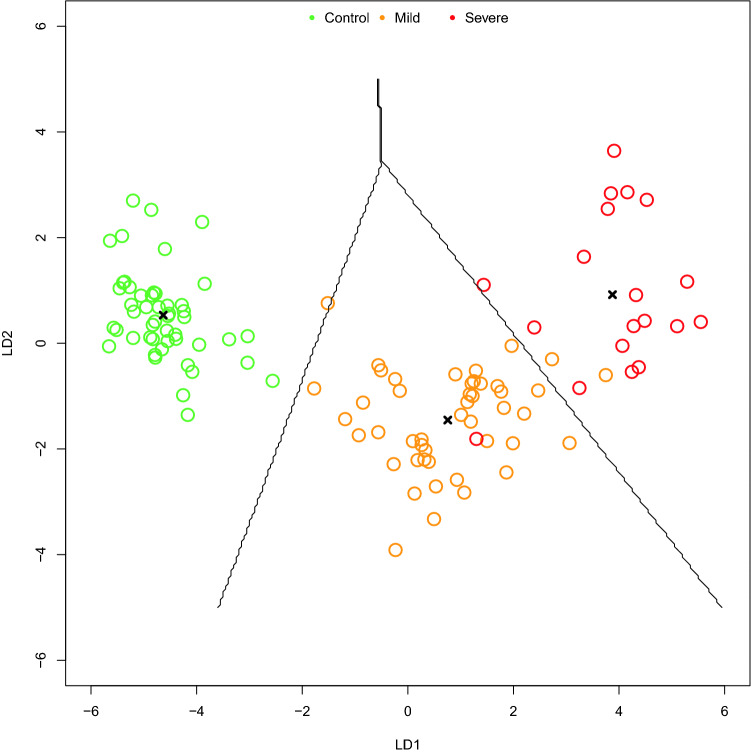
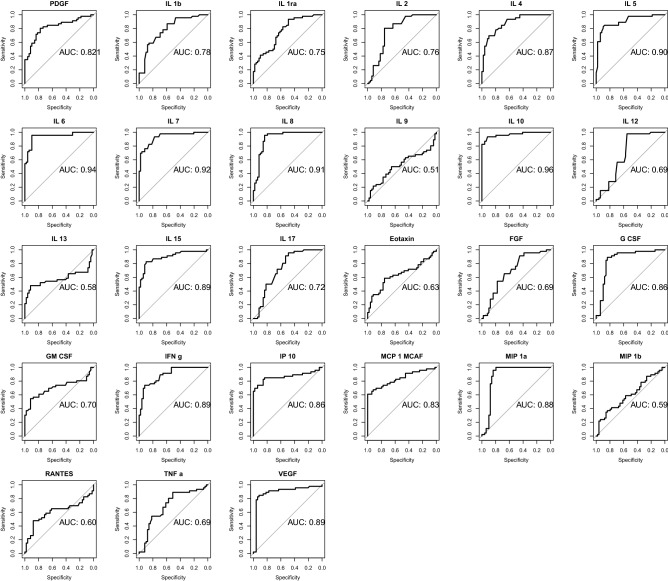
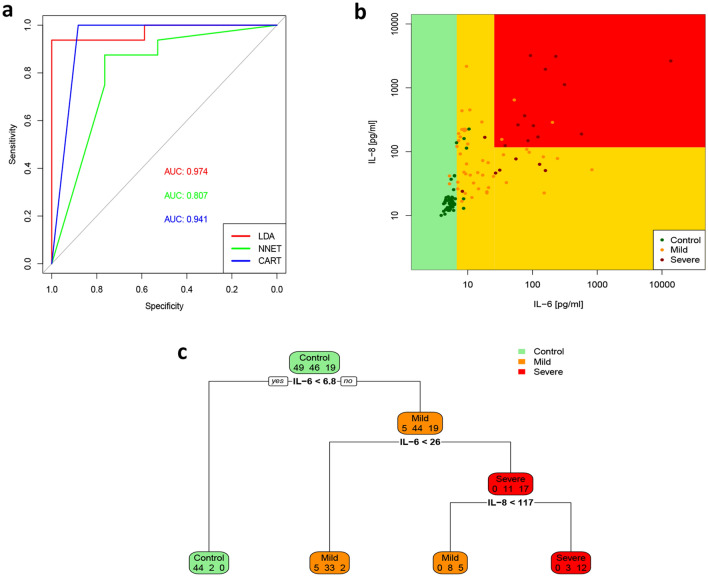
In Europe, multiple waves of infections with SARS-CoV-2 (COVID-19) have been observed. Here, we have investigated whether common patterns of cytokines could be detected in individuals with mild and severe forms of COVID-19 in two pandemic waves, and whether machine learning approach could be useful to identify the best predictors. An increasing trend of multiple cytokines was observed in patients with mild or severe/critical symptoms of COVID-19, compared with healthy volunteers. Linear Discriminant Analysis (LDA) clearly recognized the three groups based on cytokine patterns. Classification and Regression Tree (CART) further indicated that IL-6 discriminated controls and COVID-19 patients, whilst IL-8 defined disease severity. During the second wave of pandemics, a less intense cytokine storm was observed, as compared with the first. IL-6 was the most robust predictor of infection and discriminated moderate COVID-19 patients from healthy controls, regardless of epidemic peak curve. Thus, serum cytokine patterns provide biomarkers useful for COVID-19 diagnosis and prognosis. Further definition of individual cytokines may allow to envision novel therapeutic options and pave the way to set up innovative diagnostic tools.


Conflict of interest statement

The authors declare no competing interests.

Figures

Figure 1
Figure 1
COVID-19 patients display increased trend in circulating cytokines. Box plots denote median and 25th to 75th percentiles (boxes) and minimum to maximum (whiskers) and Jonckheere–Terpstra trend test was performed to analyse data. Figure reports only factors with statistically significant different trends. p values and the number of patients for each group are reported in Table 1.
Figure 2
Figure 2
Cytokine-based pattern of COVID-19 patients. Star plot obtained by multivariate data analysis of whole cytokinome of every subject consists of a sequence of equi-angular spokes (radii), with each spoke representing one cytokine as indicated in figure legend on the right. Data length of a spoke is proportional to the magnitude of the variable for the data point relative to the maximum magnitude of the variable across all data points. A line is drawn connecting the data values for each spoke.
Figure 3
Figure 3
27 cytokine-based algorithm allows to predict disease state and severity. 2D scatterplot of each subject’s cytokines. LDA projection is based on two-component LD1 and LD2 whose coefficients are reported in Supplementary Table 3.
Figure 4
Figure 4
Diagnostic relevance of COVID-19 related cytokines. The diagnostic performance of cytokines, chemokines and growth factors was estimated using ROC curve analysis and compared with the AUC in Controls versus Mild + Severe COVID-19 patients.
Figure 5
Figure 5
IL-6 and IL-8 performance in discriminating COVID-19 disease and severity. Comparison of classification accuracy of LDA, NNET and CART algorithms. AUC of ROC analysis indicates performance of the three classifier algorithms (A). Scatterplot from CART analysis identifies the groups labelled by their terminal nodes (B). The decision tree shows the rules and split points to estimate COVID-19 disease and severity. In each box, the first number estimates controls, the second number estimates mild COVID-19 patients, the third number severe COVID-19 patients. Decision binary tree reveals an optimal cut-off of IL-6 > 6.8 pg/ml for predicting COVID-19 disease and of IL-8 > 117 pg/ml for severity (C).

References

    1. Phelan AL, Katz R, Gostin LO. The novel coronavirus originating in Wuhan, China: Challenges for global health governance. JAMA. 2020;323:709–710. doi: 10.1001/jama.2020.1097. - DOI - PubMed
    1. Guan WJ, et al. Clinical characteristics of coronavirus disease 2019 in China. N. Engl. J. Med. 2020;382:1708–1720. doi: 10.1056/NEJMoa2002032. - DOI - PMC - PubMed
    1. Contou D, et al. Comparison between first and second wave among critically ill COVID-19 patients admitted to a French ICU: No prognostic improvement during the second wave? Crit. Care. 2021;25:3. doi: 10.1186/s13054-020-03449-6. - DOI - PMC - PubMed
    1. Jalali SF, et al. Epidemiologic comparison of the first and second waves of coronavirus disease in Babol, North of Iran. Casp. J. Internal Med. 2020;11:544–550. doi: 10.22088/cjim.11.0.544. - DOI - PMC - PubMed
    1. Palmieri L, et al. Differences in the clinical characteristics of COVID-19 patients who died in hospital during different phases of the pandemic: National data from Italy. Aging Clin. Exp. Res. 2020 doi: 10.1007/s40520-020-01764-0. - DOI - PMC - PubMed

Publication types