. 2021 Nov;27(11):1970-1981.
doi: 10.1038/s41591-021-01520-5. Epub 2021 Oct 21.

IL-1-driven stromal-neutrophil interactions define a subset of patients with inflammatory bowel disease that does not respond to therapies

Collaborators, Affiliations

IL-1-driven stromal-neutrophil interactions define a subset of patients with inflammatory bowel disease that does not respond to therapies

Matthias Friedrich et al. Nat Med. 2021 Nov.

Abstract

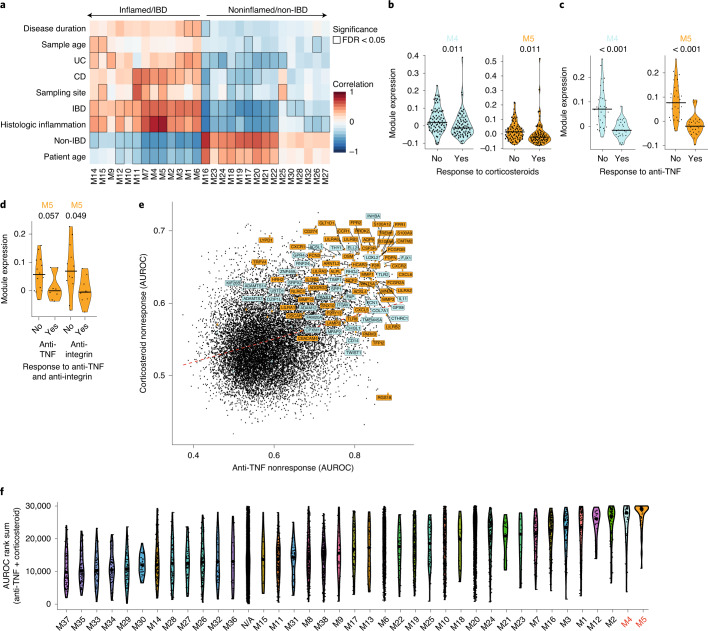
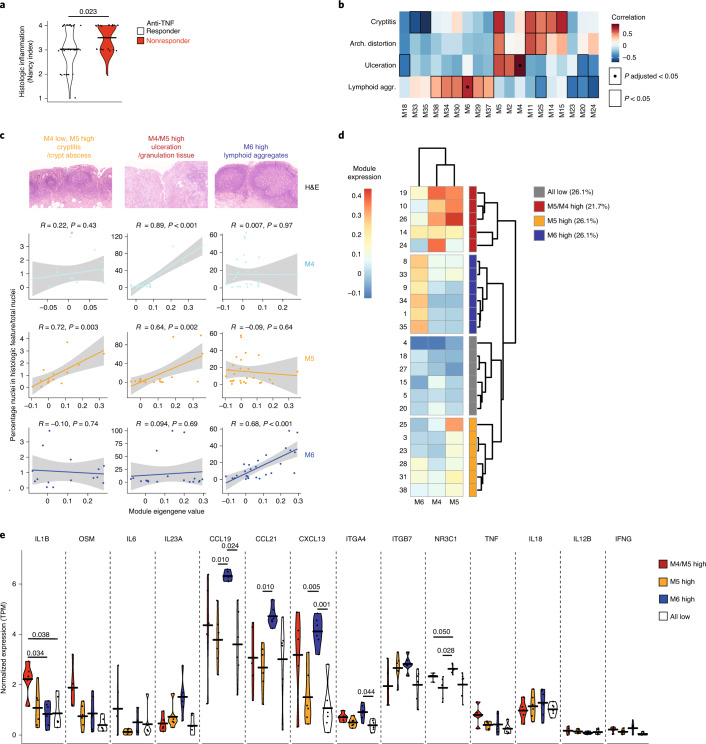
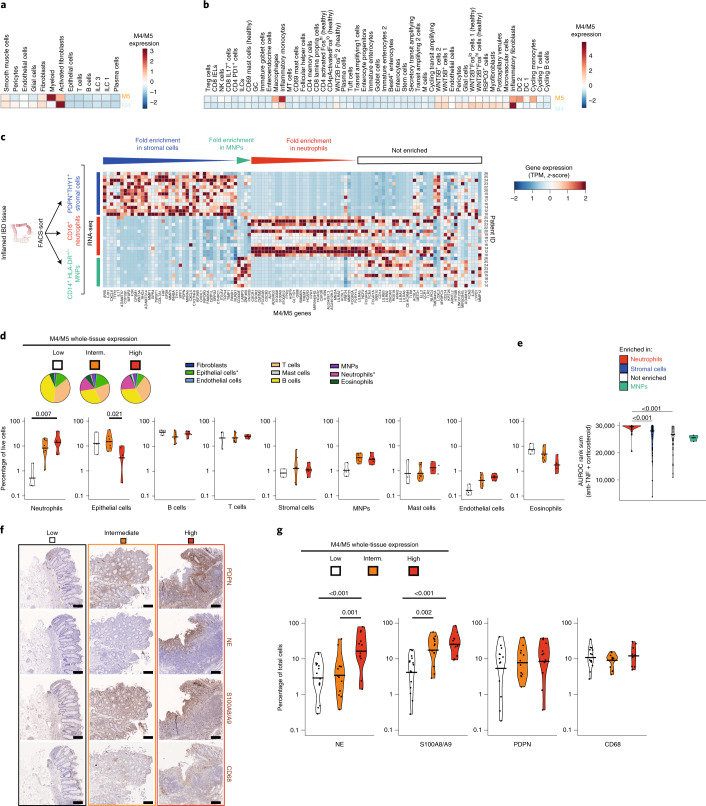
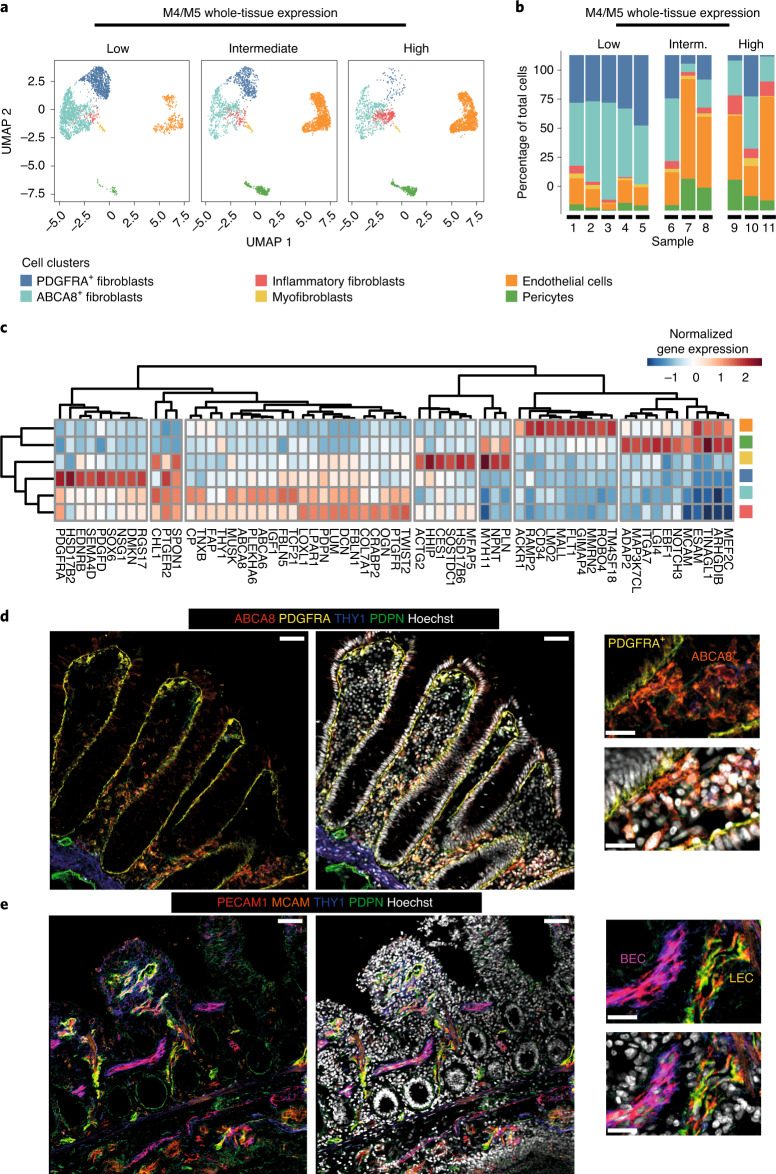
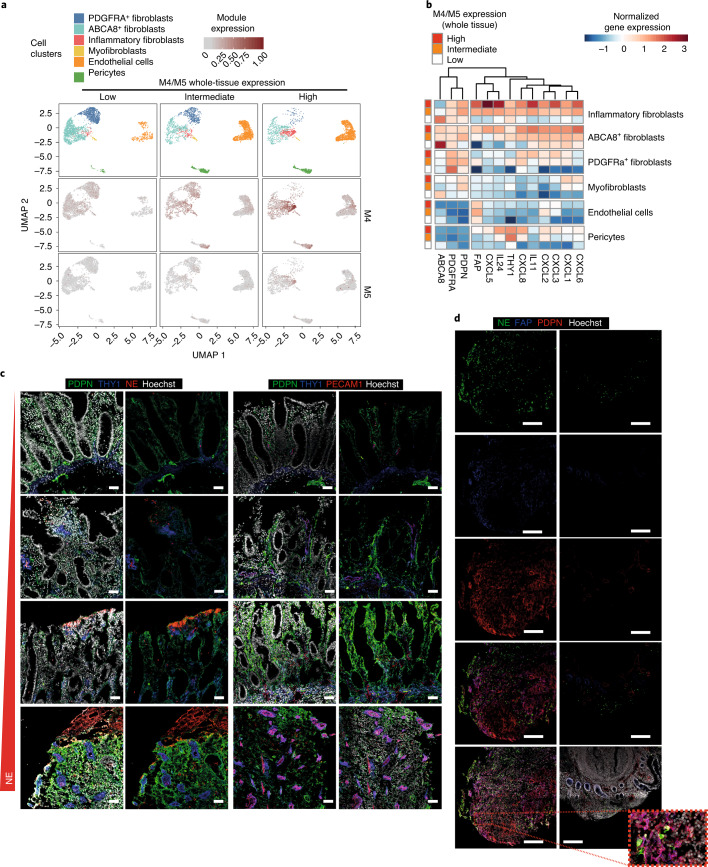
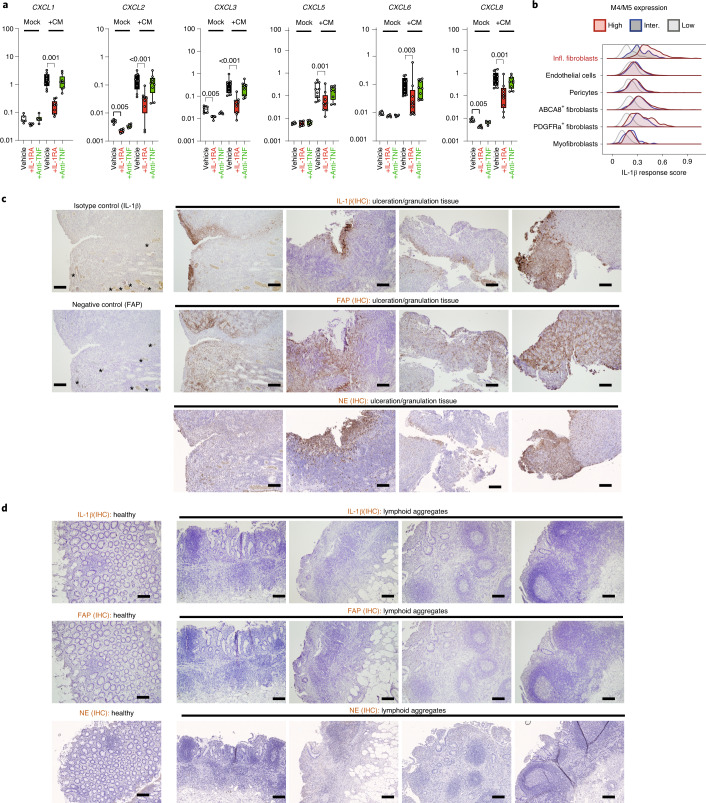
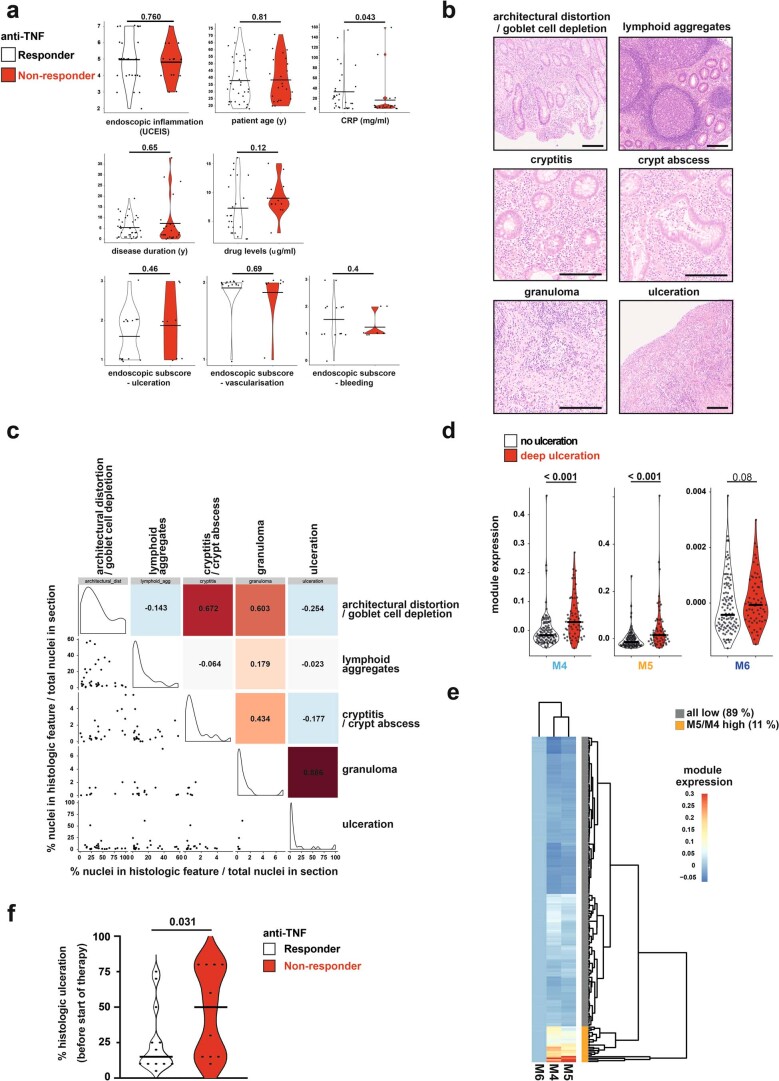
Current inflammatory bowel disease (IBD) therapies are ineffective in a high proportion of patients. Combining bulk and single-cell transcriptomics, quantitative histopathology and in situ localization across three cohorts of patients with IBD (total n = 376), we identify coexpressed gene modules within the heterogeneous tissular inflammatory response in IBD that map to distinct histopathological and cellular features (pathotypes). One of these pathotypes is defined by high neutrophil infiltration, activation of fibroblasts and vascular remodeling at sites of deep ulceration. Activated fibroblasts in the ulcer bed display neutrophil-chemoattractant properties that are IL-1R, but not TNF, dependent. Pathotype-associated neutrophil and fibroblast signatures are increased in nonresponders to several therapies across four independent cohorts (total n = 343). The identification of distinct, localized, tissular pathotypes will aid precision targeting of current therapeutics and provides a biological rationale for IL-1 signaling blockade in ulcerating disease.


Conflict of interest statement

F.M.P. received research support from Roche and Janssen, and consulting fees from GSK, Novartis and Genentech. H.H.U. received research support or consultancy fees from Janssen, Eli Lilly, UCB Pharma, BMS/Celgene, MiroBio, Mestag and OMass. S.P.T. received research support from AbbVie, Buhlmann, Celgene, IOIBD, Janssen, Lilly, Pfizer, Takeda, UCB, Vifor and the Norman Collisson Foundation; consulting fees from AbbVie, Allergan, Αbiomics, Amgen, Arena, Asahi, Astellas, Biocare, Biogen, Boehringer Ingelheim, Bristol-Myers Squibb, Buhlmann, Celgene, Chemocentryx, Cosmo, Enterome, Ferring, Giuliani SpA, GSK, Genentech, Immunocore, Immunometabolism, Indigo, Janssen, Lexicon, Lilly, Merck, MSD, Neovacs, Novartis, NovoNordisk, NPS Pharmaceuticals, Pfizer, Proximagen, Receptos, Roche, Sensyne, Shire, Sigmoid Pharma, SynDermix, Takeda, Theravance, Tillotts, Topivert, UCB, VHsquared, Vifor and Zeria; and speaker fees from AbbVie, Amgen, Biogen, Ferring, Janssen, Pfizer, Shire, Takeda and UCB (no stocks or share options). M.A.J. is an employee of MiroBio Ltd. K.G.L. and A.P.F. are employees of Roche Ltd. All other authors declare no competing interests.

Figures

Fig. 1
Fig. 1. Identification of gene coexpression signatures of inflammation associated with patient nonresponse to multiple different IBD therapies.
a, Pearson correlation between module eigengenes and clinical and histologic metadata in IBD (n = 41) and non-IBD (n = 39, normal adjacent to CRC) tissues within the discovery cohort; all modules/features with at least one significant association are shown; bordered squares indicate significant correlations (false-discovery rate (FDR) P < 0.05, asymptotic two-tailed P values estimated from Pearson coefficients). Exact P values are given in Supplementary Table 1. bd, Expression of modules M4 and M5 (eigengene value) in nonresponders and responders before the start of administration of either corticosteroid (b, n = 206 patients), anti-TNF (c,d,, n = 61 patients) or monthly anti-integrin therapy (d, n = 20 patients) (two-tailed Mann–Whitney U-test, FDR adjusted P values; these were post hoc to ANOVA comparisons across the various treatment regimens in ref. (d). Exact FDR adjusted P values (c): M4, 2.7 × 10−6; M5, 4.7 × 10−7. e, Performance (area under the receiver operator curve (AUROC)) of individual genes for prediction of nonresponse to corticosteroid (y axis) and anti-TNF (x axis) therapy; genes in M4 and M5 are labeled and highlighted turquoise and orange, respectively. f, Violin plots showing gene rank based on their predictive power (AUROC) for response to both anti-TNF and corticosteroid therapy, comparing all modules as detected in the WGCNA analysis. Combined ranks represent the sum of each gene’s ranks in the separate corticosteroid and anti-TNF analyses (their ranks on the x and y axes in e).
Fig. 2
Fig. 2. Coexpression modules linked with therapy nonresponse represent distinct histopathologic features.
a, Nancy histologic scores in responders (n = 35 UC) and nonresponders (n = 21 UC) to anti-TNF therapy within 3 months before the start of treatment (horizontal bars indicate geometric mean, two-tailed Mann–Whitney U-test P value is given). b, Heatmap of correlations between module eigengene expression and histological features quantified across tissues from IBD patients in the discovery cohort (where histological features could be quantified). Nominally significant associations (P < 0.05) are indicated by borders, and FDR significant (FDR P < 0.05) associations are indicated by dots; P values represent two-tailed probabilities of Pearson correlation coefficients. Exact P values can be obtained when rerunning the analysis on https://github.com/microbialman/IBDTherapyResponsePaper. c, Scatter plots showing eigengene expression of M4, M5 and M6 versus selected quantified histologic features in tissue samples from patients in the discovery cohort with IBD (linear model fit, error bands show 95% CI; P values represent two-tailed probabilities of Pearson correlation coefficients). d, Classification of M4/M5-high-tissue (n = 5), M5 only-high-tissue (n = 6), M6-high-tissue (n = 6) and M4/M5/M6 (n = 6)-low-tissue patients in the discovery cohort, based on hierarchical clustering of module eigengene values from inflamed tissue samples. e, Normalized expression (TPM) of cytokine and therapeutic target genes that were reliably (in >50% of samples) detected in the discovery cohort. The expression of these genes is compared in the M4/M5-high tissue (red), M5 only-high tissue (orange), M6-high tissue (blue) and M4/M5/M6-low tissue (gray). Horizontal lines indicate the median, and P values (two-tailed Wilcoxon rank-sum test, adjusted for multiple testing) for each comparison are given if significant (P < 0.05). Arch., architectural; aggr., aggregates.
Fig. 3
Fig. 3. High expression of modules M4 and M5 reflects neutrophil infiltrates, activated fibroblasts and epithelial cell loss.
a,b, Expression of modules M4 and M5 in cell clusters detected by scRNA-seq in tissues of patients with CD (a) and UC (b). c, Heatmap of the levels of expression (TPM values, z-score, Manhattan distance clustering) of all genes contained within M4 and M5 in THY1+PDPN+ stromal cells, CD16hi neutrophils and CD14+HLA-DR± MNPs, FACS-sorted from n = 13, n = 12 and n = 9 inflamed IBD patient tissues, respectively. Genes are ordered by log fold change of significant enrichment (P adjusted < 0.05, two-tailed Wald test; Supplementary Table 5) in a cell type. d, FACS cell type percentages in tissue isolates from patients with IBD, classified into low (white, n = 3), intermediate (interm.) (orange, n = 7) and high (red, n = 4) expression of M4/M5 (Extended Data Fig. 3e). Pie-charts (* denotes significantly different between groups, post hoc two-way ANOVA adjusted P values) show medians across samples, and violin plots individual samples. e, Violin plots showing the combined rank of genes based on their predictive power (AUROC) for response to both anti-TNF and corticosteroid therapy, comparing genes significantly enriched in neutrophils, stromal cells, MNPs or neither (Supplementary Table 5). Horizontal lines indicate the median; adjusted P values are given (two-tailed Wilcoxon test; exact P values are 2.7 × 10−5 and 2.1 × 10−4 for neutrophil versus nonspecific and neutrophil versus stroma, respectively). f, Illustrative (of samples quantified in g) IHC staining (DAB, counterstain hematoxylin) of PDPN, NE, S100A8/A9 and CD68 in serial sections of tissues from patients with IBD classified as low, intermediate or high for M4/M5 whole-tissue gene expression (Extended Data Fig. 3f). Scale bars, 200 µm. g, Automated quantification (percentage of positively stained cells of total cells detected in inflamed areas) of IHC stainings shown in f. Each staining was quantified on inflamed tissue sections with low (n = 15), intermediate (n = 13) and high (n = 12) M4/M5 whole-tissue gene expression (Extended Data Fig. 3f). Post hoc two-way, two-tailed ANOVA adjusted P values are given, where significant.
Fig. 4
Fig. 4. Stromal architecture of the large and small intestine in health and disease.
a, UMAP of stromal clusters identified by Harmony in stromal compartments, FACS-sorted from healthy donors and tissue from patients with IBD and low (n = 5), intermediate (n = 3) and high (n = 3) M4/M5 whole-tissue gene expression (Extended Data Fig. 4a). b, Percentage of total stromal cells among cell type clusters in M4/M5-low, -intermediate and -high tissue. c, Heatmap of selected markers of each cellular cluster shown in a, as identified by Harmony. Expression values are normalized log2 fold changes (Wald statistic βgσg) from DESeq2 analyses (where ßg is log2 fold change for gene g, and σg is estimated standard error of log2 fold change for gene g). d, Immunofluorescent staining of THY1 (blue), PDPN (green), ABCA8 (red) and PDGFRA (yellow) to visualize the localization of fibroblast subsets in resected tissue from patients with IBD (noninflamed areas). Images are representative of stainings in n = 8 tissues from n = 4 patients. Scale bars, 50 µm (20 µm in zoomed images). e, Immunofluorescent staining of THY1 (blue), PDPN (green), PECAM1 (red) and MCAM (orange) to visualize the localization of vascular (endothelial) and perivascular cells (noninflamed areas). Images are representative of staining in n = 8 tissues from n = 4 patients. Scale bars, 50 µm (20 µm in zoomed images). BEC, blood endothelial cells; LEC, lymphatic endothelial cells.
Fig. 5
Fig. 5. M4/M5 gene expression is associated with neutrophil-attracting fibroblasts and endothelial and perivascular cell expansion.
a, UMAP of stromal single-cell profiles showing the different stromal clusters as in Fig. 4a for comparison (top), and the expression level of M4 (middle) and M5 (bottom) genes in these clusters. b, Heatmap showing normalized gene expression of the top differentially expressed genes between M4/M5 expression levels within each cell cluster. Expression values are normalized log2 fold changes (Wald statistic βgσg) from DESeq2 analyses. c, Staining of NE or PECAM1 (red), THY1 (blue) and PDPN (green) in n = 4 tissues from patients with IBD and with varying grades of neutrophil infiltration. Images are representative of stainings in n = 8 tissues from n = 4 patients. Scale bars, 50 µm. d, Staining of NE (green), FAP (blue) and PDPN (red) in paired inflamed (deep ulcer) and noninflamed tissues. Images are representative of staining in n = 8 tissues from n = 4 patients. Scale bars, 200 µm (20 µm in zoomed image insert).
Fig. 6
Fig. 6. Activated inflammatory fibroblasts drive neutrophil recruitment through IL-1R signaling with high levels of IL-1β at sites of ulceration.
a, Ccd18-Co fibroblasts were stimulated for 3 h with either mock control or conditioned media produced from n = 9 tissue digests from patients with IBD (CM), without pretreatment (vehicle, PBS) or preincubated with IL-1Ra (anakinra) or anti-TNF (adalimumab). Adjusted P values are shown where significant (P < 0.05); two-tailed Friedman test for paired samples. b, Projection of the IL-1 cytokine stimulation response of Ccd18-Co fibroblasts onto stromal cell clusters detected by scRNA-seq (Fig. 4a). Scores were computed as mean z-score of IL-1 upregulated genes. c, IHC staining of IL-1β, FAP or NE (DAB, counterstain hematoxylin) in n = 8 different inflamed (infl.) tissue sections of patients with IBD and with prominent ulceration and/or granulation tissue, and in n = 1 healthy tissue. Scale bars, 200 µm. * Indicates nonspecific staining of erythrocytes or platelets in vessels. d, Staining as in c, but of inflamed tissue sections from patients with IBD and with dominant lymphoid aggregates. Scale bars, 200 µm.
Extended Data Fig. 1
Extended Data Fig. 1. Clinical characteristics of the Oxford IBD patient discovery cohort used in this study.
Samples from the discovery cohort consist of surgically removed tissue of UC, CD or IBDu patients (=IBD), as well as surgically removed normal tissue adjacent to colorectal tumors (= non-IBD). IBD, inflammatory bowel disease; CD, Crohn’s Disease; UC, Ulcerative colitis; IQR, interquartile range; n/a, not applicable. * Sampling site percentages are based on the total number of tissues collected (not patient number).
Extended Data Fig. 2
Extended Data Fig. 2. Module associations with inflammation and response to therapy.
a) Scatterplot of the module expression difference between inflamed and uninflamed tissues paired from the same patients versus the correlation of the module with the Nancy score across all IBD and non-IBD tissues. Points highlighted with a diamond indicate a significant difference in two-tailed paired t-tests between inflamed/uninflamed tissue (FDR p < 0.1). b) Heatmap of module eigengene – cell type correlations; cell types were deconvoluted from whole tissue expression data using xCell. Modules highlighted in bold were fund to be associated with histologic inflammation. c) Percentage of genes within each of the n = 38 modules that were detectable in the publicly available datasets,,. Red horizontals in violins indicate the median. d) M4/M5 module expression (eigengene) in patients with CD (n = 37) and UC (n = 24) before anti-TNF therapy start (GSE16879, horizontal bars indicate geometric mean, two-tailed Mann Whitney U test P values are given; exact P-values are 0.0026 and 7.8×10⁻⁶ for M4 and M5 CD comparisons, respectively). e) M4/M5 module expression (eigengene) in n = 87 patients with CD after anti-TNF therapy failure (GSE100833, horizontal bars indicate geometric mean, P values of comparisons across all sites are given, Kruskall-Wallis test).
Extended Data Fig. 3
Extended Data Fig. 3. Clinical characteristics of the Oxford UC patient cohort of response to anti-TNF therapy.
Response to therapy in this UC patient cohort was defined as stopping anti-TNF therapy (Infliximab or Adalimumab) within 12 months of start, for reason of non response (patients that stopped therapy for convenience, switch to biosimilar, intolerance, or anti-drug antibodies were not considered). Nancy histologic scores and UCEIS endoscopic scores, as well as the other characteristics, within 3 months before the start of anti-TNF therapy are shown. UC, Ulcerative colitis; IQR, interquartile range; UCEIS, Ulcerative Colitis Endoscopic Index of Severity.
Extended Data Fig. 4
Extended Data Fig. 4. Correlations of histopathologic measures and patient response to therapy.
a) Clinical and endoscopic measures in responders (n = 35) and non-responders (n = 21) to anti-TNF therapy before the start of treatment (see Extended Data Fig. 3 for cohort details; horizontal bars indicate geometric mean, two-tailed Mann Whitney U test P values are given; some measures were not reported for all patients, resulting in less datapoints). b) Exemplary images of the various pathological features quantified on H&E histology in resected tissue from IBD patients. Scale bar 200 µm. c) Correlation plot of histological features, quantified as the % of nuclei within the feature area relative to the nuclei with the total section area. Numbers and colours in upper right corner indicate the Pearson correlation coefficient; histograms on diagonal show the value distribution of the features within IBD patient tissues; scatter plots in the lower left corner show the individual datapoints. d) Violin plots of eigengene expression of M4, M5 and M6 in inflamed tissues of IBD patients with (n = 61) or without (n = 111) deep ulceration observed in a replication cohort of paediatric CD and UC; horizontal lines indicate median and adjusted two-tailed Wilcoxon signed rank test P-values are given; exact P-values are 1.4×10⁻⁴ and 1.1×10⁻⁶ for M4 and M5 comparisons, respectively. e) Classification of M4/M5 high and M4/M5 low patients in the paediatric replication cohort (n = 172), based on hierarchical clustering on module eigengene values. f) Percent ulceration on biopsies collected within 3 months before anti-TNF therapy start (subcohort of Extended Data Fig. 3), as semi-quantitatively (0-25-50-75-100) scored by a blinded consultant histopathologist (n = 12 responders, n = 10 non responders). Two-tailed Mann-Whitney U test P-values are given. Therapy response was defined as described in Extended Data Fig. 3.
Extended Data Fig. 5
Extended Data Fig. 5. FACS sorting and transcriptomic analysis of cellular subsets.
a) Representative gating strategy of FACS sorting hematopoietic and non-hematopoietic cell populations from non-IBD and IBD patient tissue. b) Normalised gene expression (qPCR, relative to RPLP0 expression) of selected genes from M4 and M5 in cell populations sorted as in a) from n = 3 intestinal tissues of n = 3 patient with IBD; box and whisker plots display median, upper and lower quartiles, and range. c) FACS-gating strategy for sorting of neutrophils, stromal cells and MNPs from tissue samples of IBD patients. d) Gene set enrichment analysis using Gene Ontology (GO) Cellular Components pathway terms, based on all genes significantly enriched (p adjusted <0.05, |log2 fold change | > 2; two-tailed randomisation test) in either neutrophils MNPs or stromal cells (Supplementary Table 5); Exact P-values can be obtained when re-running the analysis on https://github.com/microbialman/IBDTherapyResponsePaper.e + f) Heatmaps of whole tissue gene expression of selected genes that are representative (=highly correlative) of M4 and M5 expression (qPCR, z-score transformed gene expression values); unsupervised clustering (Manhattan) distinguishes subgrouping into M4/M5 low, intermediate and high samples; the box-plots on the right show the eigenvalues of all detected genes on a per patient basis; box and whisker plots display median, upper and lower quartiles, and range. The respective heatmaps refer to tissue samples used for FACS analysis (n = 14, e) and IHC analysis (n = 47, f) as shown in Fig. 3d, f and g.
Extended Data Fig. 6
Extended Data Fig. 6. Clinical characteristics of the IBD patients used for RNAseq and FACS analysis.
Clinical characteristics of the IBD patient cohorts used for the transcriptomic and FACS analysis. UC, Ulcerative colitis; IQR, interquartile range; UCEIS, Ulcerative Colitis Endoscopic Index of Severity.
Extended Data Fig. 7
Extended Data Fig. 7. Single-cell transcriptomic and immunofluorescent profiling of patient samples.
a) Heatmap of whole tissue gene expression of selected genes that are representative of (highly correlated with) M4 and M5 expression (qPCR, z-score transformed gene expression values); unsupervised clustering (Manhattan) groups samples into M4/M5 low (n = 5 patients), intermediate (n = 3 patients) and high (n = 3 patients) from the set of IBD patients whose samples were profiled by single cell RNA sequencing; the box-plots (lower panel) show the eigenvalues of all detected genes on a per patient basis; data are presented as median values + /- range. b) Immunofluorescent staining of ABCA8 (red), PDGFRA (yellow), THY1 (blue), Podoplanin (PDPN, green) and nuclei (Hoechst, grey) in ileum and colon of resected tissue from IBD patients (not inflamed) (Images representative of stainings in n = 8 tissues of n = 4 patients). c) Immunostaining of PECAM1 (red), MCAM (orange) THY1 (blue), Podoplanin (PDPN, green) and nuclei (Hoechst, grey) in ileum and colonic resected tissue from IBD patients (not inflamed) (Images representative of stainings in n = 8 tissues of n = 4 patients). d) Box plot showing the proportion of the cell types in M4/M5 low (n = 5 patients), intermediate (n = 3 patients) and high groups (n = 3 patients), as detected by scRNAseq; box and whisker plots display median, upper and lower quartiles, and range. e) FACS analysis of live stromal cells (CD45-, EPCAM-) in resected tissue from an IBD patient (adjacent not inflamed and inflamed tissue). Gates for endothelial cells (PECAM1+), pericytes (THY + , PDPN-), ABCA8 + fibroblasts (THY1 high, PDGFRa low), PDGFRA + fibroblasts (PDGFRA high, THY1 low) and inflammatory fibroblasts (FAP+) are shown. f) Pseudotime analysis of ABCA8 + , PDGFRA + and inflammatory fibroblasts in the single-cell dataset. Cell densities (top row) or canonical markers (bottom) are shown along the trajectory, binned to 100 uniform-density windows (each window has the same number of cells). g) Representative immunofluorescent stainings of PDGFRA (yellow) and ABCA8 (red) staining on fibroblasts in paired inflamed and uninflamed samples of the same IBD patient (Images representative of stainings in n = 8 tissues of n = 4 patients).
Extended Data Fig. 8
Extended Data Fig. 8. Cytokine response of intestinal fibroblasts.
a) Primary fibroblast cell lines (n = 33) culture-expanded from resected IBD patient tissue and stimulated for 3 h with recombinant cytokines (adjusted P-values are shown where significantly different (p < 0.05) compared to unstimulated, Kruskall-Wallis test). b) RNAseq analysis (Salmon log2-transformed TPM values, z-score) of cultured intestinal fibroblast cell line Ccd18-co, stimulated with either TNF-α (100 ng/ml) or IL-1β (0.01 ng.ml) for 3 hours (n = 6 replicates per group, * P adjusted < 0.05 from DESeq2 differential gene expression analysis). c) Dose response of IL-1β and TNF-α stimulated Ccd18co fibroblasts for gene expression fold change (FC) of CXCL8 over unstimulated, measured by qPCR; data are presented as mean values (n = 2) + /- SD. d) Pseudo-bulk expression fold changes (relative to M4/M5 low groups) of ILR1 and TNFR1 (see Supplementary Table 7) within the cellular clusters detected as in Fig. 3a, across patients with either low, intermediate or high M4/M5 whole tissue expression. e) Gene set enrichment analysis of all modules detected in the discovery cohort for genes assigned to inflammasome pathways (GO:0061702).

Comment in

References

    1. Uhlig HH, Powrie F. Translating immunology into therapeutic concepts for inflammatory bowel disease. Annu. Rev. Immunol. 2018;36:755–781. - PubMed
    1. Ungaro R, Mehandru S, Allen PB, Peyrin-Biroulet L, Colombel JF. Ulcerative colitis. Lancet. 2017;389:1756–1770. - PMC - PubMed
    1. Torres J, Mehandru S, Colombel JF, Peyrin-Biroulet L. Crohn’s disease. Lancet. 2017;389:1741–1755. - PubMed
    1. Friedrich M, Pohin M, Powrie F. Cytokine networks in the pathophysiology of inflammatory bowel disease. Immunity. 2019;50:992–1006. - PubMed
    1. West NR, et al. Oncostatin M drives intestinal inflammation and predicts response to tumor necrosis factor-neutralizing therapy in patients with inflammatory bowel disease. Nat. Med. 2017;23:579–589. - PMC - PubMed

Publication types