Observational Study
. 2021 Nov;6(11):1367-1382.
doi: 10.1038/s41564-021-00970-4. Epub 2021 Oct 21.

Bifidobacterium species associated with breastfeeding produce aromatic lactic acids in the infant gut

Affiliations
Observational Study

Bifidobacterium species associated with breastfeeding produce aromatic lactic acids in the infant gut

Martin F Laursen et al. Nat Microbiol. 2021 Nov.

Abstract

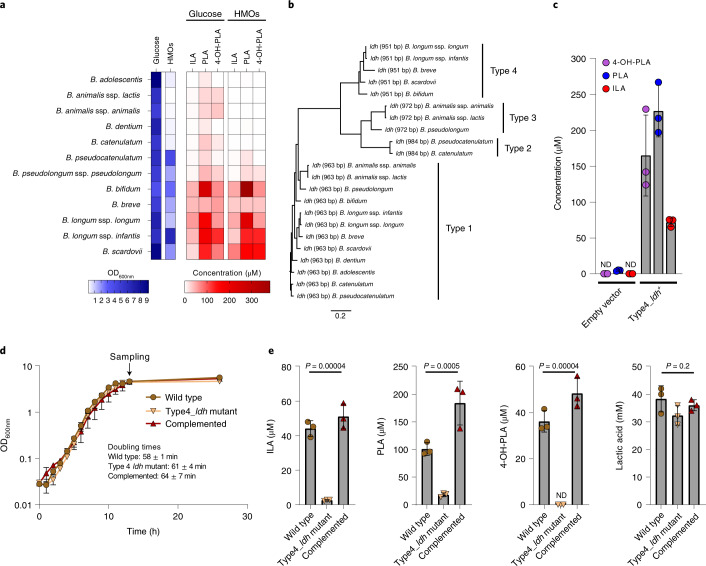
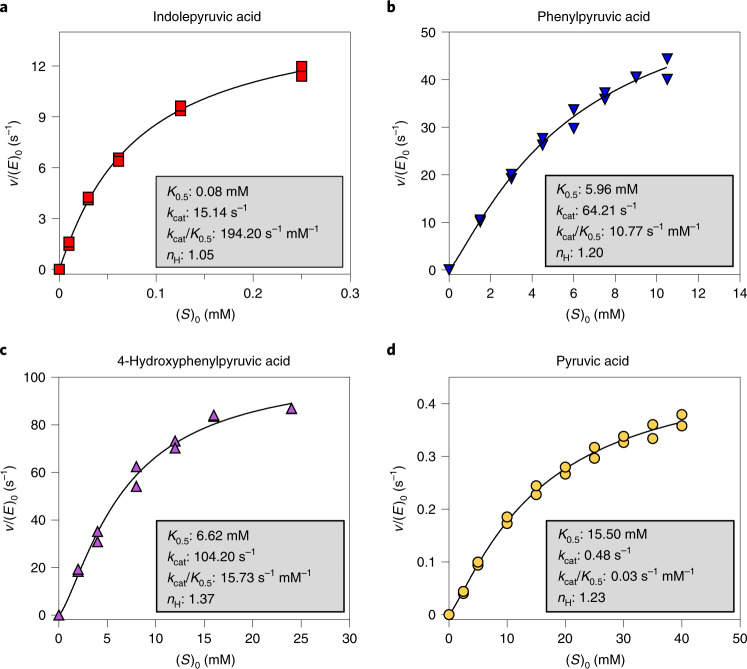
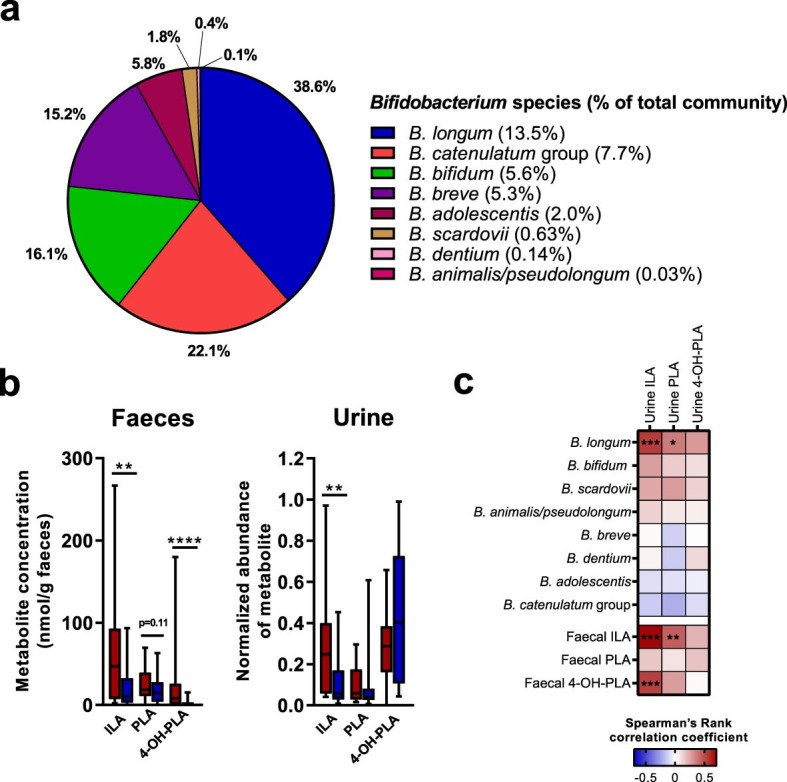
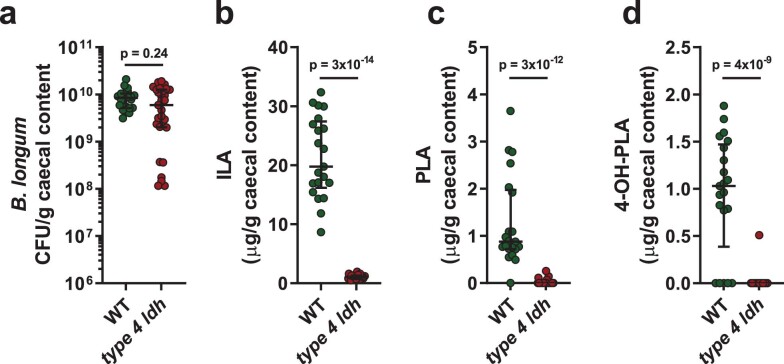
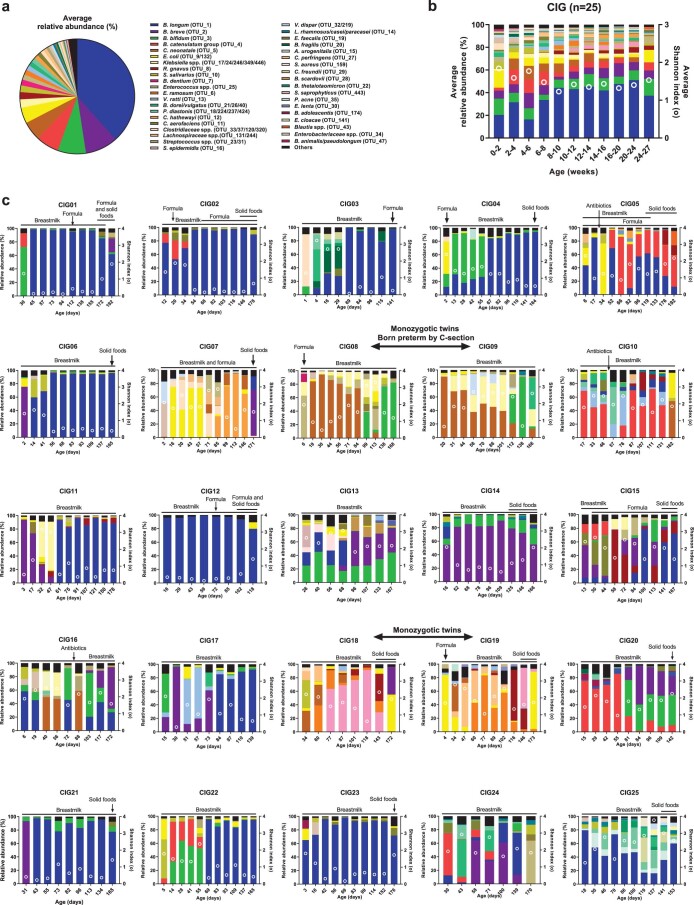
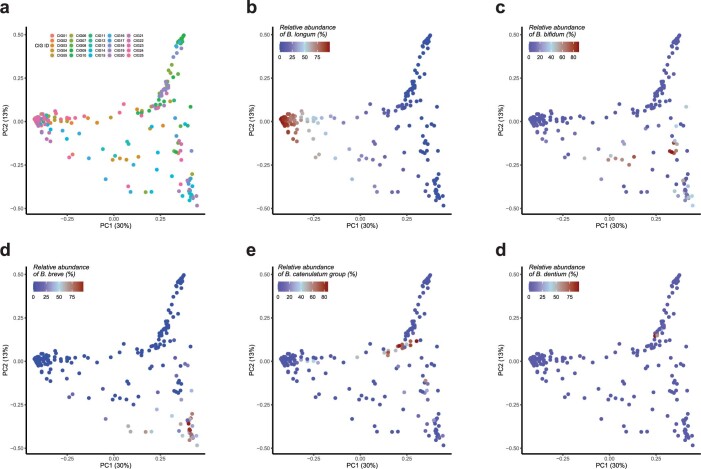
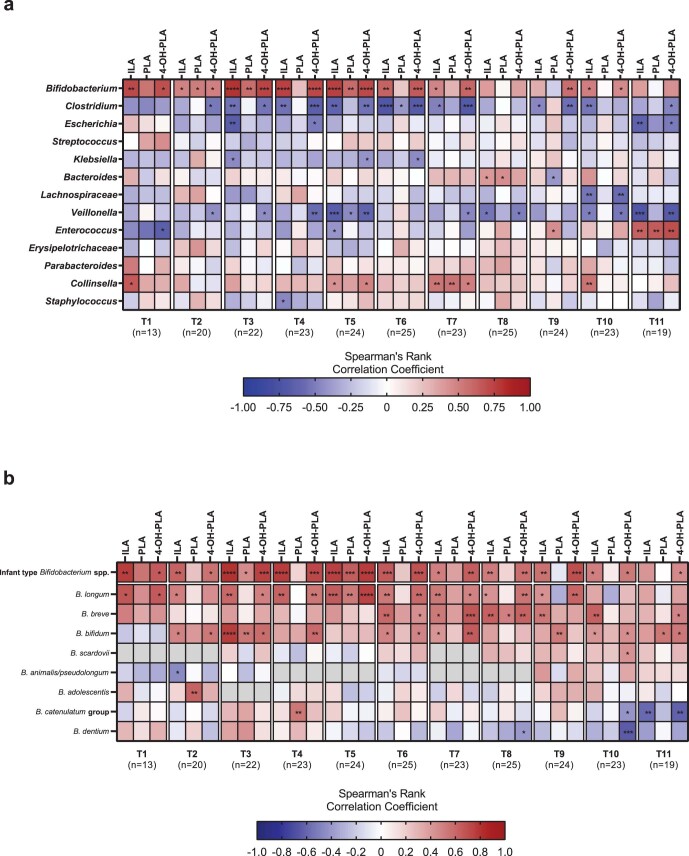
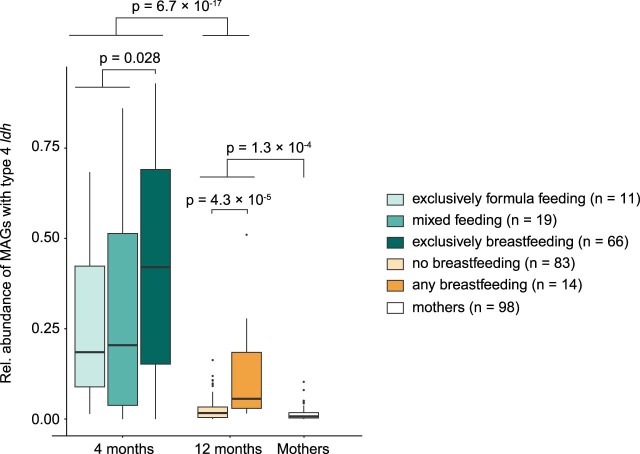
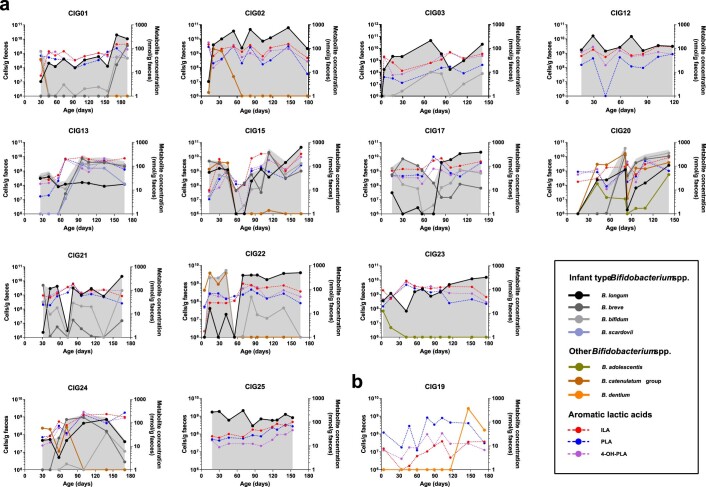
Breastfeeding profoundly shapes the infant gut microbiota, which is critical for early life immune development, and the gut microbiota can impact host physiology in various ways, such as through the production of metabolites. However, few breastmilk-dependent microbial metabolites mediating host-microbiota interactions are currently known. Here, we demonstrate that breastmilk-promoted Bifidobacterium species convert aromatic amino acids (tryptophan, phenylalanine and tyrosine) into their respective aromatic lactic acids (indolelactic acid, phenyllactic acid and 4-hydroxyphenyllactic acid) via a previously unrecognized aromatic lactate dehydrogenase (ALDH). The ability of Bifidobacterium species to convert aromatic amino acids to their lactic acid derivatives was confirmed using monocolonized mice. Longitudinal profiling of the faecal microbiota composition and metabolome of Danish infants (n = 25), from birth until 6 months of age, showed that faecal concentrations of aromatic lactic acids are correlated positively with the abundance of human milk oligosaccharide-degrading Bifidobacterium species containing the ALDH, including Bifidobacterium longum, B. breve and B. bifidum. We further demonstrate that faecal concentrations of Bifidobacterium-derived indolelactic acid are associated with the capacity of these samples to activate in vitro the aryl hydrocarbon receptor (AhR), a receptor important for controlling intestinal homoeostasis and immune responses. Finally, we show that indolelactic acid modulates ex vivo immune responses of human CD4+ T cells and monocytes in a dose-dependent manner by acting as an agonist of both the AhR and hydroxycarboxylic acid receptor 3 (HCA3). Our findings reveal that breastmilk-promoted Bifidobacterium species produce aromatic lactic acids in the gut of infants and suggest that these microbial metabolites may impact immune function in early life.


Conflict of interest statement

The authors declare no competing interests.

Figures

Fig. 1
Fig. 1. Breastfeeding associates with faecal microbiota composition and aromatic amino acid metabolites in 9-month-old infants.
a,b, PCoA plots of weighted UniFrac distances based on OTUs from faecal samples of 9-month-old infants participating in the SKOT cohort (n = 59). a, Samples are coloured according to breastfeeding status, with ellipses indicating 80% confidence interval (CI) of datapoints for partially breastfed (red, n = 24) and weaned (blue, n = 35) infants. b, Samples are coloured according to relative abundance of the genus Bifidobacterium. c, PCA plot of concentrations (nmol g–1 faeces) of aromatic amino acids and their derivatives in SKOT faecal samples, coloured according to breastfeeding status, with ellipses indicating 80% CI of datapoints for breastfed (red, n = 24) and weaned (blue, n = 35) infants. Loadings (correlations between variables and the principal components) are shown with arrows, with annotations of the aromatic amino acids ILA, 4-OH-PLA and PLA shown. d, Heatmap illustrating Spearman’s rank correlation coefficients (two-sided tests) between the relative abundance of Bifidobacterium and concentrations of aromatic amino acids and their derivatives in SKOT faecal samples (n = 59). e, Heatmap illustrating hierarchical clustering (dendrogram on the right side) of Spearman’s rank correlation coefficients (two-sided tests) between the relative abundance of the different Bifidobacterium species and selected microbial-derived aromatic amino acid catabolites in SKOT faecal samples (n = 59). Box and whiskers plots are showing relative abundance (line, median; box, interquartile range (IQR); whiskers, minimum to maximum) of the Bifidobacterium species, stratified according to breastfeeding status, with statistical significance evaluated by two-sided Mann–Whitney U-test. f, The pathway of aromatic amino acid catabolism by gut microbes (modified from Smith and Macfarlane, Smith and Macfarlane and Zelante et al.). For all panels, asterisks indicate statistical significance: *P < 0.05, **P < 0.01, ***P < 0.001 and ****P < 0.0001. Source data
Fig. 2
Fig. 2. Bifidobacterium species produce aromatic lactic acids via an ALDH.
a, In vitro production of ILA, PLA and 4-OH-PLA by Bifidobacterium species type strains in modified MRS medium (MRSc) with 2% (w/v) glucose or a mix of HMOs as sole carbohydrate source. For the type strains of B. adolescentis, B. animalis ssp. animalis, B. animalis ssp. lactis, B. dentium and B. catenulatum, no or very poor growth (OD600nm < 0.4) was observed with HMOs as the carbohydrate source. Means of three biological replicates are shown. b, Neighbour-joining phylogenetic tree of all genes in the Bifidobacterium species type strains annotated as LDH-encoding genes (ldh). The four clusters are designated types 1–4. c, Production of ILA, PLA and 4-OH-PLA by E. coli LMG194 cells transformed with an inducible vector lacking (empty vector) or containing the type 4 ldh (Type4_ldh+) from B. longum ssp. infantis DSM 20088 in LB medium 5 h post-induction of gene expression by addition of l-arabinose and supplementation with the aromatic pyruvic acids (indolepyruvic acid, phenylpyruvic acid and 4-hydroxyphenylpyruvic acid). Bars show mean ± s.d. of three biological replicates. d, Growth curves of B. longum ssp. longum 105-A (WT), its isogenic insertional type 4 ldh mutant (Type4_ldh mutant) and the type 4 ldh mutant strain complemented with the type 4 ldh gene (complemented). Curves show mean ± s.d. of three biological replicates and doubling times reported as mean ± s.d.. e, Production of ILA, PLA, 4-OH-PLA and lactic acid by wild type, Type4_ldh mutant and the complemented strain in early stationary phase cultures as indicated in d. Bars show mean ± s.d. of three biological replicates. Statistical significance was evaluated by one-way ANOVA. ND, not detected. Source data
Fig. 3
Fig. 3. Kinetic characterization of the bifidobacterial ALDH (type 4 LDH).
a–d, Substrate saturation curves of the type 4 LDH obtained for indolepyruvic acid (a), phenylpyruvic acid (b), 4-hydroxyphenylpyruvic acid (c) and pyruvic acid (d). Kinetic parameters, which were calculated by curve-fitting two independent experimental data to the Hill equation, are shown in the insets. The reaction was carried out in the presence of 100 mM phosphate. Source data
Fig. 4
Fig. 4. Infant-type Bifidobacterium species determine faecal aromatic lactic acid concentrations during early infancy.
a,b, PCoA plots of Bray–Curtis dissimilarities (n = 234 (i)), coloured according to relative abundance of Bifidobacterium (a) or log10-transformed concentration (nmol per g of faeces) of aromatic lactic acids (sum of ILA, PLA and 4-OH-PLA) (b) in faeces of infants participating in the CIG cohort. Dashed lined circles include communities dominated (relative abundance >50%) by B. longum, B. bifidum, B. breve, B. catenulatum group or B. dentium (B. adolescentis, B. scardovii and B. animalis/pseudolongum never dominated any of the communities; Extended Data Figs. 3 and 4). (i) Six samples were omitted from the analyses due to low read counts (<8,000), and one sample was omitted due to no available metabolomics data. c, Heatmap illustrating linear mixed-model coefficients (two-sided test, adjusted for subject and age) between the absolute abundance of Bifidobacterium species (cells per g of faeces) and faecal concentrations (nmol per g of faeces) of aromatic lactic acids (ILA, PLA and 4-OH-PLA, n = 240 (ii)) or faecal relative abundances of HMOs (2′FL/3FL, 2′/3-O-fucosyllactose; 3′SL/6′SL, 3′/6′-O-sialyllactose; LNT/LNnT, lacto-N-tetraose/lacto-N-neotetraose; n = 228 (iii)) in the CIG cohort. Infant-type Bifidobacterium species is the sum of absolute abundances of B. longum, B. breve, B. bifidum and B. scardovii. Statistical significance was evaluated by FDR-corrected P values indicated by asterisks with *P < 0.05, **P < 0.01, ***P < 0.001 and ****P < 0.0001. (ii) One sample was omitted due to no available metabolomics data. (iii) Twelve samples were omitted due to the infants no longer being breastfed and one due to no available metabolomics data. df, Absolute abundance of Bifidobacterium species (average relative abundance >1% of total community) and concentrations of ILA, PLA and 4-OH-PLA in faeces of selected individuals from the CIG cohort. Values of bacterial counts <106 cells per g of faeces and metabolite concentrations <1 nmol per g of faeces are not shown. Summarized absolute abundance of infant-type Bifidobacterium species is indicated with grey background shading. d, Breastfed infants colonized early with infant-type Bifidobacterium species and with concurrent high concentrations of ILA, PLA and 4-OH-PLA through the first 6 months of life. e, Infants colonized late with infant-type Bifidobacterium species and with concurrent low concentrations of ILA, PLA and 4-OH-PLA. f, Infants with recorded oral antibiotics intake during the first 6 months of life. Similar dynamics of the remaining infants can be seen in Extended Data Fig. 10. Source data
Fig. 5
Fig. 5. Faecal abundances of infant-type Bifidobacterium species and ILA associate with AhR activity.
a,b, Scatter plot of subject- and age-adjusted linear mixed-model β coefficients (versus FDR-corrected P values, two-sided tests) obtained from associations between AhR activity of faecal water (n = 111) from selected CIG infants (Fig. 4d–f, n = 11) in a reporter cell line assay and absolute abundance of faecal bacterial taxa (relative abundance >0.1%, n = 40, circles) (a) or quantities of aromatic amino acid metabolites (n = 19, triangles) (b) measured in the same samples. Coloured circles/triangles mark taxa/metabolite measures that are significantly positively (red) or negatively (blue) associated with AhR activity within an FDR-corrected P of 0.1 (dashed line). ILA, indolelactic acid; Tyr, tyrosine. Source data
Fig. 6
Fig. 6. ILA affects human immune responses via AhR and HCA3.
a, Fold change in IL-22 production in purified human CD4+ T cells cultured for 3 d under TH17-polarizing conditions in the presence of ILA at 5, 50 and 200 µM as compared to vehicle (DMSO control). ILA5µm versus vehicle, P = 0.54; ILA50µm versus vehicle, P = 0.031; ILA200µm versus vehicle, P = 0.0098. b, Fold changes over vehicle (DMSO control) in IL-22 production in human purified CD4+ T cells cultured under TH17-polarizing conditions in the presence of 200 µM ILA with and without the AhR antagonist CH-223191. ILA200µm versus ILA200µm + AhRant, P = 0.0005. c, Fold change in IL-12p70 production in purified human monocytes stimulated with LPS and IFN-γ in the presence of ILA at 5, 50 and 200 µM as compared to vehicle (DMSO control). ILA5µm versus vehicle, P = 0.27; ILA50µm versus vehicle, P = 0.041; ILA200µm versus vehicle, P = 0.031. d, Fold changes over vehicle (DMSO control) in IL-12p70 production in purified human monocytes stimulated with LPS and IFN-γ in the presence of 200 µM ILA with and without the AhR antagonist CH-223191. ILA200µm versus ILA200µm + AhRant, P = 0.033. e, Fold changes over vehicle (DMSO control) in IL-12p70 production in purified human monocytes stimulated with LPS and IFN-γ in the presence of 200 µM ILA and ScrRNA or HCA3 siRNA. ILA200µm + ScrRNA versus ILA200µm + HCA3 siRNA, P = 0.027. For all panels, bars show mean ± s.d.. Each dot represents data from an individual donor (n = 4–6), and, for both T cells and monocytes, the measurements are derived from two-to-three independent experiments. Statistical significance was evaluated by two-sided paired (a and c) or two-sided unpaired (b, d and e) t-tests (with Welch’s correction for b and asterisks indicating *P < 0.05, **P < 0.01, ***P < 0.001. For a and c, the absolute cytokine values were compared between ILA- versus vehicle-treated cells. For b, d and e, the fold changes over vehicle (ratios) were compared between ILA- and ILA + antagonist/siRNA-treated cells. Dashed lines indicate a fold change over vehicle of 1. Source data
Extended Data Fig. 1
Extended Data Fig. 1. Bifidobacterium species composition and aromatic lactic acids in partially breastfed and weaned infants aged 9 months from the SKOT cohort.
a, Pie chart of the average Bifidobacterium species composition given as percent of total Bifidobacterium abundance (n = 59 infants). Legend includes the average percent of each species compared to the total faecal microbiota community (See also Supplementary Data 1g). b, Left panel: Box and whiskers plot (line: median, box: IQR, whiskers: min-max) of faecal abundance of indolelactic acid (ILA), phenyllactic acid (PLA) and 4-hydroxyphenyllactic acid (4-OH-PLA) in partially breastfed (n = 24, red) and weaned (n = 35, blue) infants. Right panel: Box and whiskers plot (line: median, box: IQR, whiskers: min-max) of urine abundance of ILA, PLA and 4-OH-PLA in partially breastfed (n = 19, red) and weaned (n = 30, blue) infants. Statistical significance was evaluated by two-sided Mann–Whitney U-test. c, Heatmap of Spearman’s Rank correlation coefficients (two-sided tests) between the relative abundances of ILA, PLA and 4-OH-PLA measured in urine and the faecal relative abundance of Bifidobacterium species or faecal concentrations of ILA, PLA and 4-OH-PLA of the same infants (n = 49 infants). For all panels asterisks indicate statistical significance: *p < 0.05, **p < 0.01, ***p < 0.001 and ****p < 0.0001. Source data
Extended Data Fig. 2
Extended Data Fig. 2. In vivo production of aromatic lactic acids in previously germ-free mice colonized with either B. longum 105-A WT or type 4 ldh mutant.
a, CFU counts of B. longum 105-A WT or type 4 ldh mutant from caecal content of mice monocolonized with either the WT (n = 21) or type 4 ldh mutant strain (n = 29). Bars and error bars indicate median ± IQR. b–d, caecal concentrations of the aromatic lactic acids (indolelactic acid (ILA), phenyllactic acid (PLA) and 4-hydroxyphenyllactic acid (4-OH-PLA)) in mice monocolonized with either the WT (n = 21) or type 4 ldh mutant strain (n = 29). Line and error bars indicate median ± IQR. For all panels statistical significance was evaluated by two-sided Mann–Whitney U-tests. Source data
Extended Data Fig. 3
Extended Data Fig. 3. Faecal microbiota composition of the CIG infants.
a, Average relative abundance of the dominant faecal microbial taxa (average relative abundance >0.1%) across all samples (comprising 97.5% of all microbial taxa detected). b, Temporal development of the average gut microbiota composition and Shannon diversity index (marked with circles) across all individuals. c, Intra-individual temporal development of gut microbiota composition and Shannon diversity index (marked with circles). Dietary patterns and consumption of antibiotics are indicated for each individual. If nothing else is indicated, infants were singletons, vaginally born at term. Source data
Extended Data Fig. 4
Extended Data Fig. 4. Beta diversity in CIG cohort.
a-f, Principal coordinates analysis (PCoA) plots of Bray–Curtis dissimilarities, based on all OTUs detected in CIG faecal samples (n = 234), coloured according to a, subject and b-f, relative abundances of Bifidobacterium longum, Bifidobacterium bifidum, Bifidobacterium breve, Bifidobacterium catenulatum group or Bifidobacterium dentium, respectively. Source data
Extended Data Fig. 5
Extended Data Fig. 5. Temporal development in abundance of infant-type Bifidobacterium species, aromatic lactic acids, and human milk oligosaccharides in faeces from infants in the CIG cohort.
Scatter plots of a, age against absolute abundance of infant-type Bifidobacterium species (defined as the sum of absolute abundances of B. longum, B. breve, B. bifidum and B. scardovii) in faeces or b–d, age against faecal concentrations of aromatic lactic acids (ILA, PLA and 4-OH-PLA, n = 240) or e-g, age against relative faecal abundance of human milk oligosaccharides (2′FL/3FL, LNT/LNnT and 3′SL/6′SL, n = 228) during the first 6 months of life in the CIG cohort. A local polynomial regression (LOESS) fit is shown with coloured mean line and 95% CI shaded in grey. Statistical significance was evaluated by two-sided repeated measures correlations (rrm is the repeated measures correlation coefficient). Source data
Extended Data Fig. 6
Extended Data Fig. 6. Associations between Infant-type Bifidobacterium species and aromatic lactic acids and human milk oligosaccharides in faeces from infants in the CIG cohort.
Scatter plots of the relationship between faecal absolute abundance of infant-type Bifidobacterium species, and a–c, faecal concentrations of aromatic lactic acids (ILA, PLA and 4-OH-PLA, n = 240) or d–f, relative faecal abundance of human milk oligosaccharides (2′FL/3FL, LNT/LNnT and 3′SL/6′SL, n = 228) in the CIG cohort. Statistical significance was evaluated by two-sided repeated measures correlations (rrm is the repeated measures correlation coefficient). Linear regression curve fits are shown with coloured mean line and 95% CI indicated in grey shading. Source data
Extended Data Fig. 7
Extended Data Fig. 7. Correlations between relative abundance of bacterial taxa and concentrations of the aromatic lactic acids at each sampling point in the CIG cohort.
a, Spearman’s rank correlations between relative abundance of faecal bacterial genera (average relative abundance > 1%) and faecal concentrations of the aromatic lactic acids (ILA, PLA and 4-OH-PLA) at each sampling point. b, Spearman’s rank correlations between relative abundance of faecal Bifidobacterium species (average relative abundance > 0.1%) and faecal concentrations of the aromatic lactic acids at each sampling point. Infant-type Bifidobacterium species is the sum of the relative abundances of B. longum, B. breve, B. bifidum and B. scardovii. For both panels statistical significance was evaluated by uncorrected p-values (two-sided tests) indicated by asterisks with *p < 0.05, **p < 0.01, ***p < 0.001 and ****p < 0.0001. Source data
Extended Data Fig. 8
Extended Data Fig. 8. Validation of associations between absolute abundance of Bifidobacterium species and faecal abundances of the aromatic lactic acids and human milk oligosaccharides in the CIG cohort.
Heatmaps illustrating linear mixed model coefficients (adjusted for subject and age) between the absolute abundance of Bifidobacterium species estimated by a, 16 S rRNA amplicon sequence variant analysis or b, species/subspecies-specific qPCR and faecal concentrations of aromatic lactic acids (ILA, PLA and 4-OH-PLA, n = 240) or relative faecal abundances of human milk oligosaccharides (2′FL/3FL, 3′SL/6′SL and LNT/LNnT, n = 228) in the CIG cohort. For both panels statistical significance was evaluated by false discovery rate-corrected p-values (two-sided tests) indicated by asterisks with *p < 0.05, **p < 0.01, ***p < 0.001 and ****p < 0.0001. Source data
Extended Data Fig. 9
Extended Data Fig. 9. Relative abundance of high quality metagenome-assembled genomes (MAGs) with aldh (type 4 ldh) in 4 months and 12 months old infants and mothers.
Metagenome data were retrieved from Bäckhed et al [reference]. Line, boxes and whiskers indicate median, IQR and ±1.5*IQR and statistical significance was evaluated by two-sided Mann–Whitney U-tests. Source data
Extended Data Fig. 10
Extended Data Fig. 10. Absolute abundances of Bifidobacterium species and concentrations of aromatic lactic acids in faeces of infants in the CIG cohort.
a,b, Absolute abundance of Bifidobacterium species (average relative abundance >1% of total community) and concentrations of indolelactic acid (ILA), phenyllactic acid (PLA) and 4-hydroxyphenyllactic acid (4-OH-PLA) in faeces of individuals from the Copenhagen Infant Gut (CIG) cohort. Values of bacterial counts below 106 cells/g faeces and metabolite concentrations below 1 nmol/g faeces are not shown. Infant-type Bifidobacterium species is the sum of the absolute abundances of B. longum, B. breve, B. bifidum and B. scardovii and is indicated with grey background shading. a, Infants early colonized with infant-type Bifidobacterium species (colonized within first month reaching average relative abundance >40% during first 6 months), b, Infants with late colonization of infant-type Bifidobacterium species (not detectable or on average <0.5% of total community within the first 3 months of life). Source data

Comment in

References

    1. Victora CG, et al. Breastfeeding in the 21st century: epidemiology, mechanisms, and lifelong effect. Lancet. 2016;387:475–490. doi: 10.1016/S0140-6736(15)01024-7. - DOI - PubMed
    1. Horta BL, Loret de Mola C, Victora CG. Long-term consequences of breastfeeding on cholesterol, obesity, systolic blood pressure and type 2 diabetes: a systematic review and meta-analysis. Acta Paediatr. 2015;104:30–37. doi: 10.1111/apa.13133. - DOI - PubMed
    1. Oddy WH. Breastfeeding, childhood asthma, and allergic disease. Ann. Nutr. Metab. 2017;70:26–36. doi: 10.1159/000457920. - DOI - PubMed
    1. Laursen, M. F. et al. Infant gut microbiota development is driven by transition to family foods independent of maternal obesity. Msphere10.1128/mSphere.00069-15 (2016). - PMC - PubMed
    1. Bäckhed F, et al. Dynamics and stabilization of the human gut microbiome during the first year of life. Cell Host Microbe. 2015;17:690–703. doi: 10.1016/j.chom.2015.04.004. - DOI - PubMed

Publication types

MeSH terms