. 2021 Dec;16(12):1362-1370.
doi: 10.1038/s41565-021-00979-0. Epub 2021 Oct 21.

Single-molecule mechanical fingerprinting with DNA nanoswitch calipers

Affiliations

Single-molecule mechanical fingerprinting with DNA nanoswitch calipers

Prakash Shrestha et al. Nat Nanotechnol. 2021 Dec.

Abstract

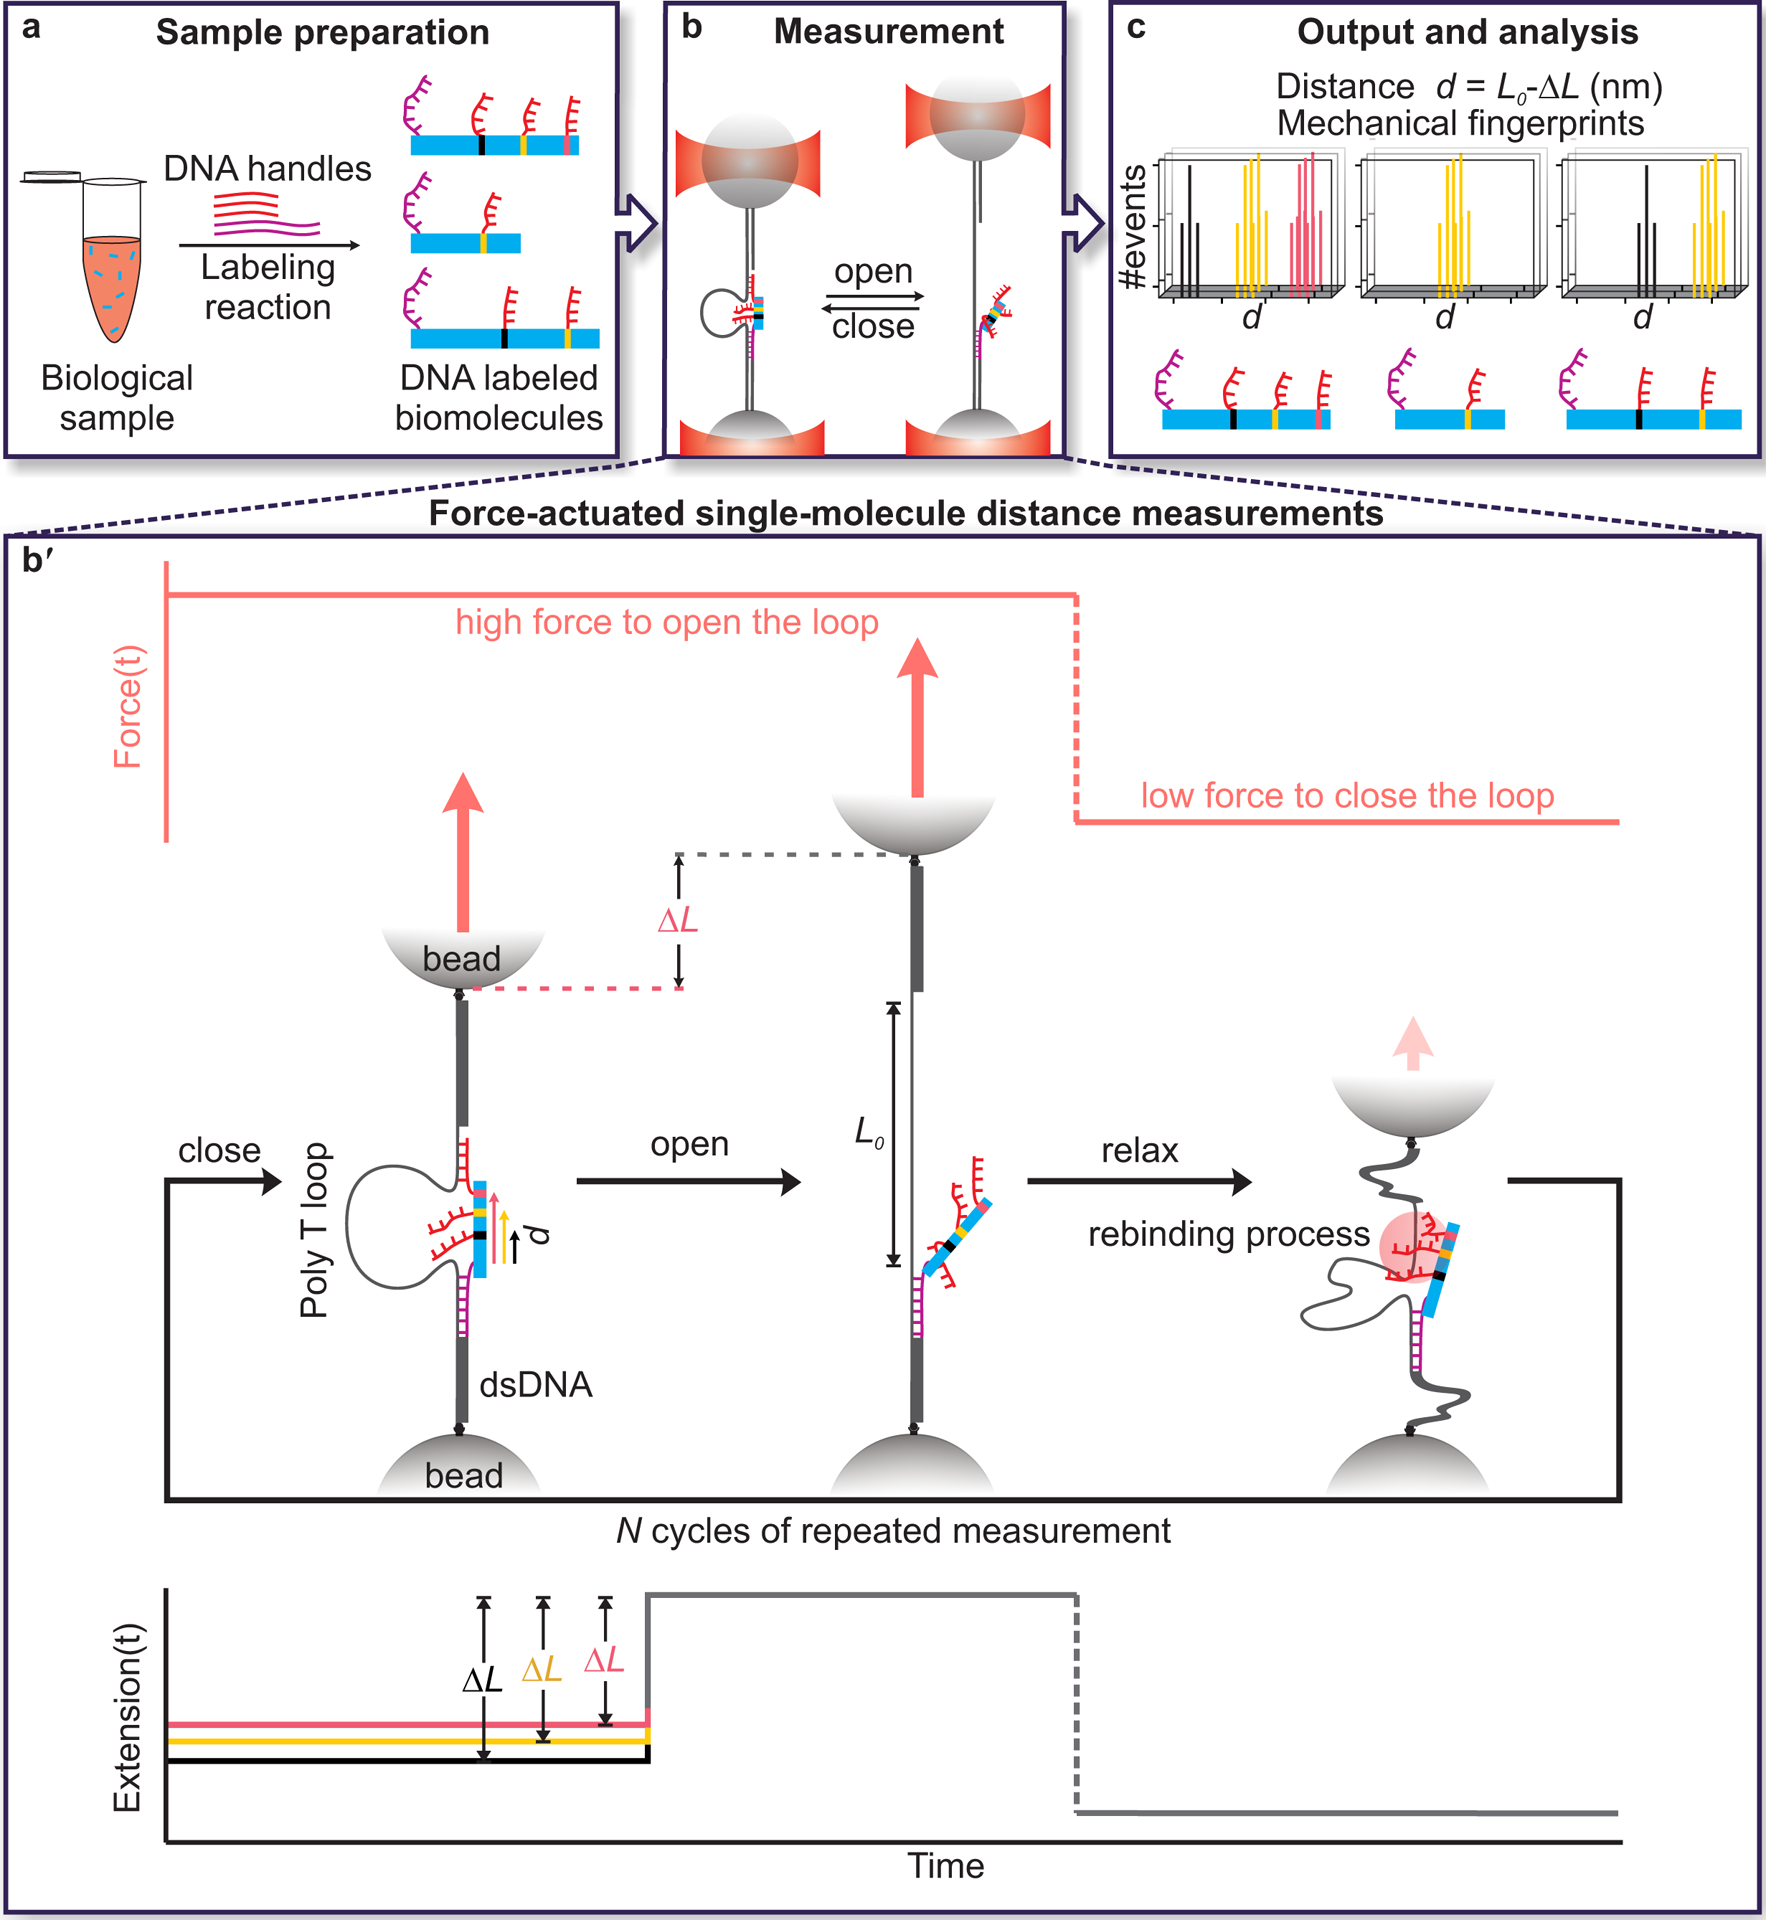
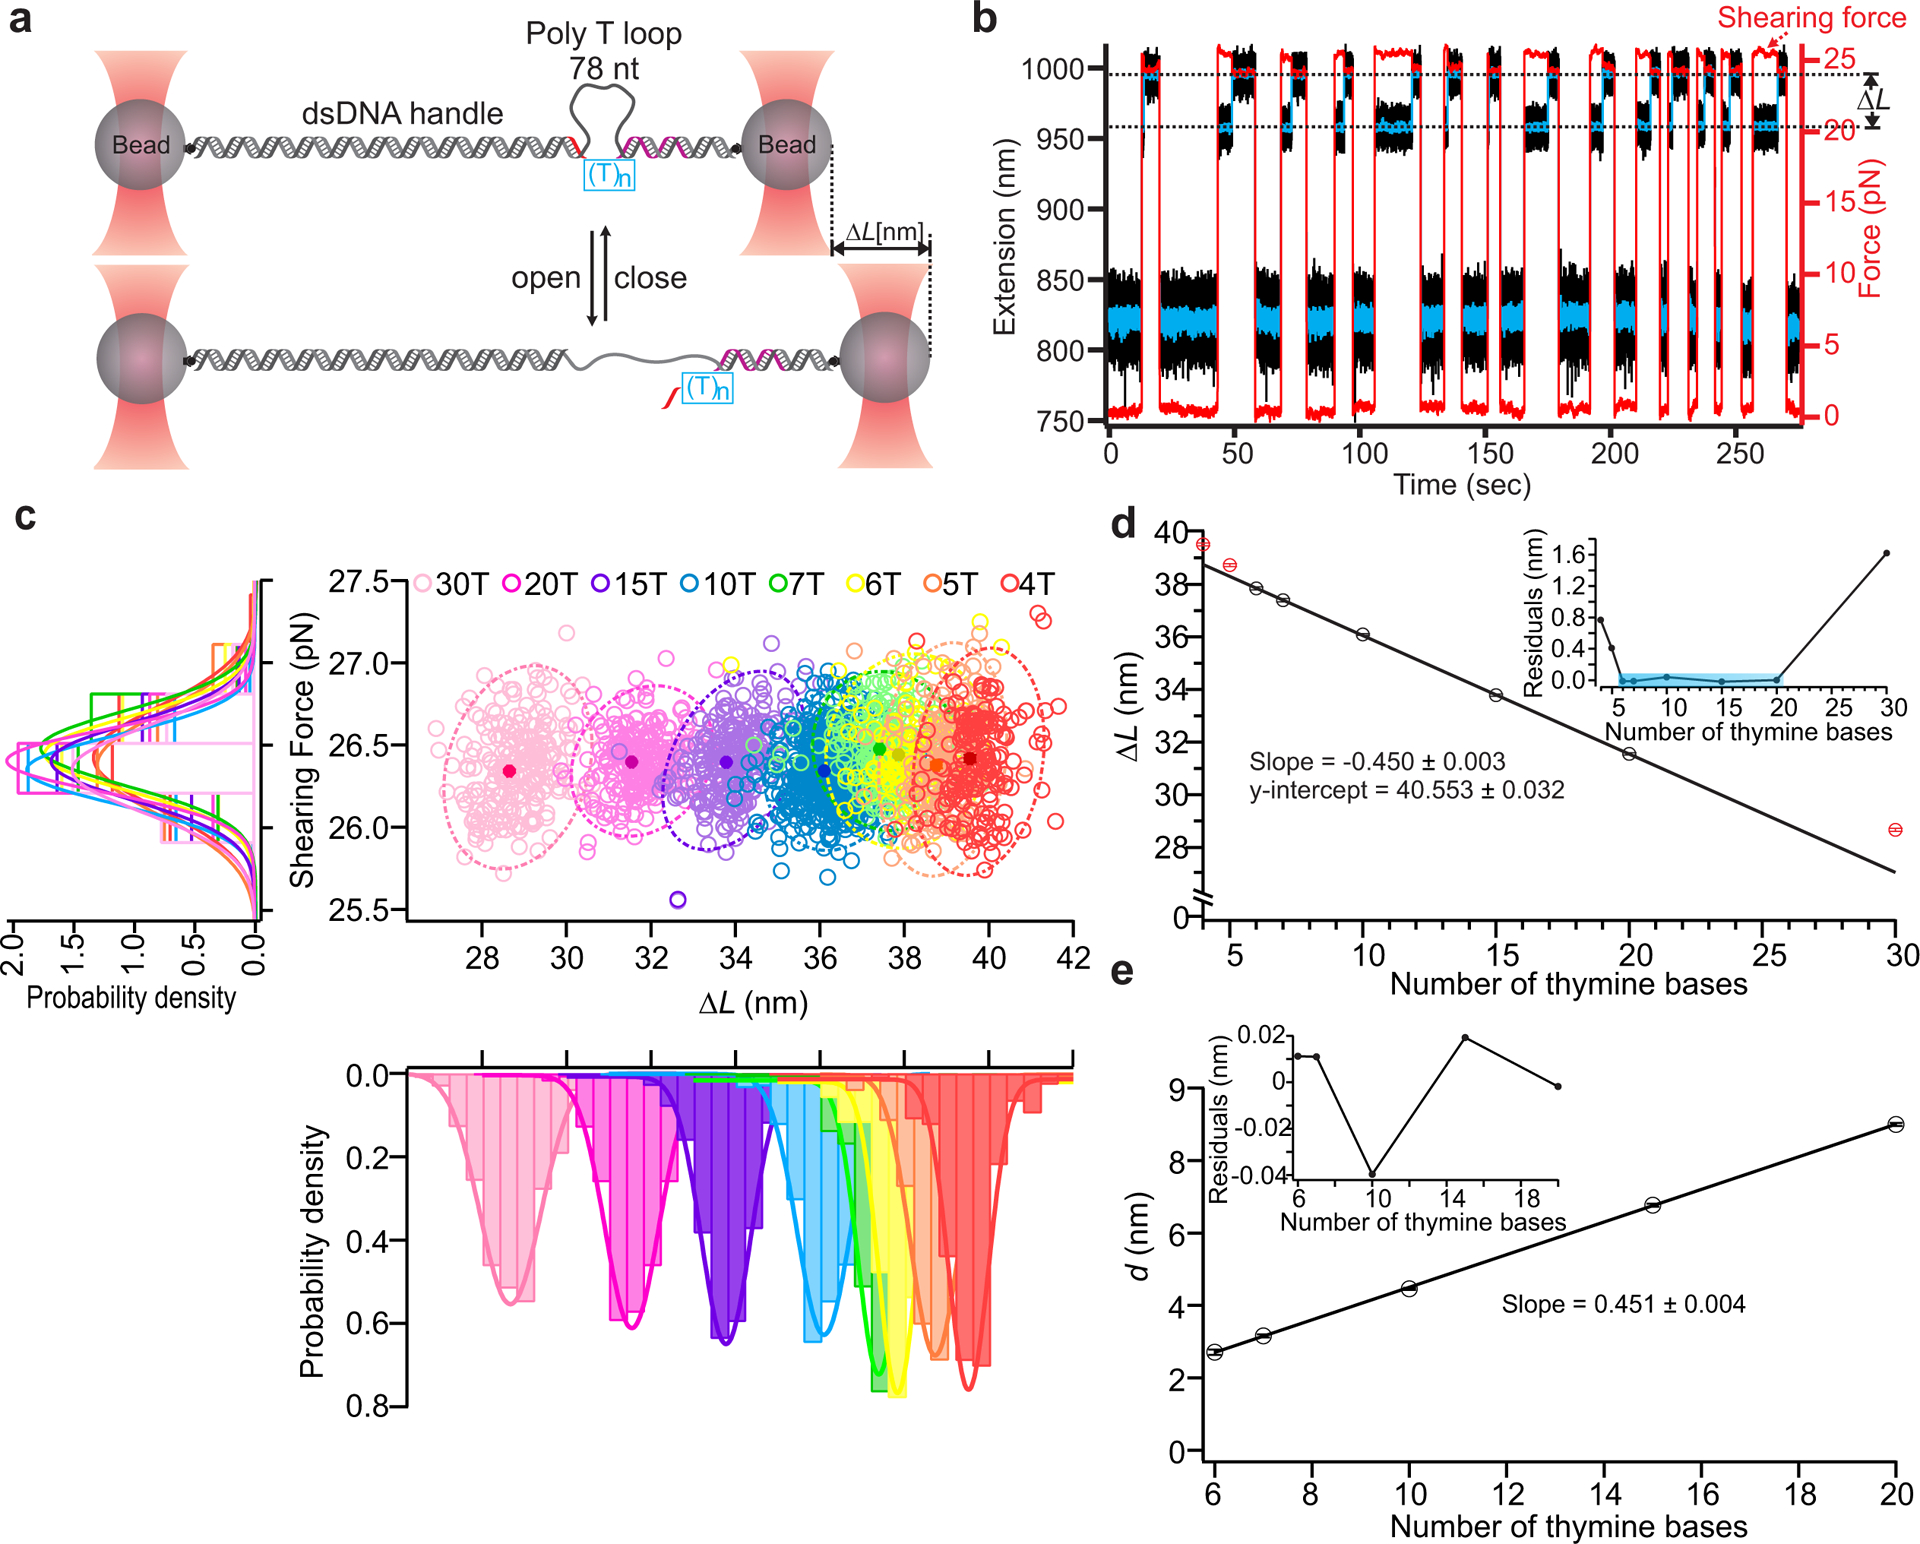
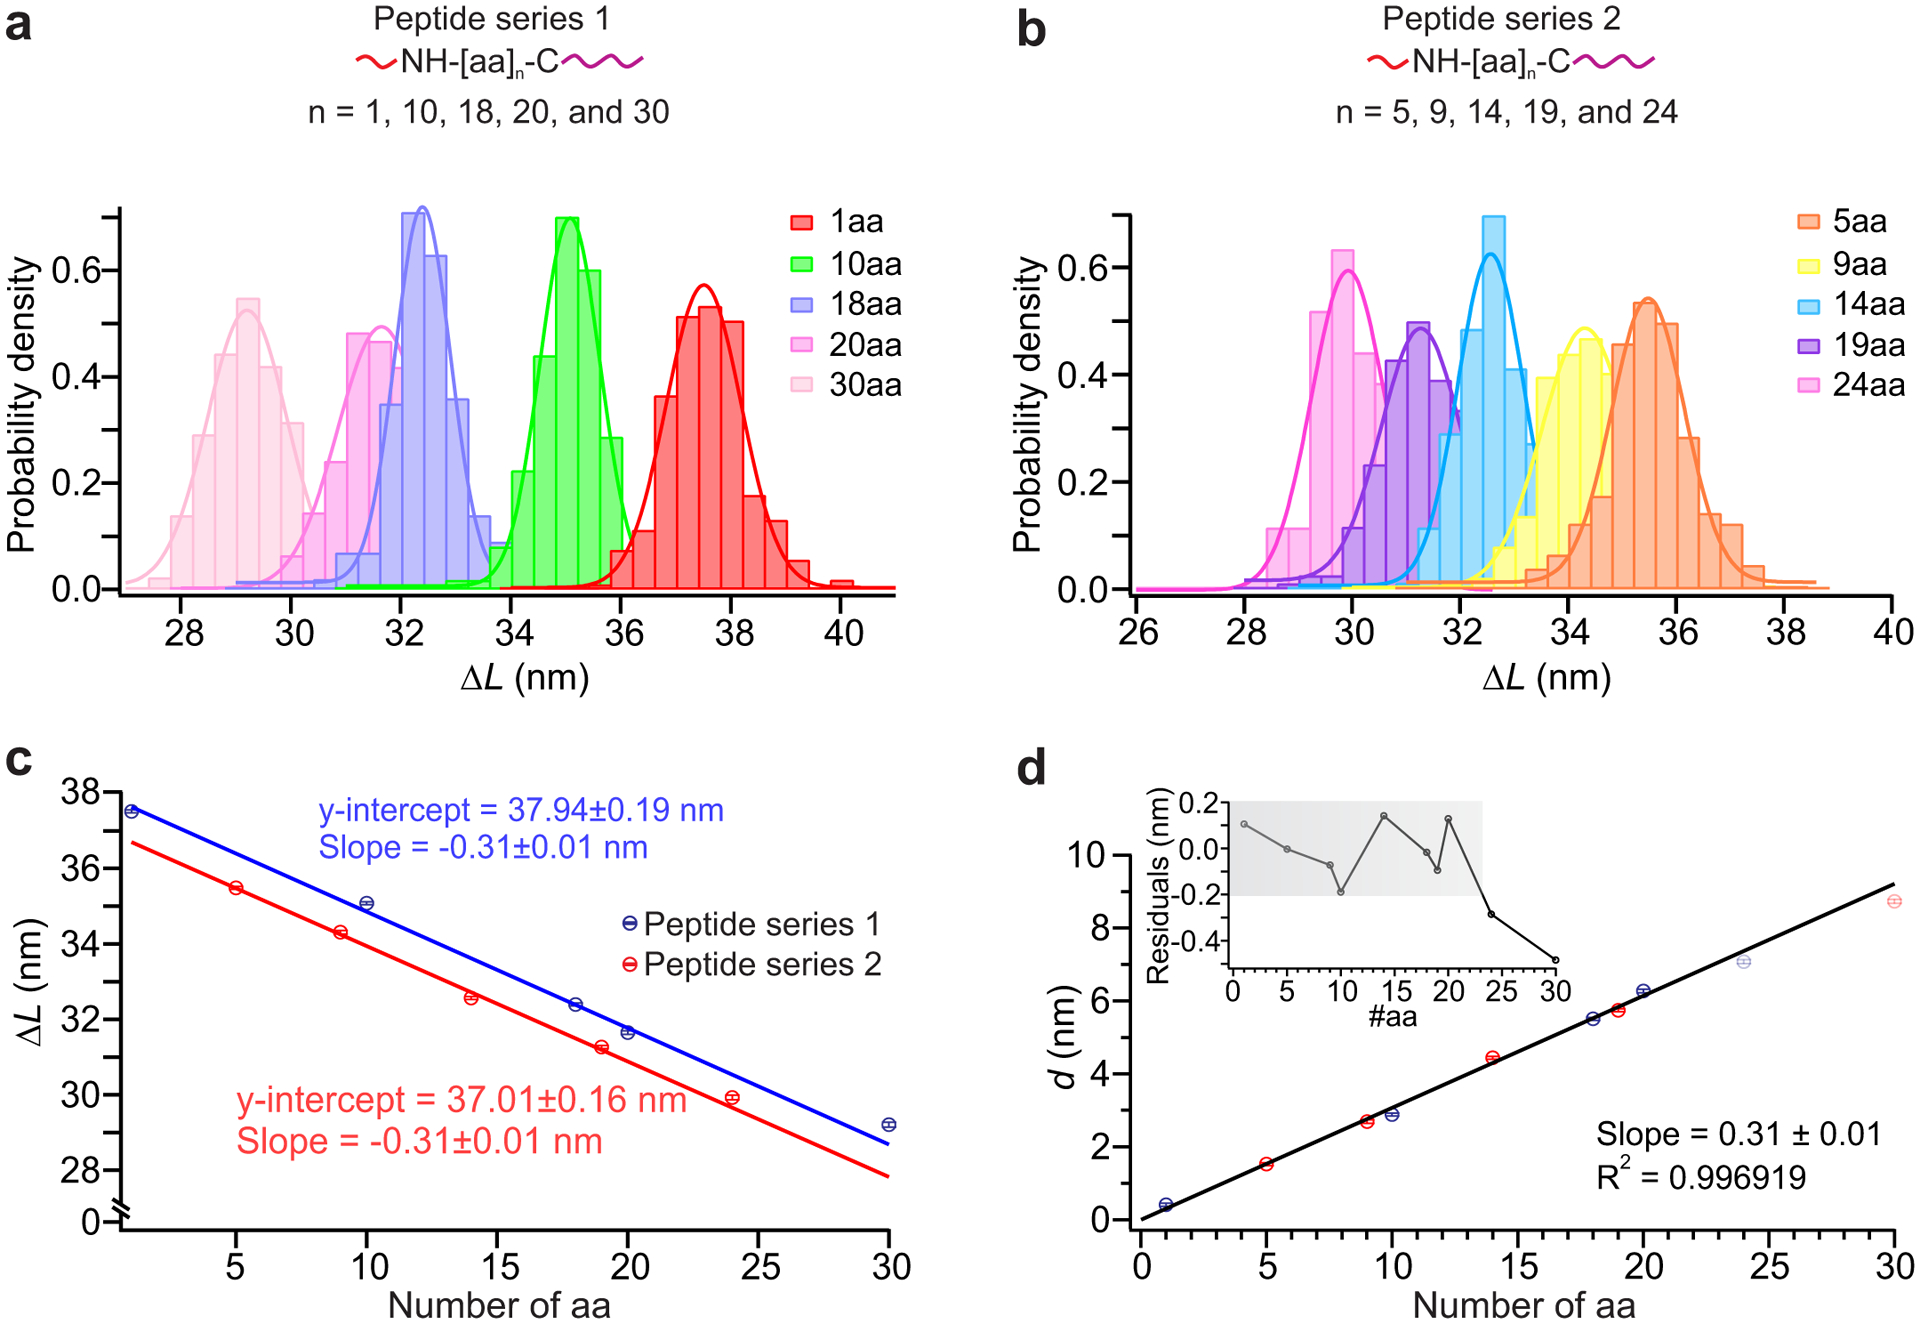
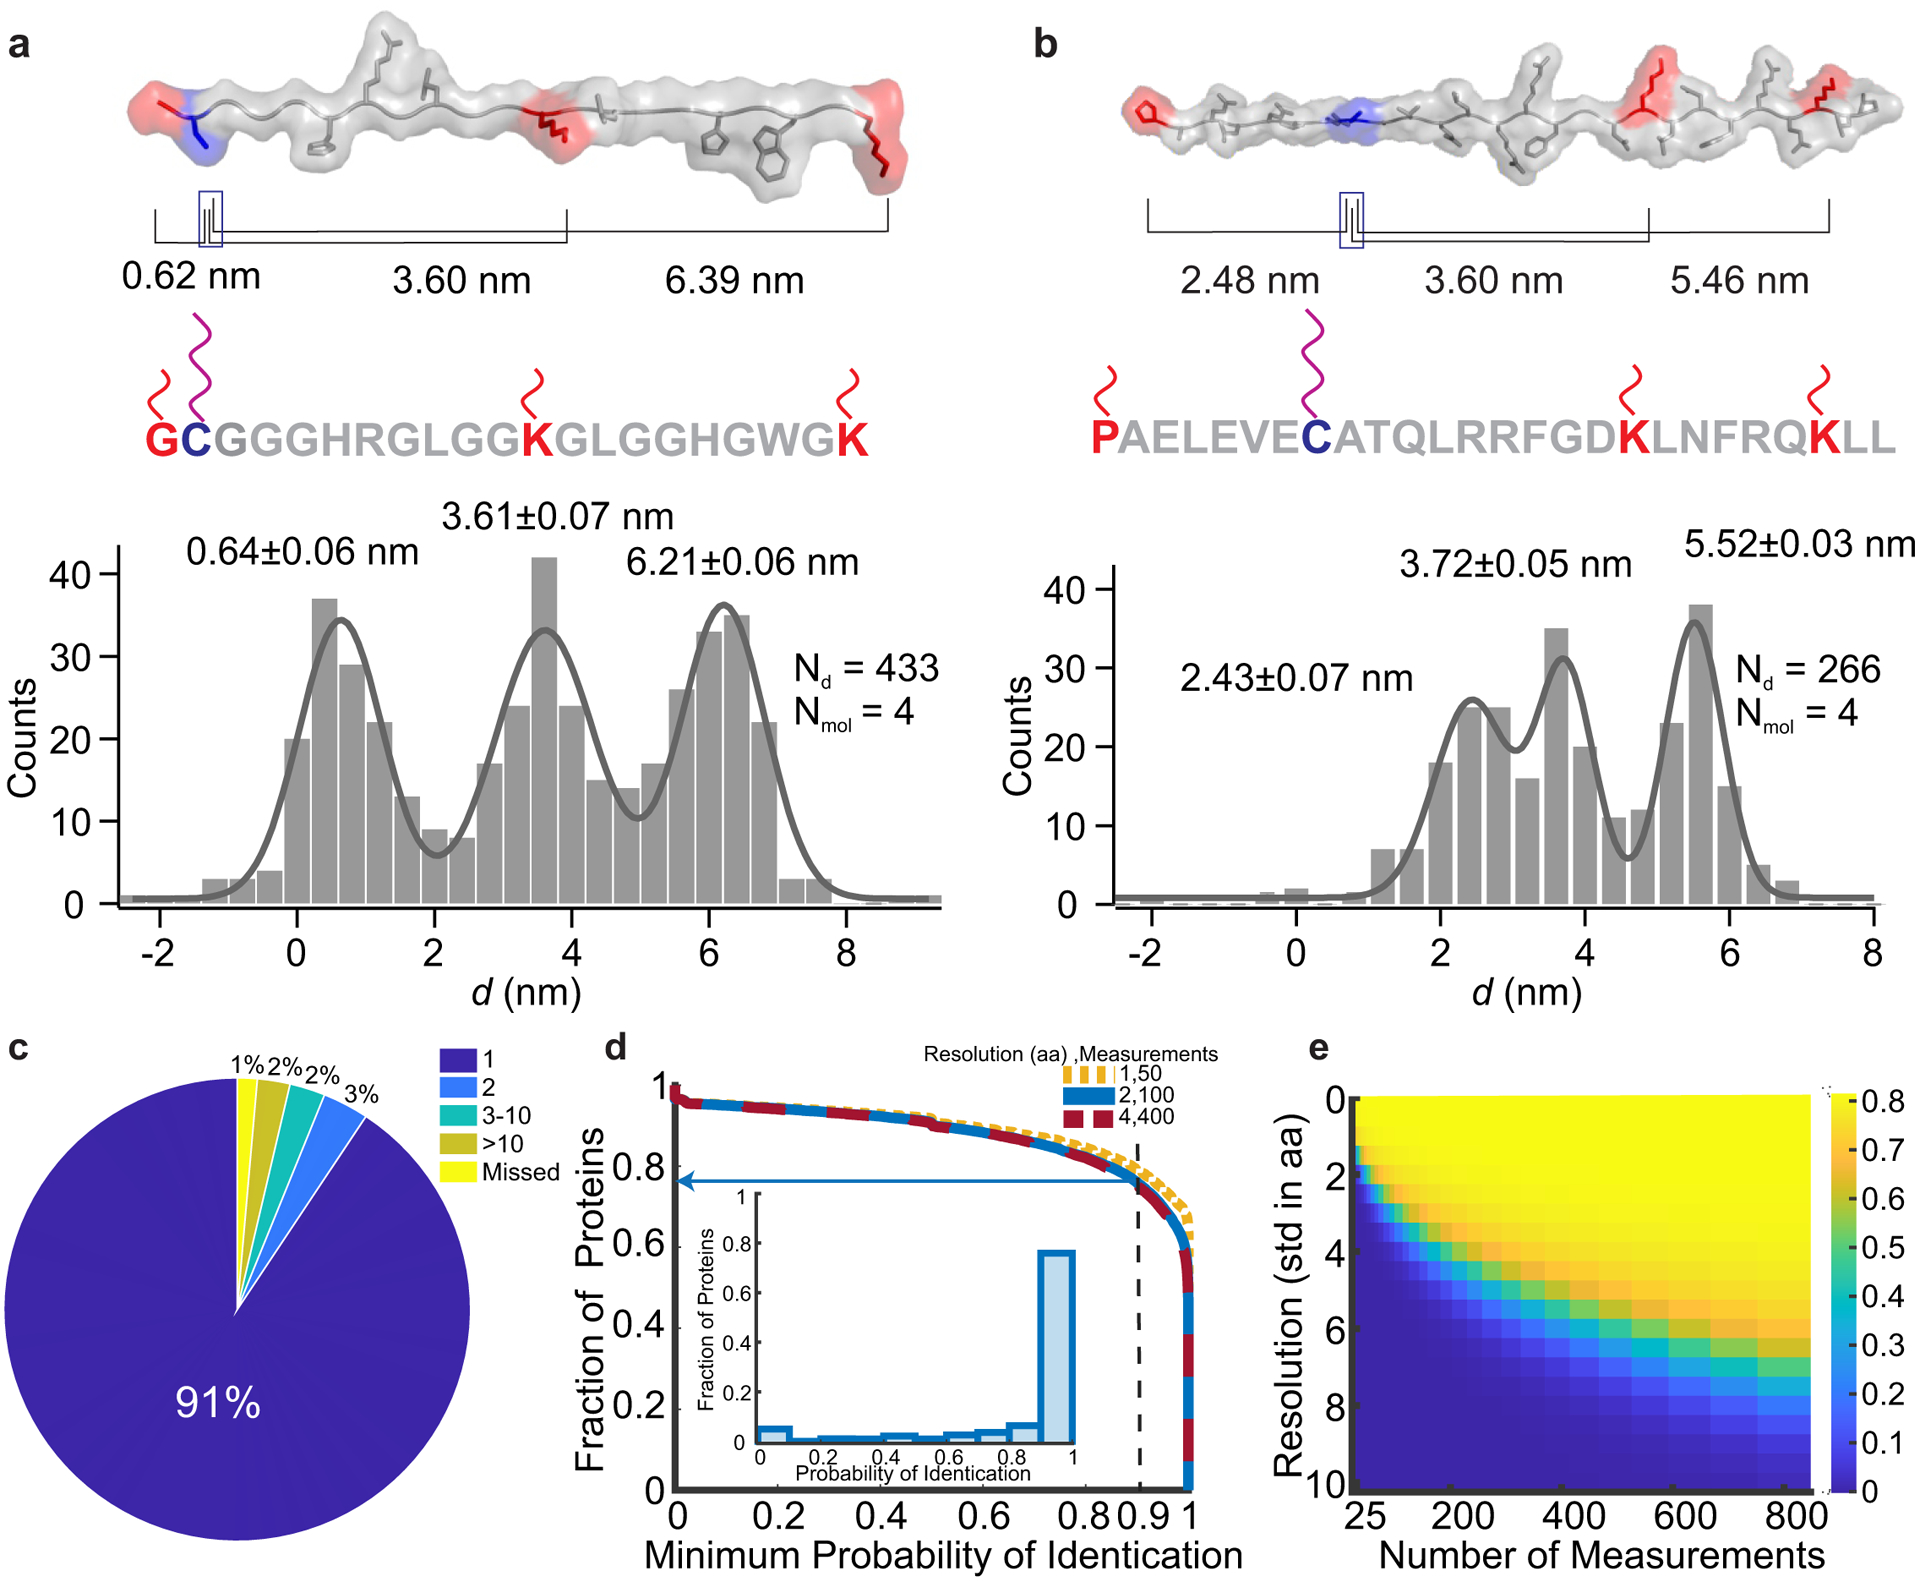
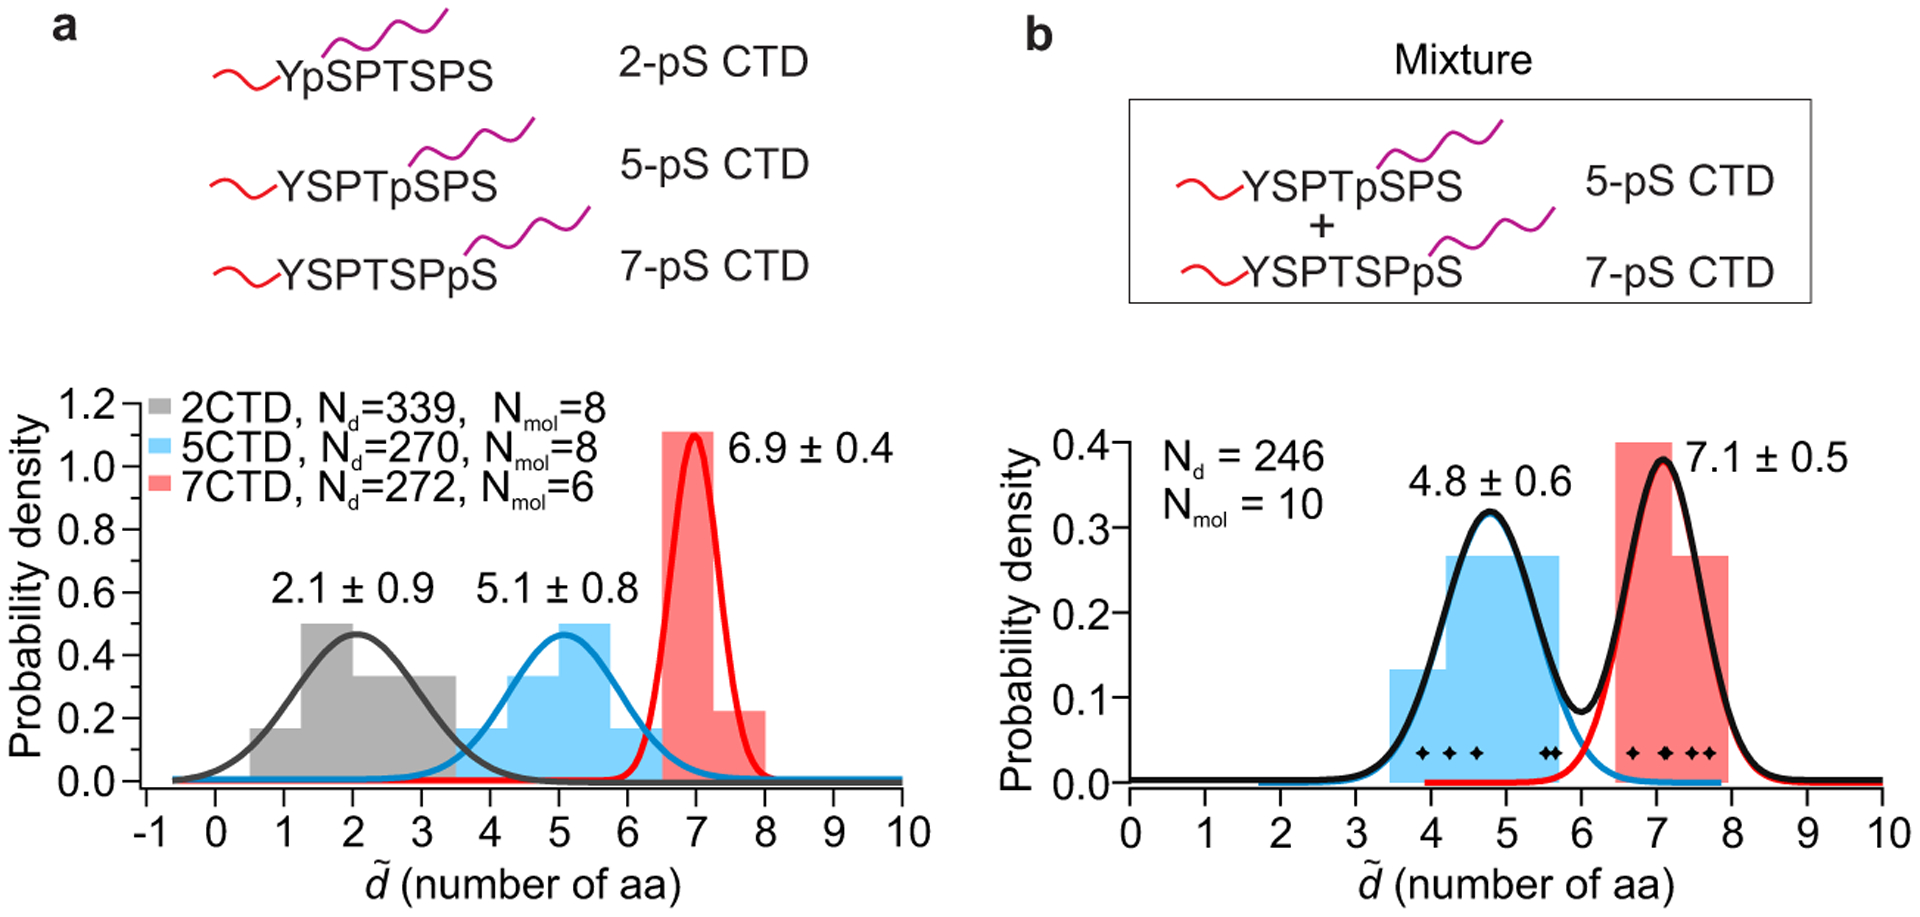
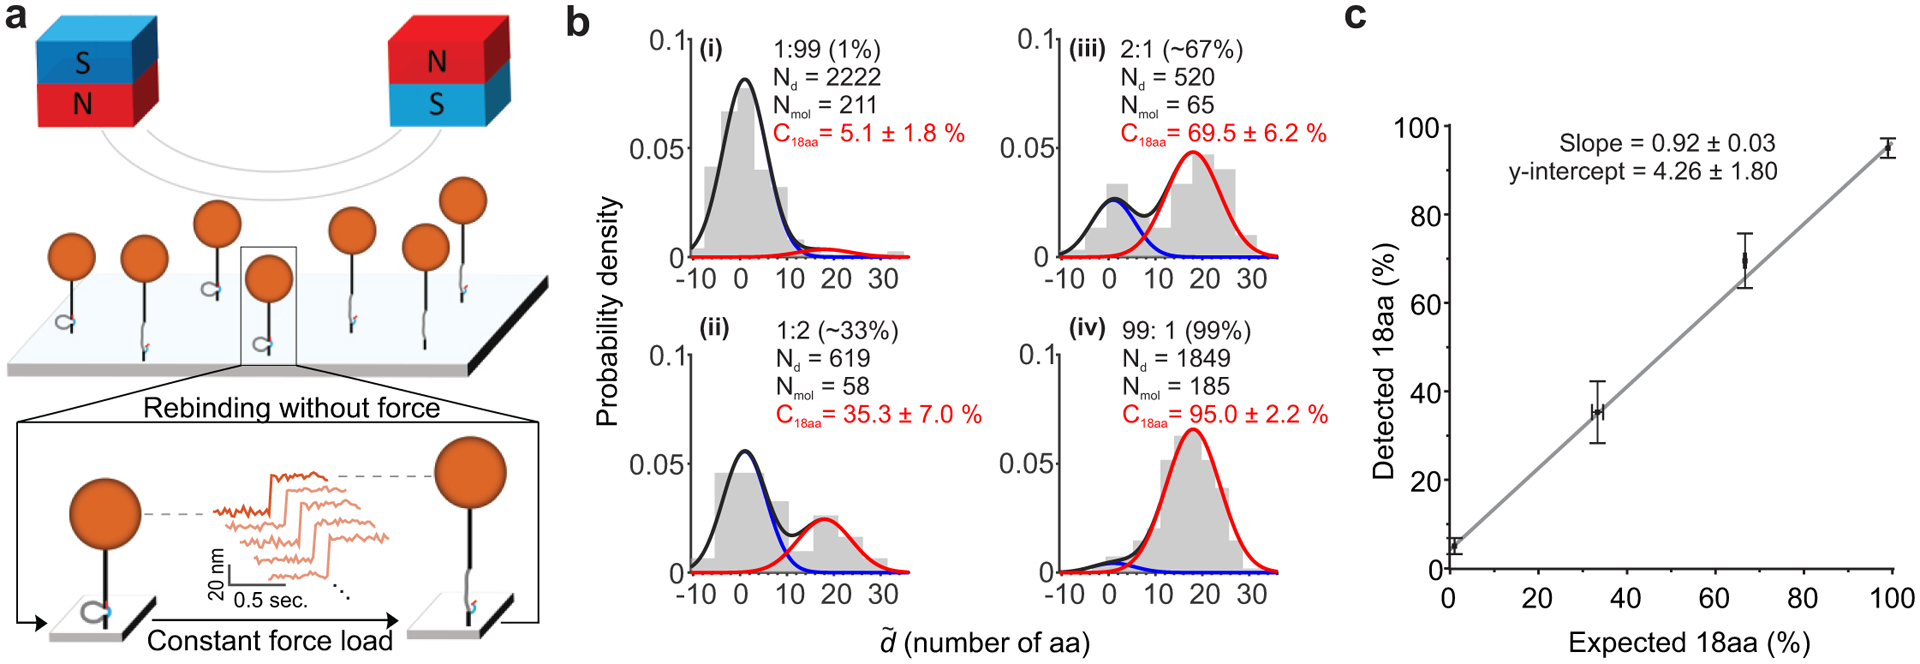
Decoding the identity of biomolecules from trace samples is a longstanding goal in the field of biotechnology. Advances in DNA analysis have substantially affected clinical practice and basic research, but corresponding developments for proteins face challenges due to their relative complexity and our inability to amplify them. Despite progress in methods such as mass spectrometry and mass cytometry, single-molecule protein identification remains a highly challenging objective. Towards this end, we combine DNA nanotechnology with single-molecule force spectroscopy to create a mechanically reconfigurable DNA nanoswitch caliper capable of measuring multiple coordinates on single biomolecules with atomic resolution. Using optical tweezers, we demonstrate absolute distance measurements with ångström-level precision for both DNA and peptides, and using multiplexed magnetic tweezers, we demonstrate quantification of relative abundance in mixed samples. Measuring distances between DNA-labelled residues, we perform single-molecule fingerprinting of synthetic and natural peptides, and show discrimination, within a heterogeneous population, between different posttranslational modifications. DNA nanoswitch calipers are a powerful and accessible tool for characterizing distances within nanoscale complexes that will enable new applications in fields such as single-molecule proteomics.


Conflict of interest statement

Competing interests

W.M.S. and W.P.W. have filed patent applications for various aspects of this work.

Figures

Fig. 1.
Fig. 1.. Schematic overview of single-molecule mechanical fingerprinting with DNA Nanoswitch Calipers (DNCs).
a, Samples are prepared through residue-specific labeling of biomolecules with DNA handles. Here, a long, mechanically strong handle (purple strand) and several shorter, mechanically weak handles (red strands) are attached to each target biomolecule. b, Distances between pairs of handles on target molecules are measured by grabbing and releasing them with the caliper while monitoring the change-in-length (ΔL) between looped and unlooped states. Force-actuation is carried out by tethering the caliper between two optically trapped beads. b′, Detailed view of distance measurements showing the application of force on a DNA Nanoswitch caliper in repeated cycles (top panel), the corresponding changes in conformation of the caliper (middle panel), and the corresponding changes in extension (bottom panel). The increase in length (ΔL) observed when the loop opens during the high-force period depends on the initial distance between handles on the target bridging the loop—the longer the initial distance, the shorter the ΔL. c, Changes in tether length (ΔL) are subtracted from the loop length (L0) to yield absolute distance measurements (d = L0ΔL). Multiple measurements are made on each single-molecule target to yield mechanical fingerprints, which can enable the identification of targets in a heterogeneous biological sample. Note that figures are not to scale.
Fig. 2.
Fig. 2.. Characterization of DNA Nanoswitch Calipers (DNCs) with ssDNA targets.
a, Calipers are stretched between two optically trapped beads and actuated by force to measure the lengths of ssDNA targets (see method). The long, mechanically strong handle (purple) and short, mechanically weak handle (red) on the opposite ends of (T)n bridges (blue box) hybridize with the caliper to form the loop (78 thymine bases). During each measurement cycle, the force switches between a low force (~0 pN) that enables rebinding of the short handle and a higher force (~26 pN) that initiates unbinding of this handle. b, Typical trajectories of force (red trace) and extension (black trace with blue trace representing data smoothed by sliding window averaging of 10) during multiple cycles of force actuation. c, Distribution analysis of the change-in-length (ΔL) during loop opening at the specific shearing force (~26 pN). Scatter plots of shearing force versus ΔL for different lengths of ssDNA targets are presented with 95% confidence ellipses superimposed (dotted lines); peak values are presented as solid circles with localization accuracy in shearing force and ΔL represented by the width in each dimension (middle panel). Histograms of the shearing force (left panel), and change-in-length (ΔL) (lower panel) for all the ssDNA targets are also presented with Gaussian fits superimposed. The number of data points in each target ranges between 126 and 622 across multiple molecules (Supplementary Table 3). d, Correlation plot of mean ΔL vs. number of thymine bases using results of Gaussian fits; a linear fit over the range of 6–20 bases is superimposed (R2 = 0.9999). The excluded points are indicated in red. Inset depicts residuals of the linear fit. e, Transformation of mean ΔL measurements within the fitting range to absolute distances measurements (d) by subtraction of the offset. Inset shows residuals in this range, which are all less than 50 picometers. Error bars represent the calculated standard error of the mean.
Fig. 3.
Fig. 3.. Calibration of DNA Nanoswitch Calipers (DNC) for peptide targets.
a, and b, Top panels: measurement of distances for peptides of varying lengths for peptide series 1 (a) and peptide series 2 (b) (Supplementary Table 2); each short, mechanically weak handle (red) is attached to the amino group of the N terminus and each long, mechanically strong handle (purple) is attached to the sulfhydryl group of the cysteine residue at the C terminus. The number of data points in each target ranges between 131 and 668 across multiple molecules (Supplementary Table 4). Bottom panels: histograms of the change-in-length (ΔL) measured by DNC for two different sets of peptides measured at different times presented with Gaussian fits superimposed. c, Correlation plot of mean ΔL for (a) (blue) and (b) (red) peptides vs number of amino-acid residues in each peptide, using results of Gaussian fits. Solid lines depict linear fits, with each y-intercept representing the effective loop size L0 for the given experimental conditions. d, Correlation plot of mean absolute distance d (d = L0ΔL) vs peptide length; a linear fit over the range 1–20aa is superimposed (R2 = 0.9969). Residuals are shown in the inset with grey shadow highlighting the linear dynamic range (the range over which the measured distance changes linearly with the peptide length) of this caliper, which is approximately 1–20aa. Error bars represent the calculated standard error of the mean.
Fig. 4.
Fig. 4.. Single-molecule peptide fingerprinting.
a and b, Top panels: structures of a custom-designed peptide and a NOXA BH3 peptide, respectively, that were labeled with DNA handles for caliper measurements. Amino groups (red) on the N-terminus and lysine residues were labeled with short, mechanically weak handles, while the cysteine residue (purple) was labeled with a long, mechanically strong handle. Peptide structures are rendered as linear for visualization and correspond to their putative force-denatured states during mechanical fingerprinting. Black lines indicate the expected absolute distance between the respective positions of short handles from the long handle. Bottom panels: aggregate histograms of the absolute distances (d = L0ΔL) with multi-peak Gaussian fits (grey curve). Representative ΔL measurements obtained on a single molecule can be seen in Supplementary Figure 6. c, Uniqueness analysis showing the number of human-protein hits in the Swiss-Prot database for each mechanical fingerprint for a caliper span of 120 aa. d, Fraction of proteins that can be identified as a function of minimum required probability of identification with arrow showing fraction of the database that can be identified with 90% certainty). Inset: Histogram of probability of identification for proteins under representative experimental conditions (caliper span: 120 aa, measurement error: 2 aa, 100 measurements per molecule). e, Heat map of fraction of proteins that can be identified with 90% certainty with a caliper span of 120 aa for a range of measurement errors and measurements per molecule.
Fig. 5.
Fig. 5.. Single-molecule mechanical fingerprinting of post-translational modifications in a heterogeneous mixture of peptides.
a, Characterization of post-translational modifications in C-terminal domains (CTD) of RNA Polymerase II. Long DNA handles were attached to phosphorylated serines at positions 2, 5 or 7 to measure distances from the N terminus, where a short DNA handle is attached (Top panel). Stacked histogram of the dimensionless absolute distance in units of the number of amino-acid residues between handles (d˜, number of aa, localized per molecule) of the three different peptides is shown below, with Gaussian fits superimposed and labeled by peak value ± standard deviation. ΔL measurements presented without per molecule averaging and used for calibration can be seen in Supplementary Figures 5b&c. b, Demonstration of peptide identification in a heterogeneous sample. Histogram depicts the dimensionless absolute distance (d˜, number of aa, localized per molecule) obtained by analyzing 10 molecules in a 1:1 mixture of 5- and 7-phosphoserine CTD peptides; molecules were classified based on the measured distance, and color-coded accordingly. Gaussian fits labeled by peak value ± standard deviation are superimposed.
Fig. 6.
Fig. 6.. Multiplexed single-molecule mechanical fingerprinting of synthetic peptides in different heterogeneous mixtures.
a, Schematic representation of DNA Nanoswitch Calipers distance measurements performed in parallel using magnetic tweezers. The magnetic field gradient generated by the pair of magnets above the sample cell pulls the tethered beads upward with force controlled by the magnets’ position. Cartoon below illustrates the protocol for repeated cycles of force application: each cycle consists of a constant pulling force to induce rupture of the weak handles, followed by a near zero-force reassociation period to facilitate rehybridization of the weak handles. b, Histograms of the dimensionless distance distributions (d˜), in units of the number of amino acids between handles, obtained from samples containing mixtures of peptides (18aa and 1aa) at different ratios: i) 1:99, ii) 66:33, iii) 33:66, and iv) 99:1. The solid lines plotted over the histogram show the results of maximum likelihood fitting of a mixture of two Gaussians, which was used to obtain the detected percentage of 18aa peptide in each mixture. c, Correlation between the expected and detected percentage of 18aa peptides in the heterogeneous mixtures (R2 = 0.997). Error bars along the y-axis represent estimated 68% confidence intervals, while x-error bars represent standard deviations from gel-based quantification measurements.

References

    1. Aebersold R & Mann M Mass spectrometry-based proteomics. Nature 422, 198–207 (2003). - PubMed
    1. Restrepo-Pérez L, Joo C & Dekker C Paving the way to single-molecule protein sequencing. Nat. Nanotechnol 13, 786–796 (2018). - PubMed
    1. Callahan N, Tullman J, Kelman Z & Marino J Strategies for Development of a Next-Generation Protein Sequencing Platform. Trends Biochem. Sci 45, 76–89 (2020). - PMC - PubMed
    1. Timp W & Timp G Beyond mass spectrometry, the next step in proteomics. Sci. Adv 6, eaax8978 (2020). - PMC - PubMed
    1. Alfaro JA et al. The emerging landscape of single-molecule protein sequencing technologies. Nat. Methods 18, 604–617 (2021). - PMC - PubMed

Publication types