. 2021 Nov;17(11):1157-1167.
doi: 10.1038/s41589-021-00878-4. Epub 2021 Oct 21.

Trivalent PROTACs enhance protein degradation via combined avidity and cooperativity

Affiliations

Trivalent PROTACs enhance protein degradation via combined avidity and cooperativity

Satomi Imaide et al. Nat Chem Biol. 2021 Nov.

Abstract

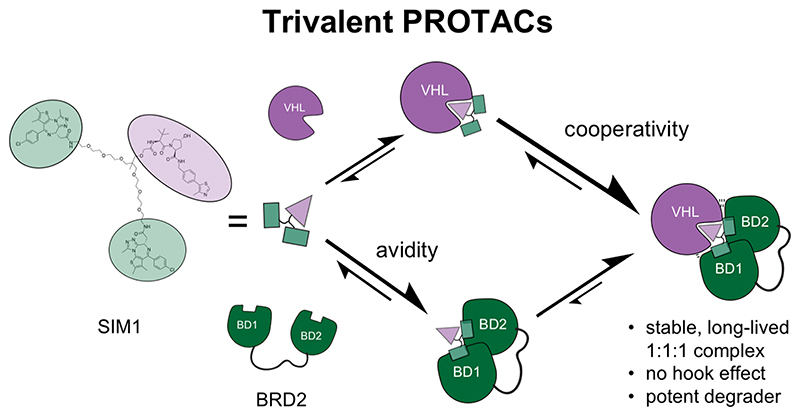
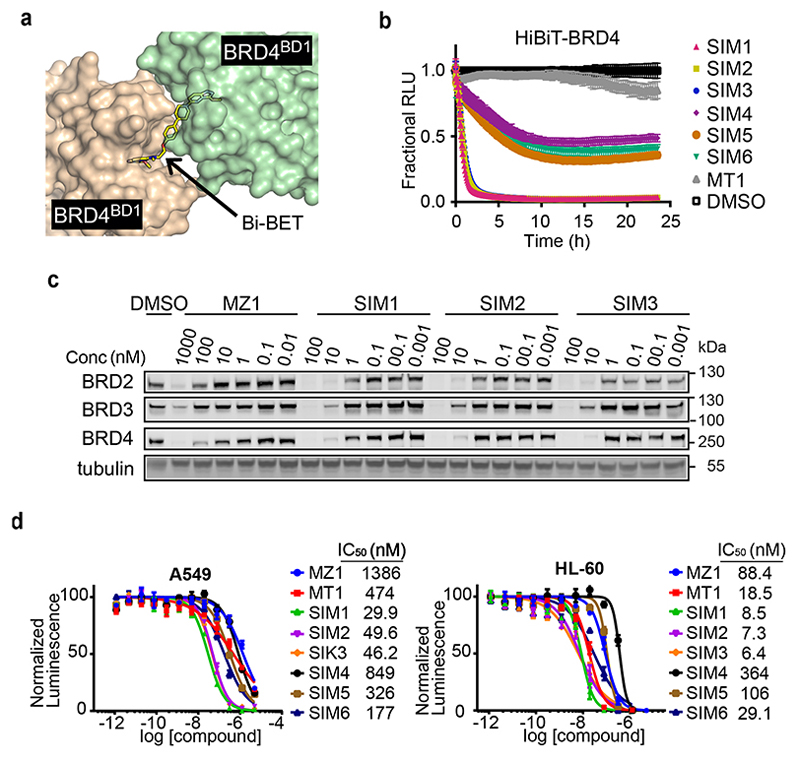
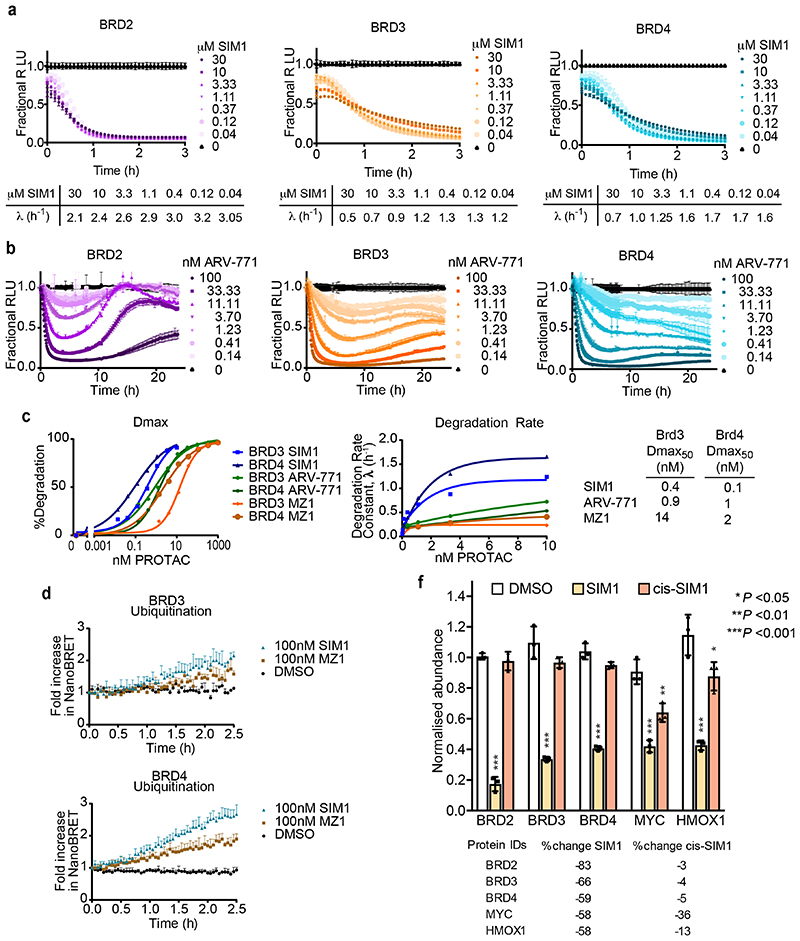
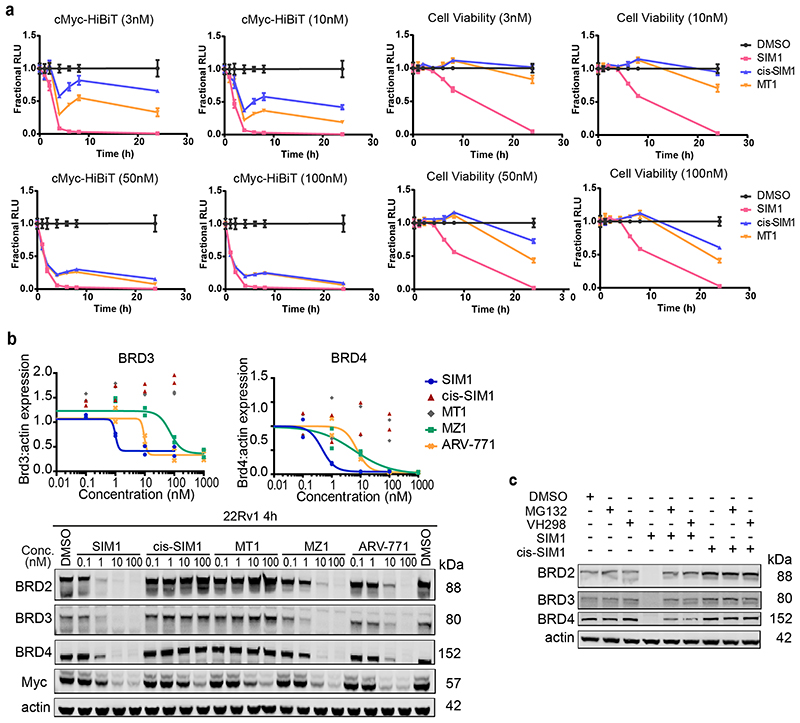
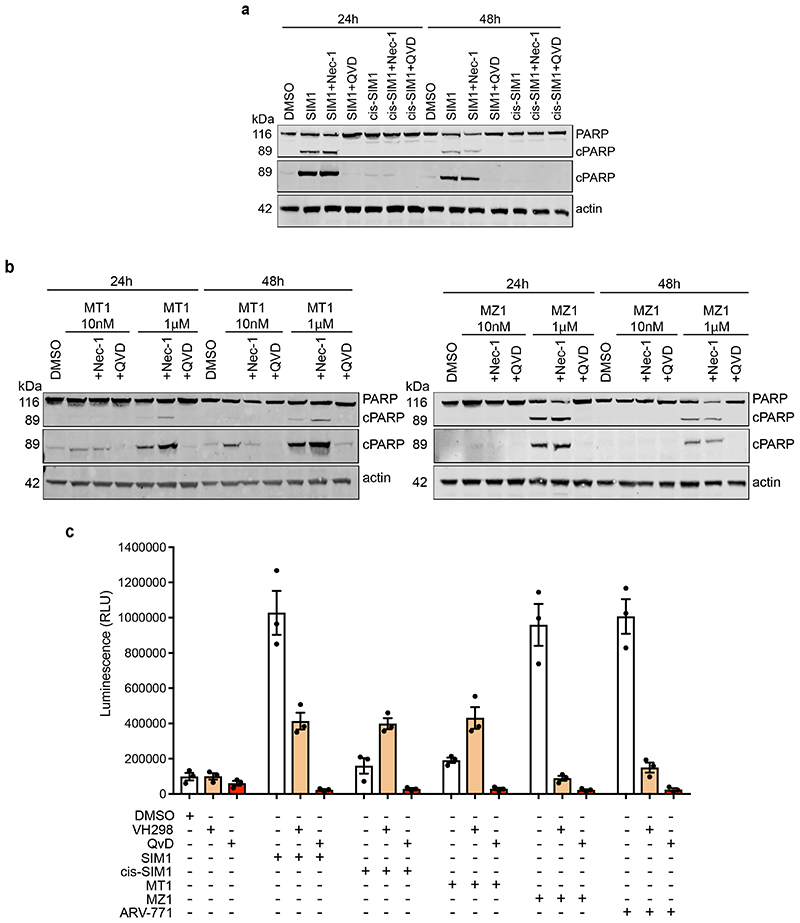
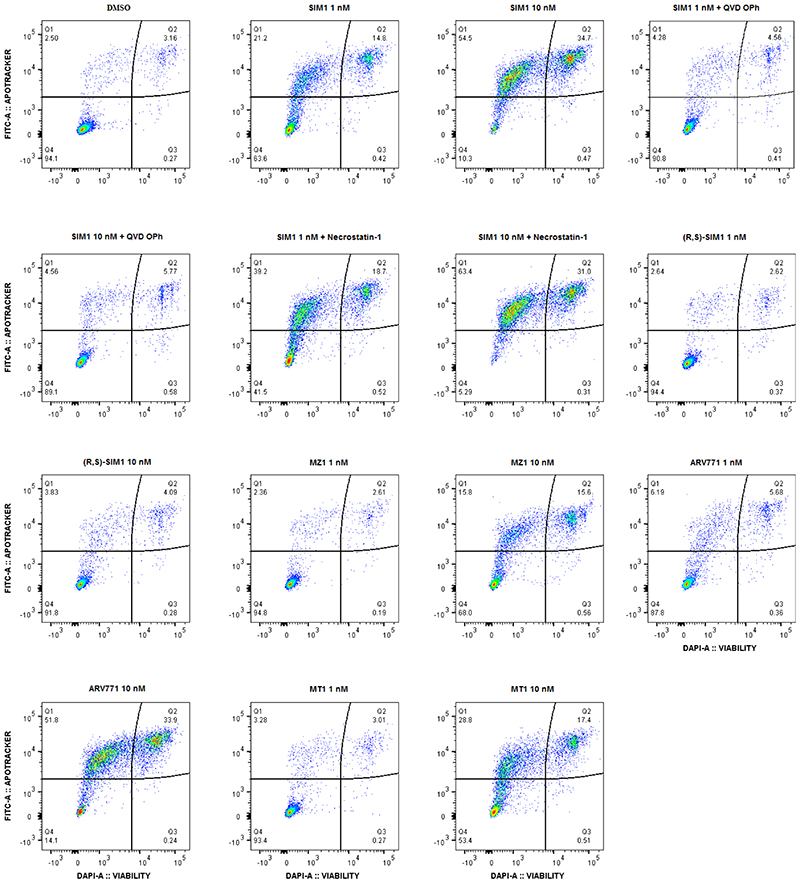
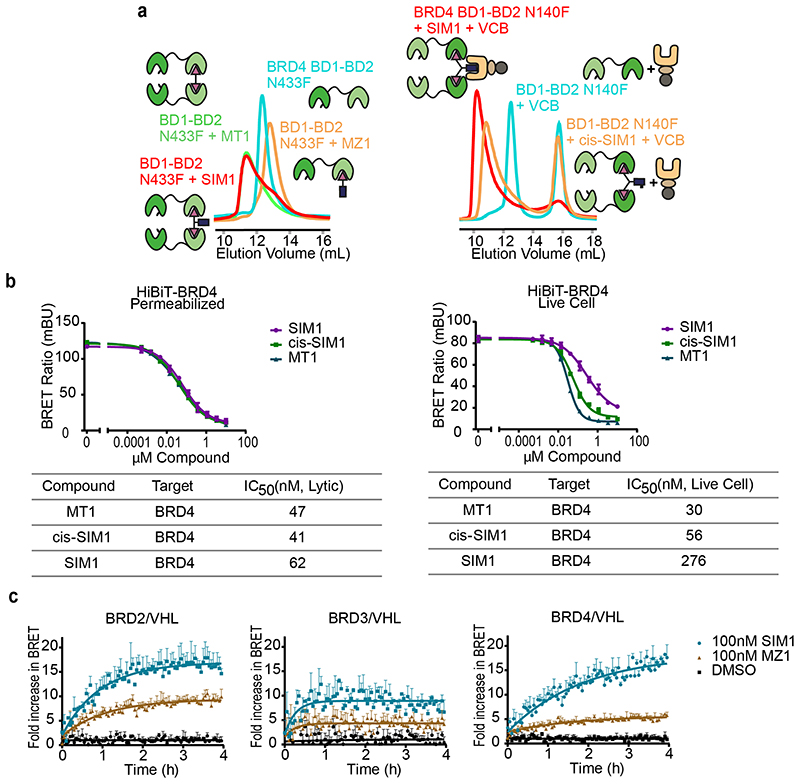
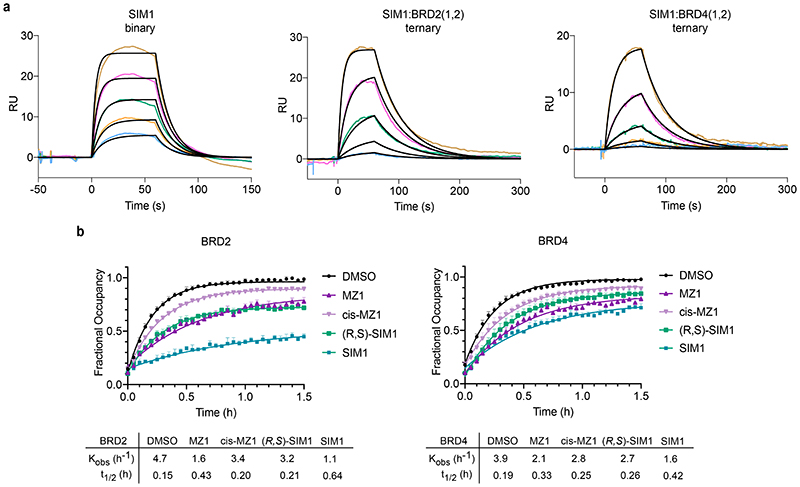
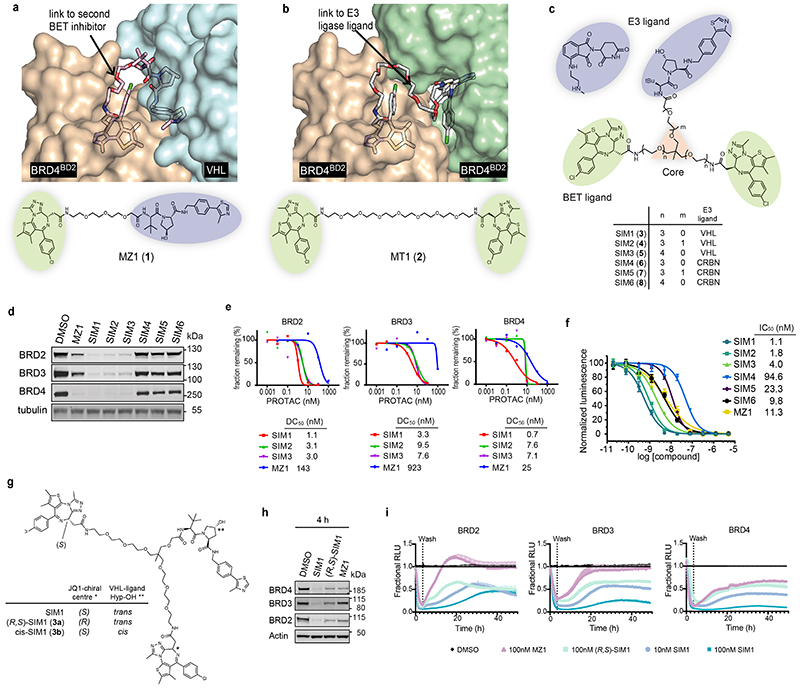
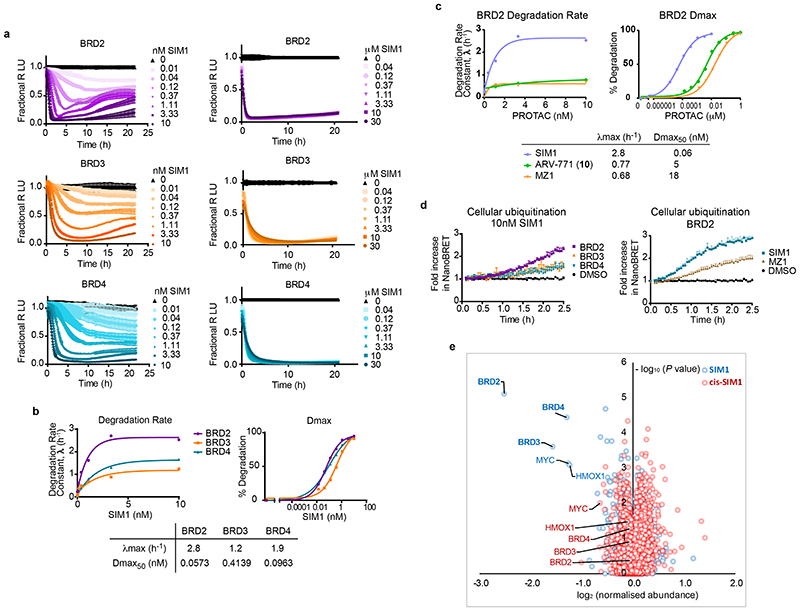
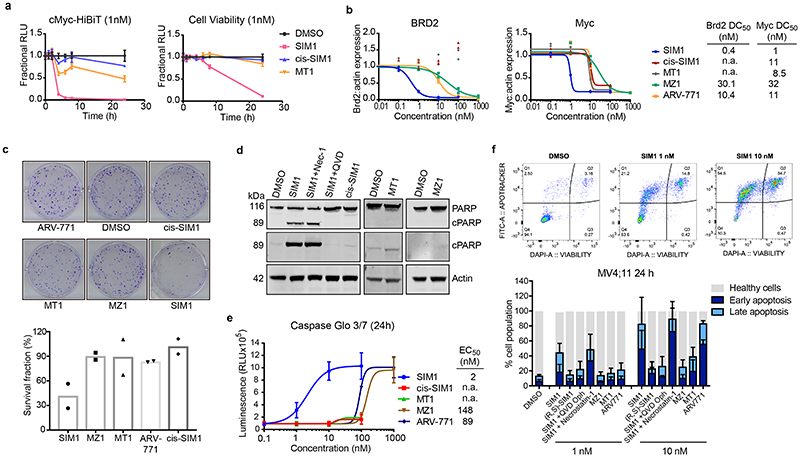
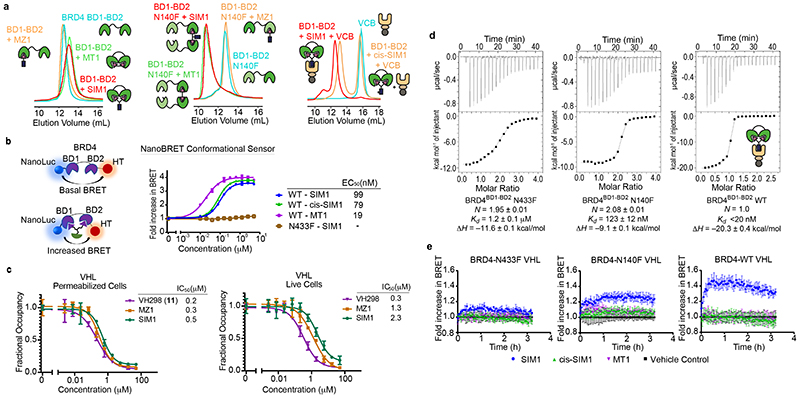
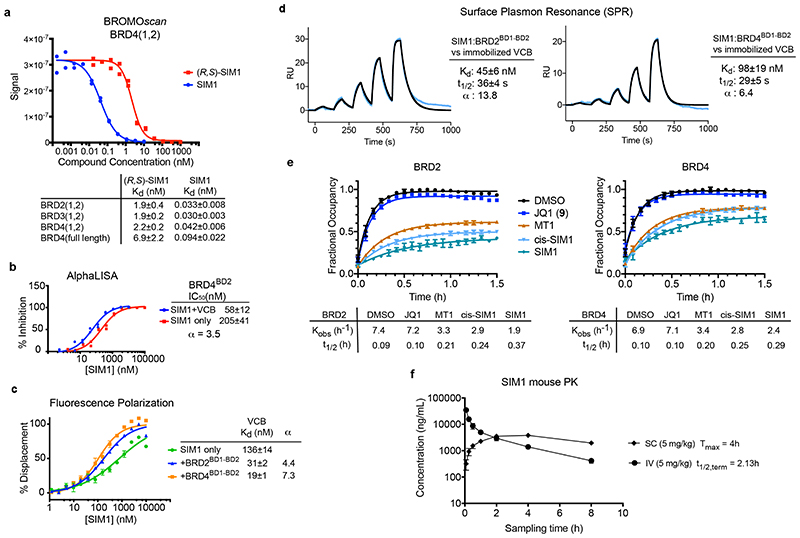
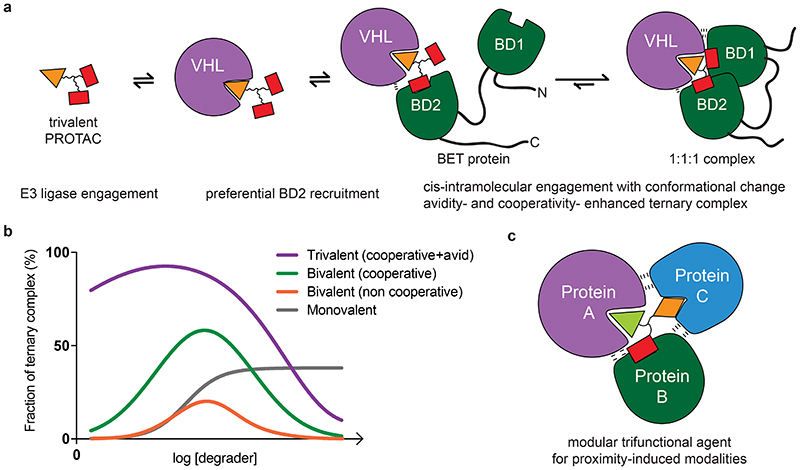
Bivalent proteolysis-targeting chimeras (PROTACs) drive protein degradation by simultaneously binding a target protein and an E3 ligase and forming a productive ternary complex. We hypothesized that increasing binding valency within a PROTAC could enhance degradation. Here, we designed trivalent PROTACs consisting of a bivalent bromo and extra terminal (BET) inhibitor and an E3 ligand tethered via a branched linker. We identified von Hippel-Lindau (VHL)-based SIM1 as a low picomolar BET degrader with preference for bromodomain containing 2 (BRD2). Compared to bivalent PROTACs, SIM1 showed more sustained and higher degradation efficacy, which led to more potent anticancer activity. Mechanistically, SIM1 simultaneously engages with high avidity both BET bromodomains in a cis intramolecular fashion and forms a 1:1:1 ternary complex with VHL, exhibiting positive cooperativity and high cellular stability with prolonged residence time. Collectively, our data along with favorable in vivo pharmacokinetics demonstrate that augmenting the binding valency of proximity-induced modalities can be an enabling strategy for advancing functional outcomes.


Conflict of interest statement

Competing Interests

The authors declare the following competing financial interest(s): The Ciulli laboratory receives or has received sponsored research support from Almirall, Amphista therapeutics, Boehringer Ingelheim, Eisai, Nurix therapeutics, and Ono Pharmaceuticals. A.C. is a scientific founder, shareholder, and consultant of Amphista therapeutics, a company that is developing targeted protein degradation therapeutic platforms. Promega Corporation is the commercial owner by assignment of patents of the HaloTag, NanoLuc, NanoBRET target engagement, and HiBiT technologies and their applications and K.M.R., S.D.M., N.M. (Nancy Murphy), M.U., and D.L.D. are employees of Promega Corporation. S.I. is an employee of Ono Pharmaceutical. S.H. and A.T. are employees of Amphista therapeutics. K.C. is an employee of GlaxoSmithKline.

Figures

None
Graphical abstract
Extended Data Fig. 1
Extended Data Fig. 2
Extended Data Fig. 3
Extended Data Fig. 4
Extended Data Fig. 5
Extended Data Fig. 6
Extended Data Fig. 7
Extended Data Fig. 8
Figure 1
Figure 1. Structure-inspired design of trivalent PROTACs identifies VHL-based SIM1 as the most potent BET degrader.
a,b) Inspection of ternary complex crystal structures of VHL:MZ1:BRD4BD2 (a, PDB:5T35) and BRD4BD2:MT1:BRD4BD2 (b, PDB 5JWM) guided the identification of solvent-exposed region for chemical branching of linkers in trivalent PROTAC design. Chemical structures of parent bivalent molecules MZ1 and MT1 are shown. c) Chemical structures of designed trivalent PROTACs SIM1-6 based on VHL and CRBN E3 ligase ligands. d) Immunoblot analysis of BRD2, BRD3, BRD4 after treatment of HEK293 cells with 1μM PROTACs or DMSO for 4h, performed as n=1. Full blots are supplied as Source Data Fig. 1. e) Protein levels of BRD2, BRD3, BRD4 in HEK293 cells treated with serially diluted PROTACs SIM1-SIM3 for 4h. Quantification of BET protein levels was done relative to DMSO control and shown plots used to measure the tabulated DC50 values. Corresponding blots are in Extended Data Fig. 1c, and full blots are supplied as Source Data Fig. 1. f) Cell viability of MV4;11 AML cell line following treatment with PROTACs or DMSO for 48h in three replicates for each concentration point. g) Chemical structures of SIM1 and its designed negative controls, (R,S)-SIM1 and cis-SIM1. Reversed stereocenters are indicated by asterisks. h) Immunoblot of degradation of BET proteins in HEK293 cells after treatment with indicated compounds at 1μM or DMSO for 4h. Full blots are supplied as Source Data Fig. 1. i) CRISPR HiBiT-BRD2, BRD3, and BRD4 HEK293 cells were treated with 100nM of DMSO, MZ1, (R,S)-SIM1, and both 10nM and 100nM of SIM1 in replicate plates for washout experiments. Media containing the 10nM and/or 100nM compounds was removed at 3.5h, indicated on the graphs, and replaced with media lacking compounds for the remainder of the experiment. Luminescence (RLU) was continuously monitored over a 50h time period and is plotted normalized to the DMSO control as Fractional RLU.
Figure 2
Figure 2. Quantitative degradation, ubiquitination and mass spectrometry analyses reveals SIM1 has preference for BRD2.
a) Quantitative live-cell degradation kinetics of CRISPR HiBiT-BRD2, BRD3, and BRD4 HEK293 cells following treatment with DMSO and a 3-fold serial dilution of SIM1 over concentration range of 10pM-10nM (left) or 40nM-30μM (right). Luminescence (RLU) was continuously monitored over a 22h time period and is plotted normalized to the DMSO control as Fractional RLU. Data are presented as mean values with error bars representing the SD of technical quadruplicates. b) Plots of degradation rate and % Degradation or degradation maximum (Dmax) versus concentration of SIM1 from BRD2, BRD3, and BRD4 kinetic profiles shown in (a, left) and resulting degradation rate plateau, λmax, and Dmax50 values from each graph are shown below. Plots of initial degradation rate versus concentration of SIM1 (40nM-30μM) for BRD2, BRD3, and BRD4 are in Extended Data Fig. 2a. c) Comparison plots of BRD2 degradation rate and degradation maximum (Dmax) versus concentration calculated from kinetic graphs of SIM1 (Fig. 2a, left) ARV-771, (Extended Data Fig. 2b), and the previously determined MZ1. Resulting degradation rate plateau, λmax, and Dmax50 values from each graph are shown below. d) NanoBRET live cell ubiquitination kinetics of HiBiT-BET HEK293 cells expressing LgBiT and HaloTag-Ubiquitin following 10nM SIM1 treatment (BRD2,3,4, left) or 100nM SIM1 or MZ1 (BRD2, right). Kinetic ubiquitination profiles for 100nM SIM1 and MZ1 treatment of BRD3 and 4 are shown in Extended Data Fig. 2d. Values are expressed as fold increase over DMSO control, and error bars reflect a mean ± s.d. from quadruplicates. e) Effects of SIM1 (blue) and cis-SIM1 (red) on the proteome of MV4;11 cells treated with compound at 10nM for 4 h. Data plotted log2 of the normalized fold change in abundance against –log10 of the P value per protein from three independent experiments. All t-tests performed were two-tailed assuming equal variances. Quantification of representative proteins can be found in Extended Data Fig. 2e. Further details are in the associated Supplementary Data Set 1.
Figure 3
Figure 3. Potent SIM1 results in more efficacious apoptosis-induced cytotoxicity in BET-sensitive cancer cell lines.
a) Loss in CRISPR cMyc-HiBiT protein levels and correlative cell viability in MV4;11 cells treated with 1nM concentration of the indicated compounds. Luminescence and cell viability by CellTiter-Glo were measured at various time points over 24h. Data are presented as mean values with error bars representing the SD of technical quadruplicates. b) Quantified expression levels of endogenous BRD2 and Myc in 22Rv1 prostate cancer cell line treated with compounds for 4h. Curves are a best fit of means from two biologically independent experiments. Corresponding blots are in Extended Data Fig. 3b, and full blots are supplied as Source Extended Data Fig. 3. c) Survival of 22Rv1 cells in clonogenic assay. Cells were treated with 10nM compounds for 24h. Five hundred cells were re-plated and allowed to grow at 37°C for 20 days before scanning. Survival fraction was determined by dividing plating efficiency of treated cells by plating efficiency of untreated cells. d) Immunoblot of PARP-cleavage in 22Rv1 cells with indicated compounds at 10nM for 24h with or without the addition of caspase inhibitor (QVD-OPh, 20μM) or necroptosis inhibitor (Necrostatin-1, 20μM). Blots for 48h treatments and 1μM MZ1 and MT1 treatments are in Extended Data Fig. 4a-b. Full blots are supplied as Source Data Fig. 3. e) Caspase-Glo 3/7 assays treated with compounds or DMSO for 24h in 22Rv1 cells. Curves are a best fit of means from three biologically independent experiments, ±s.e.m. f) Percentage of early (FITC: Apotracker Green) and late (FITC: Apotracker Green and DAPI) apoptotic and healthy MV4;11 cells after treatment with test compounds at the indicated concentrations for 24h, as analysed by Apotracker Green and DAPI staining for viability and surface presence of phosphatidyl serine, respectively, and flow cytometry analysis. Data are plotted as stacked bars so single dots are not shown. Error bars reflect a mean ± s.d. of three biological replicates. Representative data for DMSO, SIM1 1nM and 10nM are shown (top), displayed as raw dot-plot analysed by FlowJo. Raw plots for all representative treatments are in Extended Data Fig. 5.
Figure 4
Figure 4. SIM1 induces a conformation change in BRD4 intramolecularly engaging its BD1 and BD2 to form a 1:1:1 ternary complex with VHL.
a) Size exclusion chromatography of complex formation after incubation of SIM1 (red), MZ1 or cis-SIM1 (orange), MT1 (green) or DMSO (cyan) with BD1-BD2 tandem domain from BRD4 (left panel: wild type, middle panel: N140F mutant, right panel: wild type with VCB protein). Intensity of peaks is absorbance at 280 nm. b) NanoBRET conformational biosensor assay consisting of either the BD1-BD2 tandem domain of BRD4 wild-type (WT) or containing the BD2 N433F mutation flanked by NanoLuc donor and HaloTag acceptor fusion tags. HEK293 cells were transiently transfected with either the WT or N433F mutant biosensor and treated with a serial dilution of SIM1, cis-SIM1, or MT1 compounds. NanoBRET was measured to determine a change in tag proximity indicative of a conformational change. Data are presented as mean values with error bars representing the SD of technical quadruplicates. For treatments which showed a conformational change, EC50 values were calculated and are shown. c) NanoBRET target engagement assays of HEK293 cells transiently transfected with the VHL-NanoLuc fusion in permeabilized and live cell formats. Cells were treated with a fluorescent VHL tracer then incubated with the indicated compounds across the indicated concentration range to measure competitive displacement. Fractional occupancy is plotted against concentration and from these graphs, IC50 values for each compound are shown for both permeabilized and live cells. Data are presented as mean values with error bars representing the SD of technical triplicates. d) ITC titrations of BRD4 BD1-BD2 tandem proteins (loaded in the syringe, N-to-F mutants at 300μM, WT 200μM) into a 1:1 mixture of SIM1 (16μM) and VCB (32μM) pre-incubated into the sample cell. Binding parameters from data fit are shown for each titration. The high binding affinity to WT was not resolvable due to competing equilibria during the titration. e) NanoBRET kinetic ternary complex formation in HEK293 cells transiently expressing HaloTag-VHL paired with either full-length BRD4 WT, N140F or N433F mutants treated with SIM1, cis-SIM1, MT1 or DMSO control. NanoBRET was continuously monitored for 2h after compound addition and showed differential levels of ternary complex formation for each BRD4 variant. Data are presented as mean values with error bars representing the SD of technical quadruplicates.
Figure 5
Figure 5. SIM1 forms cooperative stable ternary complexes with enhanced cellular residence time and shows favourable pharmacokinetic profile in mice
BROMOscan displacement titrations by SIM1 and (R,S)-SIM1 from BRD4(1,2). The amount of bromodomain protein measured by qPCR (Signal; y-axis) is plotted against the corresponding compound concentration in log10 scale (nM, x-axis). Dissociation constants Kd from curve fitting are tabulated. Error values are generated by the GraphPad Prism program and reflect the quality of the fit between the nonlinear least-squares curve and the experimental data. b) AlphaLISA titrations of SIM1 in duplicates against biotin-JQ1:BRD4BD2 in the absence (red) or presence (blue) of VCB protein. IC50 values from curve fitting are tabulated, together with the resulting cooperativity α. Error values are generated by the GraphPad Prism program and reflect the quality of the fit between the nonlinear least-squares curve and the experimental data. c) Fitted curves from FP competition assays measuring displacement of a FAM-labelled HIF-1α peptide from VCB by SIM1 titrated in triplicates, in the presence or absence of tandem BD1-BD2 proteins from BRD2 or BRD4. Kd values from curve fitting are tabulated, together with the resulting cooperativity α. d) SPR sensograms to monitor in real-time the interaction of binary complexes SIM1:BRD2(1,2) and SIM1:BRD4(1,2) with immobilized biotin-VCB protein. Sensorgrams shown are for a ternary single-cycle kinetic (SCK) experiments as representative to at least three independent experiments. Values shown are mean ± s.d. from the data fitting of each replicate. Cooperativity α is calculated using dissociation constant K d of SIM1 binary binding to VCB (Extended Data Fig. 7a). Multiple-cycle kinetic (MCK) ternary data are also shown in Extended Data Fig. 7a. e) Live cell kinetic residence time experiments with BRD2 and BRD4 as measured by NanoBRET target engagement. CRISPR HiBiT-BRD2 or HiBiT-BRD4 cells were incubated with each of the indicated compounds at their pre-determined EC80 values (listed in Methods) followed by addition of a competitive fluorescently-labeled BET tracer. NanoBRET was measured and is plotted as fractional occupancy over time. From these graphs, residence time rates (Kobs (h-1) and half-life (t½ (h)) were determined. Data are presented as mean values with error bars representing the SD of technical triplicates. f) SIM1 exhibits excellent availability and pharmacokinetics exposure in vivo. Mean plasma concentration-time profiles of SIM1 after single intravenous (IV) or subcutaneous (SC) administration (5 mg/kg) to male C57BL/6 mice (n =3) are shown. Further details are in the associated Supplementary Table 2 and Supplementary Data Set 2.
Figure 6
Figure 6. Models of trivalent ternary complex formations and advantages over monovalent and bivalent compounds.
a) Proposed mechanism for the formation of a 1:1:1 ternary complex between trivalent PROTAC, VHL and BET protein. Preferential initial binding of the PROTAC to BD2 of BRD4 is followed by conformational change and bidentate binding to BD1. Avidity and cooperativity contribute to formation of a highly stable ternary complex with enhanced residence time at extraordinarily low concentrations of SIM1. b) Shown are different types of degrader-induced ternary complexes, depicted at their varying extents as a function of degrader concentration. A trivalent complex combining avidity with cooperativity shows the highest and most sustained levels of ternary complex formation, with a minimized hook effect. A cooperative bivalent PROTAC complex is next, followed by a non-cooperative bivalent complex. Lastly, the ternary complex induced by molecular glue compounds is shown, which reaches a plateau and unlike PROTACs are not predicted to experience the competitive hook effect at higher concentrations. c) A general model for trifunctional compound-induced ternary complex utilizing a compound with three different warheads (or ligands) to recruit together three distinct protein.

References

    1. Deshaies RJ. Multispecific drugs herald a new era of biopharmaceutical innovation. Nature. 2020;580:329–338. - PubMed
    1. Che Y, Gilbert AM, Shanmugasundaram V, Noe MC. Inducing protein-protein interactions with molecular glues. Bioorg Med Chem Lett. 2018;28:2585–2592. - PubMed
    1. Maniaci C, Ciulli A. Bifunctional chemical probes inducing protein-protein interactions. Curr Opin Chem Biol. 2019;52:145–156. - PubMed
    1. Pettersson M, Crews CM. PROteolysis TArgeting Chimeras (PROTACs) - Past, present and future. Drug Discovery Today: Technologies. 2019;31:15–27. - PMC - PubMed
    1. Zengerle M, Chan K-H, Ciulli A. Selective Small Molecule Induced Degradation of the BET Bromodomain Protein BRD4. ACS Chem Biol. 2015;10:1770–1777. - PMC - PubMed

Publication types

Substances