. 2021 Nov;24(11):1522-1533.
doi: 10.1038/s41593-021-00926-1. Epub 2021 Oct 21.

The SARS-CoV-2 main protease Mpro causes microvascular brain pathology by cleaving NEMO in brain endothelial cells

Affiliations

The SARS-CoV-2 main protease Mpro causes microvascular brain pathology by cleaving NEMO in brain endothelial cells

Jan Wenzel et al. Nat Neurosci. 2021 Nov.

Abstract

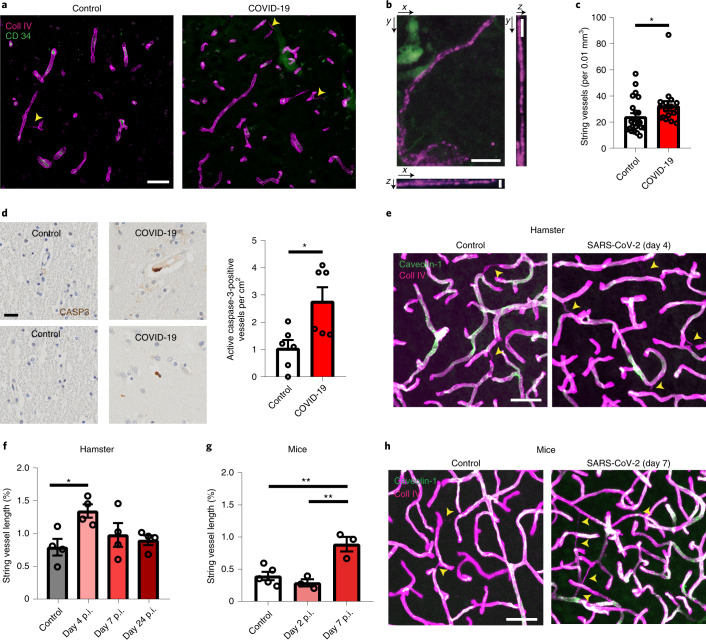
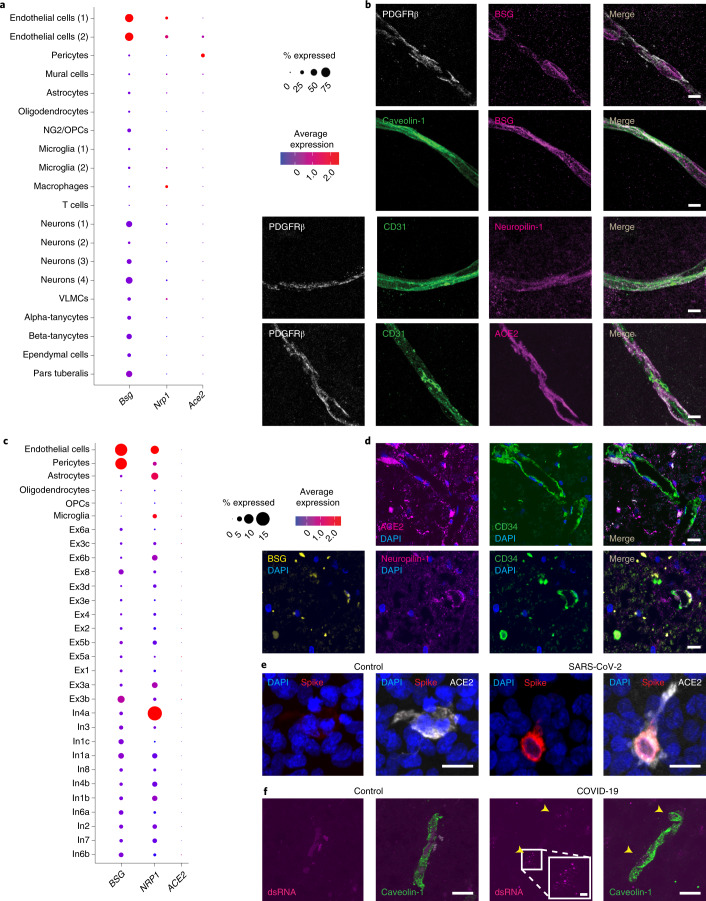
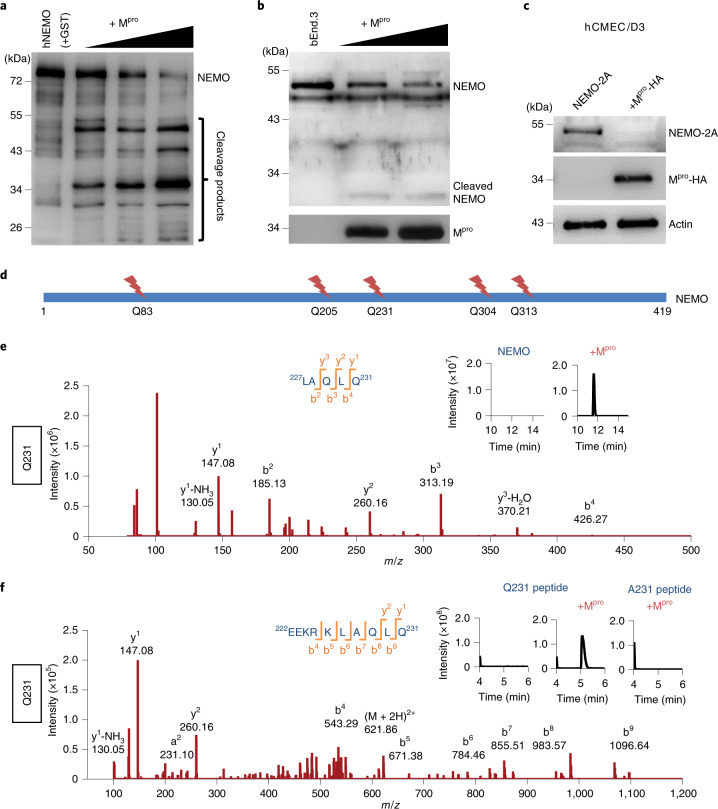
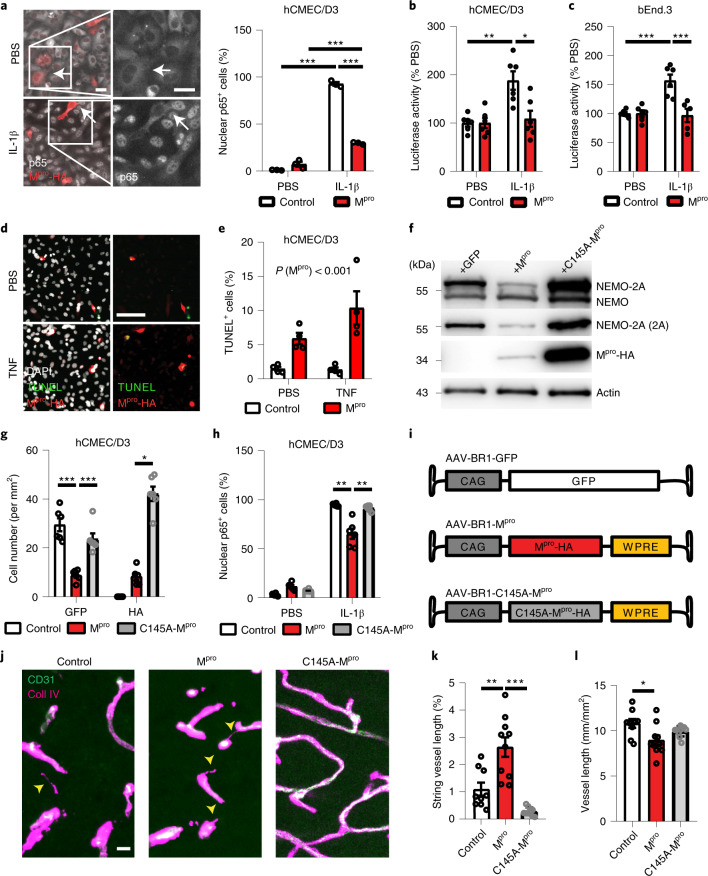
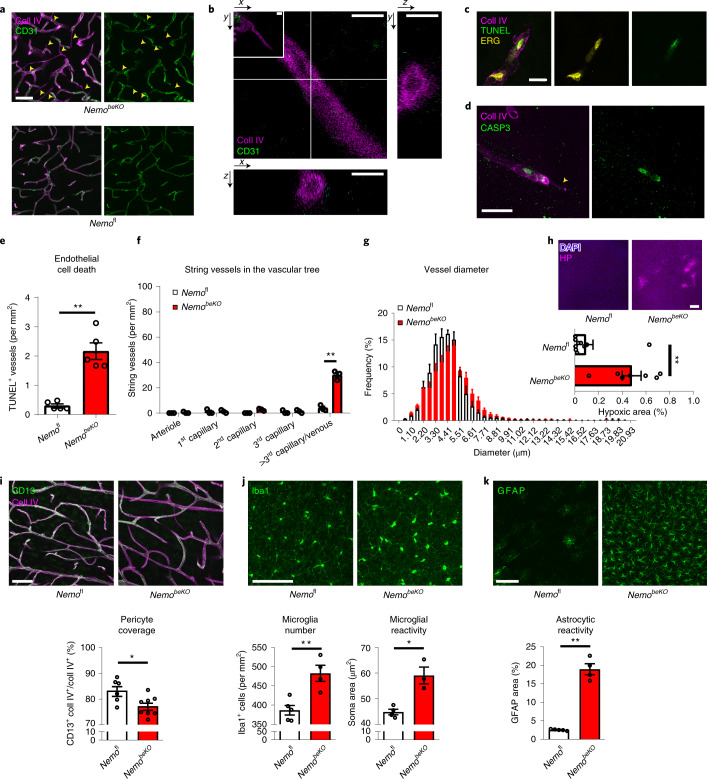
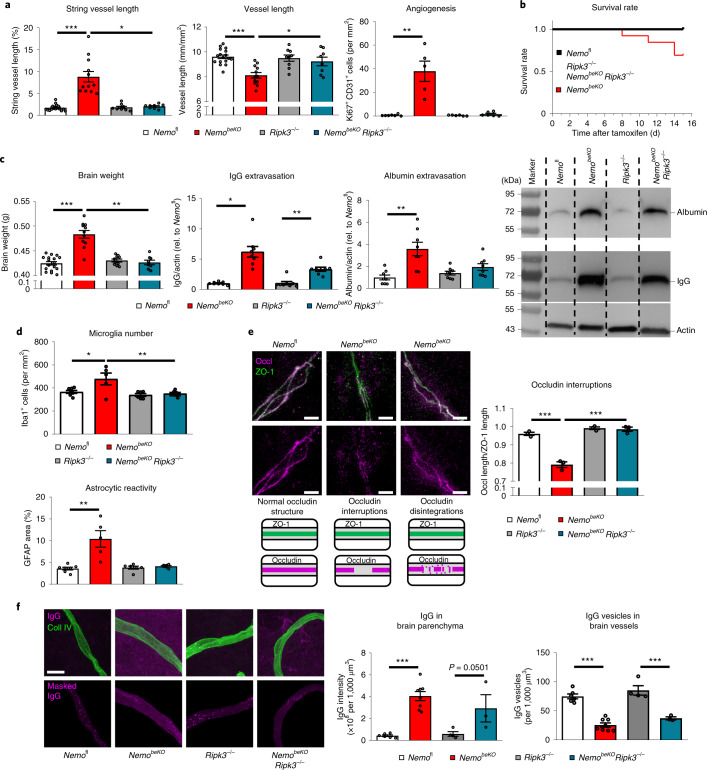
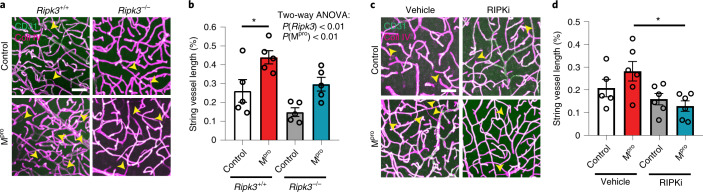
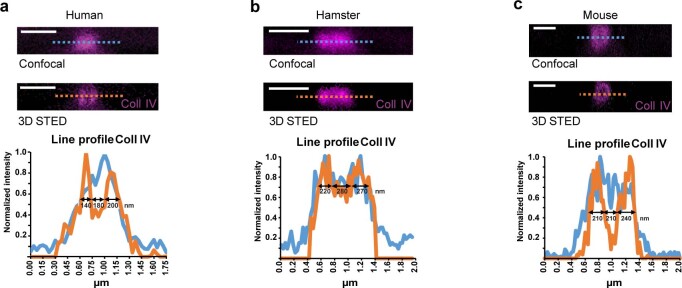
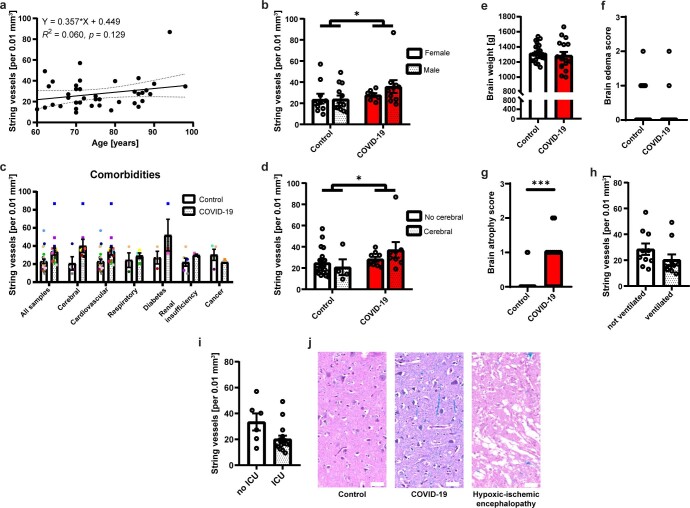
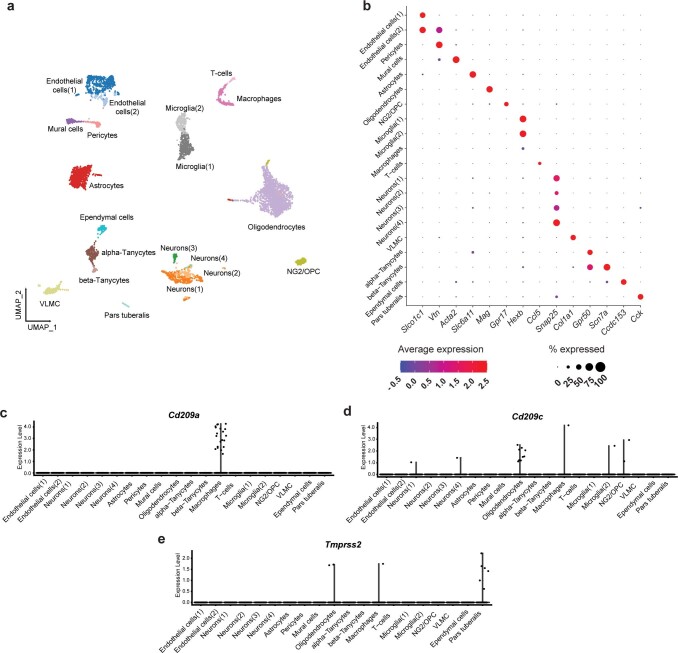
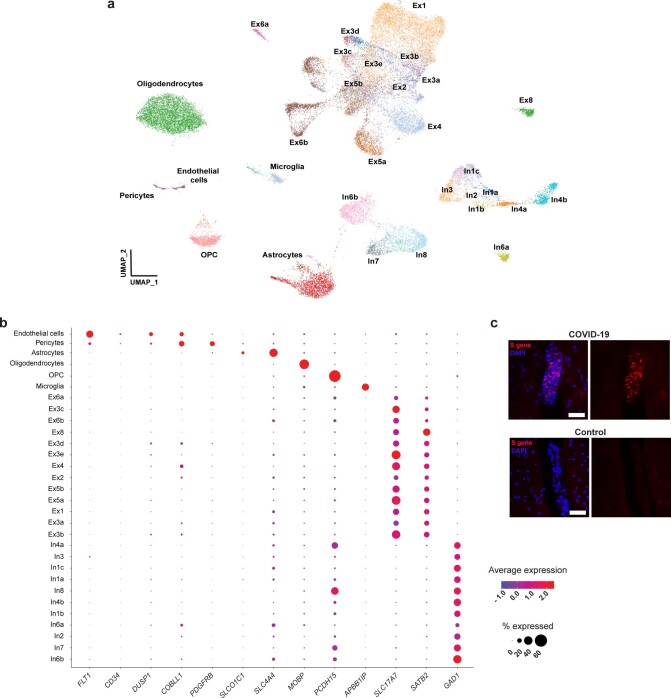
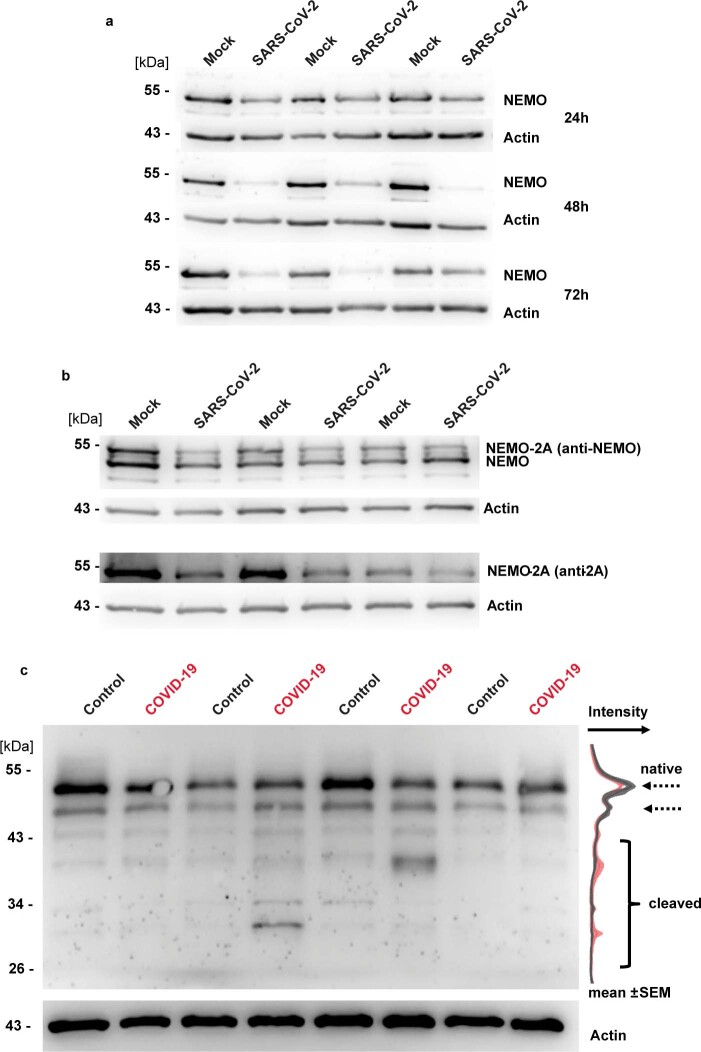
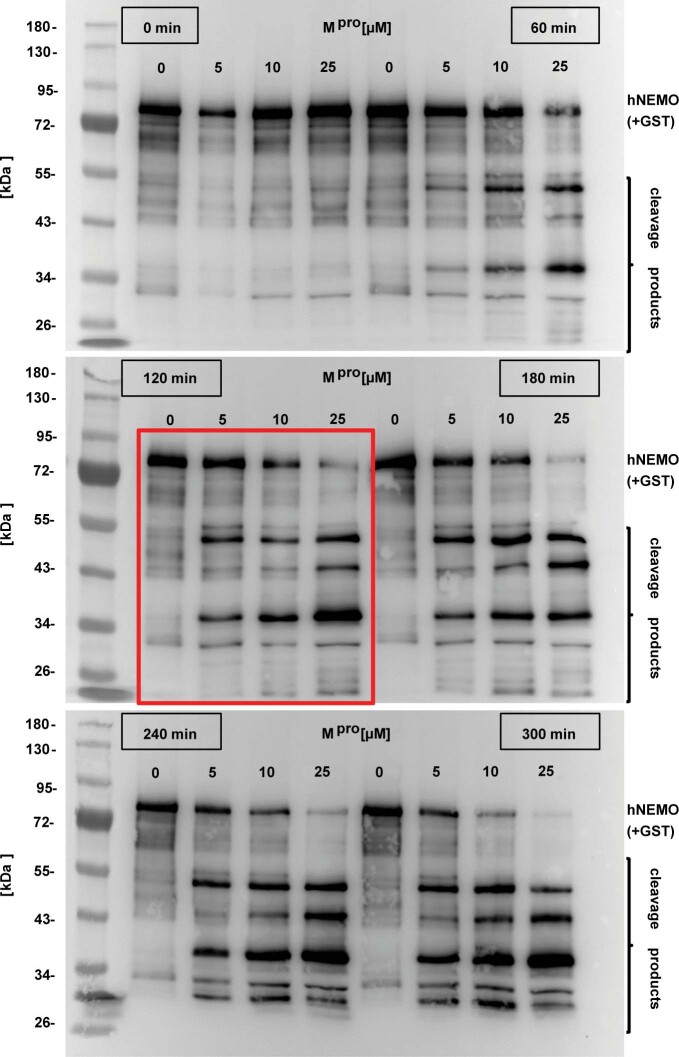
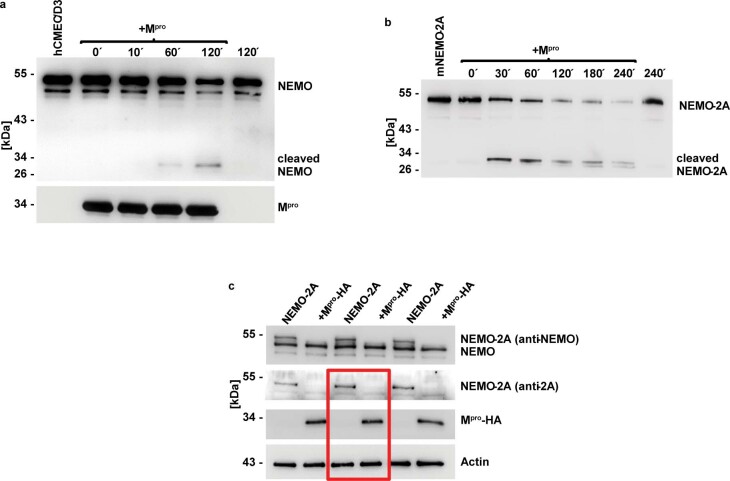
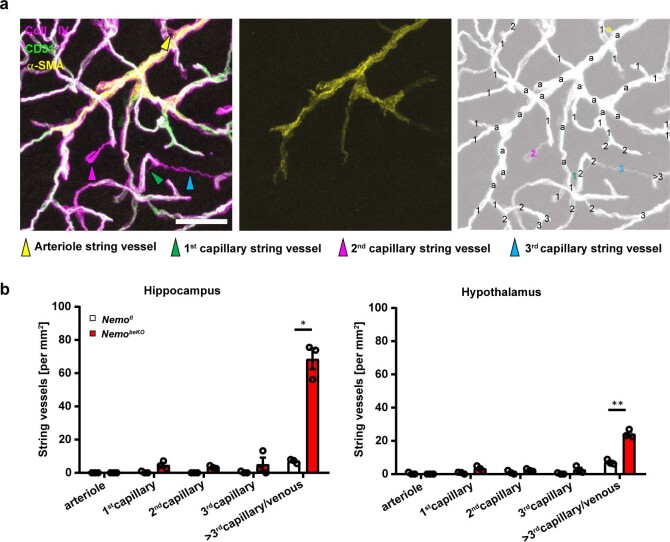
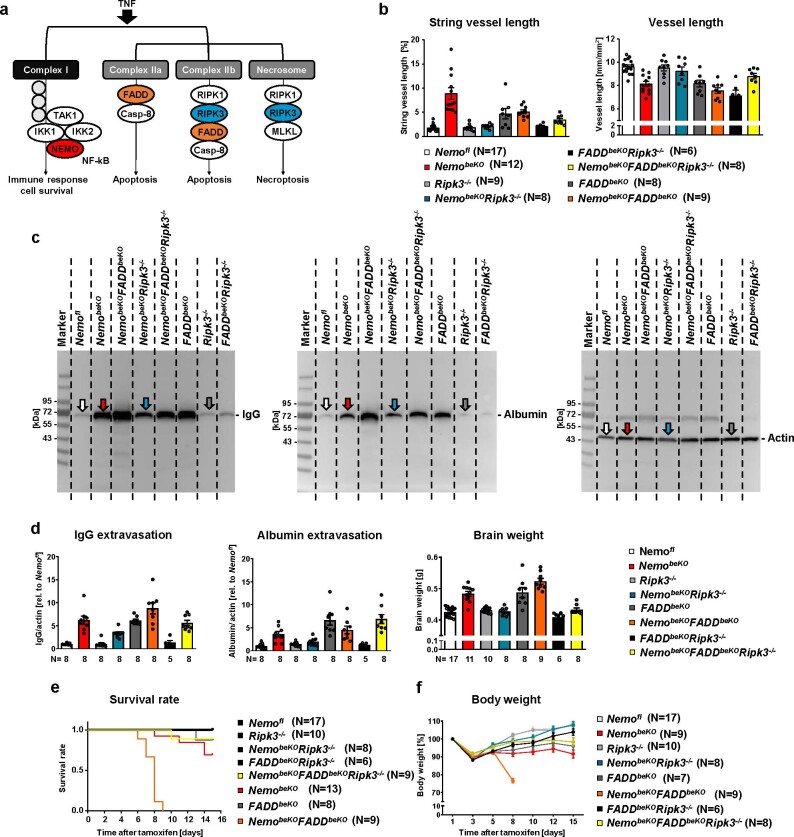
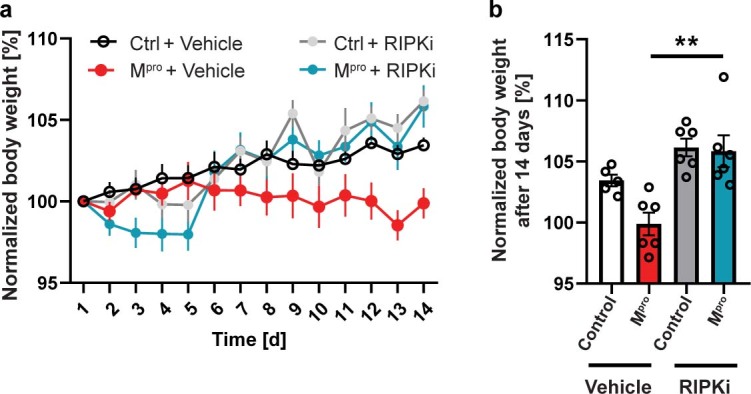
Coronavirus disease 2019 (COVID-19) can damage cerebral small vessels and cause neurological symptoms. Here we describe structural changes in cerebral small vessels of patients with COVID-19 and elucidate potential mechanisms underlying the vascular pathology. In brains of severe acute respiratory syndrome coronavirus 2 (SARS-CoV-2)-infected individuals and animal models, we found an increased number of empty basement membrane tubes, so-called string vessels representing remnants of lost capillaries. We obtained evidence that brain endothelial cells are infected and that the main protease of SARS-CoV-2 (Mpro) cleaves NEMO, the essential modulator of nuclear factor-κB. By ablating NEMO, Mpro induces the death of human brain endothelial cells and the occurrence of string vessels in mice. Deletion of receptor-interacting protein kinase (RIPK) 3, a mediator of regulated cell death, blocks the vessel rarefaction and disruption of the blood-brain barrier due to NEMO ablation. Importantly, a pharmacological inhibitor of RIPK signaling prevented the Mpro-induced microvascular pathology. Our data suggest RIPK as a potential therapeutic target to treat the neuropathology of COVID-19.


Conflict of interest statement

L.C. and R.V. are under paid employment by Hoffman La Roche. M. Zelic and D.O. are under paid employment by Sanofi. M.K. worked as a part-time consultant of Immungenetics AG. All other authors declare no competing interests.

Figures

Fig. 1
Fig. 1. SARS-CoV-2 infection is associated with increased string vessels in the brain.
ac, In the brains of SARS-CoV-2-infected patients, empty basement membrane tubes, also known as string vessels (arrowheads), were increased in the frontal cortex. Sections were stained for the basement membrane marker collagen IV (coll IV) and the endothelial marker CD34. Representative images in a and b were obtained from the dataset in c. a, Scale bar, 50 μm. b, Magnified maximal projection of a z-stack of a string vessel with orthogonal views to exclude that these are partial sections of capillaries. Scale bars, 3 μm. c, Quantification of string vessels per image volume. N = 23 control patients, N = 17 COVID-19 patients. d, Immunostaining revealed a higher number of active caspase-3-positive vessels in cortical sections of SARS-CoV-2-infected patients (N = 6) than in controls (N = 6). Representative images and quantification are shown. Scale bar, 20 µm. e,f, SARS-CoV-2-infected hamsters developed an increased number of string vessels as shown by co-staining for coll IV and the endothelial marker caveolin-1. e, Representative images of coll IV and caveolin-1 in the cortex of hamsters 4 d post infection (p.i.) with SARS-CoV-2 and of uninfected hamsters. Scale bar, 50 µm. f, Quantification of string vessel lengths as a percentage of total vessel length in SARS-CoV-2-infected hamsters at 4, 7 and 24 d p.i. and in uninfected controls (N = 4 hamsters per group). g,h, SARS-CoV-2-infected K18-hACE2 mice developed an increase in string vessels as shown by co-staining for coll IV and caveolin-1. g, Quantification of string vessel lengths as a percentage of total vessel length in SARS-CoV-2-infected K18-hACE2 mice 2 d p.i. (N = 3 mice) and 7 d p.i. (N = 3 mice) and in uninfected controls (N = 5 mice). h, Representative images of coll IV and caveolin-1 in the cortex of K18-hACE2 mice 7 d p.i. and of uninfected K18-hACE2 animals. Scale bar, 50 µm. *P < 0.05, **P < 0.01. Means ± s.e.m. are shown. N denotes the number of patients or animals. Detailed information on the exact test statistics, sidedness and values is provided in Supplementary Table 5.
Fig. 2
Fig. 2. Brain endothelial cells express SARS-CoV-2 receptors in mice and humans.
a, RNA-seq in single mouse brain cells characterized the cell-type-specific expression of the SARS-CoV-2 receptors Ace2, Bsg and Nrp1. Colors represent mean gene expression, and diameters denote the percentage of positive cells in the 20 cell clusters. Uniform manifold approximation and projection (UMAP) plot and dot plot for marker genes are shown in Extended Data Fig. 3. b, Representative images of mouse brain co-stained for ACE2, BSG, NRP1, the endothelial markers CD31 or caveolin-1 and the pericyte marker PDGFRβ. BSG and NRP1 were co-localized with caveolin-1 or CD31, respectively, but not with PDGFRβ. The staining was reproduced in at least six mice for each marker. Noteworthy, in the scRNA-seq analysis, the number of Ace2 mRNA-positive cells was low and did not fully reflect the number of ACE2-positive cells identified by immunostainings. In immunostainings, almost all pericytes and tanycytes were positive for ACE2, in contrast to the scRNA-seq data. Scale bars, 5 µm. VLMCs, vascular and leptomeningeal cells; OPCs, oligodendrocyte progenitor cells. c, Cell-type-specific expression of ACE2, BSG and NRP1 in a previously published single nuclear RNA-seq profile of human brain. Gene expression of ACE2, BSG and NRP1 is shown as dot plots for all 30 clusters. UMAP plot and dot plot for marker genes is shown in Extended Data Fig. 4. d, Representative images of the human frontal cortex co-stained for ACE2, BSG and NRP1 with the endothelial marker CD34 confirmed the cell-type-specific localization of the receptors in the vascular unit. ACE2, BSG and NRP 1 were co-localized with the endothelial protein CD34. Images were obtained from a dataset of three patients (three sections per patient). Scale bars, 5 µm. e, Human brain endothelial hCMEC/D3 cells were transfected with human ACE2 and were incubated with SARS-CoV-2 (multiplicity of infection (MOI) of 1). Twenty-four hours after exposure to the virus, the spike glycoprotein was detected in several ACE2-positive cells indicating infection. The experiment was performed three times. Scale bars, 5 µm. f, dsRNA was found in caveolin-1-positive endothelial cells in the cortex of two of four patients with COVID-19 but not in three uninfected controls. Scale bar, 20 µm and 2 µm (inset).
Fig. 3
Fig. 3. Mpro cleaves NEMO.
a, SARS-CoV-2 Mpro in increasing concentrations (0, 5, 10 and 25 µM; 120 min) degraded full-length human NEMO (fused to GST) while several cleavage products emerged (representative of at least six experiments at different conditions). The full immunoblots are shown in Extended Data Fig. 6. b, Mouse NEMO in bEnd.3 cell extracts was cleaved to a short fragment after incubation with increasing concentrations of Mpro (0, 5 and 10 µM) for 120 min (representative of three experiments). c, In human brain endothelial hCMEC/D3 cells, Mpro-HA degraded NEMO-2A. After transfecting the cells with pCAG-NEMO-2A-GFP ± pCAG-Mpro-HA, immunoblots of cell lysates were performed (representative of at least nine experiments). d, Tryptic digestion and tandem mass spectrometry (MS/MS) analysis identified five Mpro cleavage sites in human NEMO as illustrated in the schematic. For the protein sequence, see Supplementary Fig. 2k. e, Mpro cleaved human NEMO at Q231. An extracted ion chromatogram of the tryptic peptide 227LAQLQ231 (m/z, 572.34142+; retention time (RT), 11.6 min) derived from NEMO after incubation with Mpro (5 µM, inset) and the MS/MS spectrum that was used for peptide identification are shown. The experiment was performed once. f, A synthetic peptide corresponding to the human NEMO sequence confirmed that Q231 is an Mpro cleavage site. Total ion chromatograms after incubation of the synthetic peptide h-NEMO_222-241 (EEKRKLAQLQVAYHQLFQEY) in the presence or absence of Mpro (2.5 µM, inset) are shown. In the presence of Mpro, the proteolysis product 222EEKRKLAQLQ231 (m/z, 414.91093+; RT, 5.1 min) was detected. The mutant peptide h-NEMO-Q231A_222-241 (EEKRKLAQLAVAYHQLFQEY) was not cleaved by Mpro (inset). The MS/MS spectrum of the peptide 222EEKRKLAQLQ231 is shown (representative of five experiments with the synthetic peptide h-NEMO_222-241 and four experiments with the mutant peptide h-NEMO-Q231A_222-241). Source data
Fig. 4
Fig. 4. Mpro inactivates NEMO and induces brain endothelial cell loss mimicking COVID-19-associated brain pathology.
a, Mpro-HA inhibited the nuclear translocation of the NF-κB subunit p65 in hCMEC/D3 cells stimulated with IL-1β (0.25 µg ml−1) for 30 min. Cells (N = 3 wells per group; representative of three independent experiments) were transfected with a control plasmid (Bluescript) or pCAG-Mpro-HA. Scale bar, 25 µm. b,c, Mpro-HA blocked the activation of NF-κB by IL-1β (0.25 µg ml−1) in human (b) and mouse (c) brain endothelial cells. Cells were transfected with pNF-κB-Luc plus a control plasmid or pCAG-Mpro-HA. N = 5–6 wells per group. d,e, Mpro-HA induced death of hCMEC/D3 cells, especially after exposure to TNF (100 ng ml−1; 4.5 h). Cells (N = 12 wells per group) were transfected with a control plasmid or pCAG-Mpro-HA. Scale bar, 100 µm. f, In hCMEC/D3 cells, Mpro degraded NEMO-2A, whereas the inactive variant p.Cys145Ala-Mpro did not. After transfecting the cells with pCAG-NEMO-2A-GFP plus pCAG-GFP as control, pCAG-Mpro-HA or pCAG-p.Cys145Ala-Mpro-HA, immunoblots of cell lysates were performed (representative of at least six experiments). g, More hCMEC/D3 cells survived after expressing the inactive variant p.Cys145Ala-Mpro-HA than after expressing Mpro-HA. All cells were transfected with pCAG-GFP in parallel. The numbers of GFP+ or HA+ cells are depicted (N = 6 wells per group). h, In contrast to Mpro, p.Cys145Ala-Mpro did not inhibit the nuclear translocation of the NF-κB subunit p65 when hCMEC/D3 cells were stimulated with IL-1β (0.25 µg ml−1) for 30 min. Cells were transfected with control plasmid, pCAG-Mpro-HA or pCAG-p.Cys145Ala-Mpro-HA (N = 6 wells per group). i, Schematic of AAV-BR1 vectors to transduce brain endothelial cells in vivo. WPRE, woodchuck hepatitis posttranscriptional regulatory element. j, AAV-BR1-Mpro but not AAV-BR1-p.Cys145Ala-Mpro led to the formation of string vessels (arrowheads) in the brain of mice. Representative images were taken in the cortex. Scale bar, 20 µm. k, Quantification of string vessel length as a percentage of total vessel length (N = 9–10 mice per group). l, Total vessel length was reduced after mice received AAV-BR1-Mpro but not AAV-BR1-p.Cys145Ala-Mpro (N = 9–10 mice per group). *P < 0.05, **P < 0.01, ***P < 0.001. Means ± s.e.m. are shown. Detailed information on the exact test statistics, sidedness and values is provided in Supplementary Table 5. Source data
Fig. 5
Fig. 5. Brain endothelial loss of NEMO induces string vessel formation and influences the neurovascular unit.
a, Cerebral microvasculature of NemobeKO mice deficient of NEMO in brain endothelial cells and Nemofl controls. Arrowheads indicate string vessels. Confocal images are representative of five Nemofl and five NemobeKO mice (six sections per animal) 28 d after tamoxifen treatment. Scale bar, 50 µm. b, STED microscopy showed that string vessels are thin tubes with a typical diameter of 0.5–1 µm. The image is representative of three NemobeKO mice. Scale bars, 1 µm. c,d, String vessels (arrowhead) were often adjacent to dying, TUNEL+ or active caspase-3+ endothelial cells in NemobeKO mice. ERG co-staining indicated TUNEL+ nuclei in the endothelium. Representative images in c were obtained from the dataset in e. Images in d are representative of two NemobeKO mice. Scale bar, 20 µm. e, Increased numbers of TUNEL+ cells localized in collagen IV-stained microvessels of NemobeKO mice (N = 5 mice per genotype). f, More string vessels were present in higher branch orders of the vascular tree in the cortices of NemobeKO mice (N = 3 mice per genotype). Branch orders were defined by α-SMA staining of arterioles (Extended Data Fig. 8a). g, NemobeKO mice (N = 3 mice per genotype) preferentially lost vessels with small diameters. The diameters of collagen IV+ vessels are shown as a histogram. h, NemobeKO mice (N = 7) demonstrated patchy cerebral hypoxia detected by the hypoxia probe (HP) in contrast to Nemofl controls (N = 10). i, Pericyte coverage of vessels was reduced in NemobeKO mice (N = 8) compared to Nemofl controls (N = 6). Scale bar, 50 µm. j, NemobeKO mice (N = 3–4) showed an increased number of activated microglia cells as shown by increased Iba1+ soma area in comparison to that of Nemofl controls (N = 4–5). Scale bar, 100 µm. k, NemobeKO mice (N = 4) demonstrated astrogliosis as shown by an increased GFAP+ area in the cortex compared to that of Nemofl controls (N = 5). Scale bar, 100 µm. *P < 0.05, **P < 0.01. Means ± s.e.m. are shown. Detailed information on the exact test statistics, sidedness and values is provided in Supplementary Table 5.
Fig. 6
Fig. 6. RIPK3 mediates microvascular pathology induced by NEMO ablation.
a, Ripk3 deletion prevented vascular pathology of NemobeKO mice, that is, string vessel formation and rarefaction of vessels (N = 17 Nemofl, 12 NemobeKO, 9 Ripk3−/− and 8 NemobeKORipk3−/− mice), as well as endothelial proliferation (Ki67+ endothelial cells; N = 7 Nemofl, 5 NemobeKO, 6 Ripk3−/− and 6 NemobeKORipk3−/− mice). b, Ripk3 deletion normalized the survival of NemobeKO animals (N = 13) that was significantly reduced in comparison to control mice (N = 17; log-rank Mantel–Cox test, P = 0.015). In contrast, all NemobeKORipk3−/− mice (N = 8) survived. c, Ripk3 deletion largely attenuated the disruption of the BBB in NemobeKO mice. Brain weight reflects brain edema (N = 17 Nemofl, 11 NemobeKO, 10 Ripk3−/− and 8 NemobeKORipk3−/− mice). IgG and albumin extravasation were determined by immunoblots of brain tissue (N = 8 mice per genotype). d, RIPK3 ablation abolished glial activation. NemobeKO but not NemobeKORipk3−/− mice showed a higher number of Iba1+ microglia/macrophages and an increased area of GFAP+ astrocytes (N = 7 Nemofl, 5 NemobeKO, 6 Ripk3−/− and 6 NemobeKORipk3−/− mice). e, Immunostainings of ZO-1 and occludin obtained by expansion microscopy in Nemofl and NemobeKO mice, representative of a dataset of three animals for each genotype. Scale bar, 10 µm (corresponding to approximately a 2.5-µm initial size). We classified tight junction structures as occludin interruptions or disintegrations shown as blurring of the occludin structure (middle). f, NemobeKORipk3−/− mice showed less IgG extravasation than NemobeKO mice and a similar decrease in the number of IgG vesicles in brain endothelial cells as NemobeKO mice. Scale bar, 10 µm. IgG extravasation was measured in IgG immunostainings as fluorescence intensity outside the vasculature normalized for parenchymal volume, and IgG vesicles were quantified inside vessels and normalized for the vessel volume (N = 6 Nemofl, 8 NemobeKO, 4 Ripk3−/− and 3 NemobeKORipk3−/− mice). *P < 0.05, **P < 0.01, ***P < 0.001. Means ± s.e.m. are shown. Detailed information on the exact test statistics, sidedness and values is provided in Supplementary Table 5. Source data
Fig. 7
Fig. 7. Inactivation of RIPK protects against Mpro-induced vascular pathology.
a,b, In Ripk3−/− mice, the Mpro-mediated increase in string vessels (arrowheads) was reduced. a, Representative images of microvessels in the cortex of Ripk3+/+ and Ripk3−/− mice, 2 weeks after intravenous application of the control vector AAV-BR1-GFP (3.3 × 1011 genome particles per mouse) or AAV-BR1-Mpro (3.3 × 1011 genome particles per mouse). Brain sections were stained for coll IV and CD31. Scale bar, 50 µm. b, Quantification of string vessel length as a percentage of total vessel length. The Mpro-induced string vessel formation in Ripk3+/+ mice was reduced in Ripk3−/− mice (N = 5 mice per genotype). c,d, In RIPK1 inhibitor (RIPKi)-treated mice, the Mpro-induced increase in string vessels was reduced. c, Representative images of microvessels in the cortex of mice, 2 weeks after intravenous application of the control vector AAV-BR1-GFP (3.3 × 1011 genome particles per mouse) or AAV-BR1-Mpro (3.3 × 1011 genome particles per mouse) and oral treatment with RIPKi or vehicle. Scale bar, 50 µm. d, Quantification of string vessel length as a percentage of total vessel length. RIPKi prevented the Mpro-induced string vessel formation (N = 5 control-vehicle, 6 Mpro-vehicle, 6 control-RIPKi and 6 Mpro-RIPKi mice). *P < 0.05; means ± s.e.m. are shown. Detailed information on the exact test statistics, sidedness and values is provided in Supplementary Table 5. ANOVA, analysis of variance.
Extended Data Fig. 1
Extended Data Fig. 1. String vessels have a tube-like structure.
a, b, c, Super-resolution imaging of human (a), hamster (b) and mouse string vessels (c). In confocal mode with the pinhole closed to 0.4 AU, the string vessels appeared as solid collagen tubes. However, STED microscopy demonstrated a tube-like structure of string vessels in humans, hamsters and mice. In all species, the apparent diameter of string vessels was about 500 – 1,000 nm with the collagen walls having a similar thickness. Images are representative for at least 3 experiments per species. Scale bar, 1 µm.
Extended Data Fig. 2
Extended Data Fig. 2. Characteristics of the COVID-19 and control patients.
a, Age did not affect the number of string vessels per volume of the image. N = 40 patients. b, String vessels were increased in SARS-CoV-2-infected patients independent of sex. N = 10 female and 13 male control, N = 7 female and 10 male COVID-19 patients. c, Comorbidities were equally distributed across control and COVID-19 patients. For characteristics of the patients, refer to Fig. 1c and Supplementary Tables 1-2. N = 23 control, N = 17 COVID-19 patients. d, String vessels were increased in SARS-CoV-2-infected patients independent of cerebral comorbidities. N = 19 control patients without and 4 with cerebral comorbidity, N = 9 COVID-19 patients without and 8 with cerebral comorbidity. e, Brain weight was not different between COVID-19 and control patients. f, Brain edema score was not different between COVID-19 and control patients. N = 23 control, N = 17 COVID-19 patients. Medians are shown. g, Brain atrophy score was increased in COVID-19 compared to control patients. N = 23 control, N = 17 COVID-19 patients. Medians are shown. h, String vessels of control patients with or without ventilation are shown. N = 10 patients per group. i, String vessels of control patients who were treated in an intensive care unit (ICU) or not are shown. N = 6 no ICU, N = 16 ICU. j, None of the COVID-19 or control patients showed evidence for a hypoxic-ischemic encephalopathy, also known as ‘respirator brain’. Characteristic morphological features of eosinophilic neurons, laminar changes in the cerebral cortex or loss of neurons were not detectible. Representative images of a combined HE and Nissl staining of brain sections from a control and COVID-19 patient as well as a brain section from a patient with hypoxic-ischemic encephalopathy are depicted. Scale bar, 50 µm. Means ± s.e.m. are shown if not stated otherwise. * p < 0.05 *** p < 0.001. Detailed information about the exact test statistics, sidedness and values are provided in Supplementary Table 5.
Extended Data Fig. 3
Extended Data Fig. 3. Clustering of mouse brain cells according to single-cell RNA sequencing.
a, UMAP plot of 5,611 mouse brain cells. Clusters were annotated according to marker genes for the specific cell types. b, Dot plots of marker genes used for annotation. Gene expression for all 20 clusters is shown as dot plot with the color representing mean gene expression and the diameters showing the percentage of positive cells in the clusters. c-e, mRNA expression patterns of the putative SARS-CoV-2 entry factors Cd209a (c), Cd209c (d), and Tmprss2 (e). There were no Cd209b- or Cd209d-expressing cells. VLMC, vascular and leptomeningeal cells; OPC, oligodendrocyte progenitor cells.
Extended Data Fig. 4
Extended Data Fig. 4. Clustering of human brain cells according to single nuclear RNA sequencing.
a, UMAP plot of 35,289 human brain cells. Clusters were annotated according to marker genes for the specific cell types. The dataset has been published (Lake, B.B., et al. Integrative single-cell analysis of transcriptional and epigenetic states in the human adult brain. Nat Biotechnol 36, 70-80 (2018)). b, Dot plots of marker genes used for annotation. Gene expression for all 30 clusters is shown as dot plot with the color representing mean gene expression and the diameters showing the percentage of positive cells in the clusters. Ex, excitatory neuronal subtypes; In, inhibitory neuronal subtypes. c, The SARS-CoV-2 S gene encoding the spike protein was found in vascular cells in the cortex of a COVID-19 patient (exemplary for at least 3 vessels) but not in an uninfected control subject by in situ hybridization. Scale bar, 50 µm.
Extended Data Fig. 5
Extended Data Fig. 5. SARS-CoV-2 induces NEMO cleavage.
a, SARS-CoV-2- (MOI: 1) or mock-infected Vero E6 cells were harvested at the indicated time points. Cell lysates were immunoblotted for NEMO. N = 3 experiments. b, Human brain endothelial hCMEC/D3 cells were transfected with plasmids encoding for NEMO-2A and for human ACE2 plus TMPRSS2. Twenty-four hours after transfection, cells were incubated with SARS-CoV-2 for 2 hours (MOI: 1) and harvested after additional 24 hours. Only transfected cells expressing human ACE2 as well as 2A-tagged NEMO were susceptible to SARS-CoV-2 infection (Fig. 2e). Accordingly, 2A-tagged NEMO but not untagged NEMO was degraded. Upper panel, immunoblot using anti-NEMO; lower panel, immunoblot using anti-2A antibodies. N = 3 experiments. c, Lysates of the medulla oblongata of SARS-CoV-2-infected and control patients were immunoblotted for NEMO. Samples were matched according to post-mortem intervals (PMI): lanes 1 and 2: 1 day PMI; lanes 3 and 4: 2–3 days PMI; lanes 5 and 6: 4–5 days PMI; lanes 7 and 8: 4–5 days PMI. Histogram intensities of each lane were measured and depicted as means ± s.e.m., showing a decrease of the native forms of NEMO and an increase in cleaved NEMO in the tissue of SARS-CoV-2-infected patients (red profile) in comparison to control subjects (black profile). N = 4 patients in each group. Source data
Extended Data Fig. 6
Extended Data Fig. 6. Time dependence of NEMO cleavage by Mpro.
Cleavage of human NEMO by SARS-CoV-2 Mpro (0, 5, 10, 25 µM) depended on the incubation time. NEMO (with GST tag) or the cleavage products were detected by immunoblotting (representative for at least 6 experiments at different conditions). The red-boxed part of the blot is shown in Fig. 3a. Source data
Extended Data Fig. 7
Extended Data Fig. 7. Cleavage of NEMO in cell extracts.
a, Cell lysates of the human brain endothelial cell line hCMEC/D3 were incubated with Mpro (25 µM) for different durations and blotted against NEMO and Mpro (representative for at least 3 experiments at different conditions). b, HEK293T cells were transfected with a plasmid encoding for the mouse NEMO linked to GFP via a 2A sequence. After cell lysis, Mpro (25 µM) was added and incubated for the indicated durations. Antibodies against the 2A linker were used to identify NEMO and its cleavage products (representative for 2 experiments). c, hCMEC/D3 cells were transfected with the same plasmid as described in b (pNEMO-2A-GFP) and additionally with an empty control plasmid or a plasmid containing the HA-tagged form of the SARS-CoV-2 Mpro protease. After 2 days, cells were lysed and blotted against NEMO, 2A, Mpro, and actin (representative for at least 9 experiments). The red-boxed part of the blots is shown in Fig. 3c. Source data
Extended Data Fig. 8
Extended Data Fig. 8. String vessels occur in the deeper part of the vascular tree.
a, String vessels were tracked in confocal 3D scans of the cortex after staining against CD31, collagen IV and smooth muscle actin (α-SMA) (left). Since α-SMA is expressed in arteries and arterioles (middle), the branching order can be determined (right). String vessels positive for α-SMA are defined as arteriole string vessels, adjacent string vessels as 1st capillary string vessels, etc. (right). The image was obtained by cropping a section from a NemobeKO tilescan from the dataset used for quantification in (b) (N = 3 animals). Scale bar, 50 µm. b, Tracking of string vessels in the hippocampus and hypothalamus of NemobeKO mice revealed that more string vessels were present in higher branch orders of the vascular tree in NemobeKO mice. N = 3 animals. Means ± s.e.m. are shown, *P < 0.05, **P < 0.01. Detailed information about the exact test statistics, sidedness and values are provided in Supplementary Table 5.
Extended Data Fig. 9
Extended Data Fig. 9. Modulation of apoptosis and necroptosis pathways in mice with NEMO deficient brain endothelial cells.
a, Scheme showing the role of RIPK3 and FADD in cell death caused by NEMO deficiency. TNF leads to the activation of several adaptor proteins and kinases, such as TAK1. Activation of the IκB kinase complex triggers the translocation of NF-κB into the nucleus and the expression of target genes. NEMO is the regulatory subunit of the IκB kinase complex and is essential for NF-κB pathway activation. In the absence of NEMO, TNF leads to the formation of complex IIa, complex IIb, and the necrosome and induces apoptosis or necroptosis. According to current concepts (Kondylis, V., Kumari, S., Vlantis, K. & Pasparakis, M. The interplay of IKK, NF-kappaB and RIPK1 signaling in the regulation of cell death, tissue homeostasis and inflammation. Immunol Rev 277, 113-127 (2017)), apoptosis is mediated by FADD and RIPK3, while necroptosis depends on RIPK3. b, Deletion of Fadd in brain endothelial cells (FADDbeKO) led to the formation of string vessels and reduced vessel lengths. The results obtained in Nemofl, NemobeKO, Ripk3/, and NemobeKORipk3/ mice are also included in Fig. 6 of the main article. c, Representative immunoblots showing the extravasation of IgG and albumin into the brain tissue. In total, 9 blots were analyzed with one replicate per animal. d, Quantification of the immunoblots normalized for actin levels demonstrated a disruption of the BBB in FADD-deficient mice as shown by the extravasation of IgG and albumin. Brain weights hint at higher water content in FADD deficient mice. e, NemobeKOFADDbeKO mice died within 9 days after tamoxifen injection while RIPK3 deficiency prevented the death of NemobeKO mice. f, Ripk3 deletion normalized the body weight of mice with brain endothelial NEMO deficiency, while FADD deficiency worsened body weight loss. Only mice that survived until the end of the experiment were analyzed. Means ± s.e.m. are shown. Detailed information of group sizes are indicated in the individual figure. Source data
Extended Data Fig. 10
Extended Data Fig. 10. RIPK inhibition normalizes body weight gain in AAV-BR1-Mpro-injected mice.
a, RIPKi treatment normalized the body weight gain in AAV-BR1-Mpro-injected mice (N = 5 Ctrl + Vehicle mice, 6 Mpro + Vehicle mice, 6 Ctrl + RIPKi mice, 6 Mpro + RIPKi mice). b, In AAV-BR1-Mpro-injected mice, the cumulative body weight gain over 14 days was normalized by RIPKi treatment (N = 5 Ctrl + Vehicle mice, 6 Mpro + Vehicle mice, 6 Ctrl + RIPKi mice, 6 Mpro + RIPKi mice). Means ± s.e.m. are shown, ** P < 0.01. Detailed information about the exact test statistics, sidedness and values are provided in Supplementary Table 5.

References

    1. Helms J, et al. Neurologic features in severe SARS-CoV-2 infection. N. Engl. J. Med. 2020;382:2268–2270. doi: 10.1056/NEJMc2008597. - DOI - PMC - PubMed
    1. Paterson RW, et al. The emerging spectrum of COVID-19 neurology: clinical, radiological and laboratory findings. Brain. 2020;143:3104–3120. doi: 10.1093/brain/awaa240. - DOI - PMC - PubMed
    1. Iadecola C, Anrather J, Kamel H. Effects of COVID-19 on the nervous system. Cell. 2020;183:16–27. doi: 10.1016/j.cell.2020.08.028. - DOI - PMC - PubMed
    1. Nalbandian A, et al. Post-acute COVID-19 syndrome. Nat. Med. 2021;27:601–615. doi: 10.1038/s41591-021-01283-z. - DOI - PMC - PubMed
    1. Paniz-Mondolfi A, et al. Central nervous system involvement by severe acute respiratory syndrome coronavirus-2 (SARS-CoV-2) J. Med. Virol. 2020;92:699–702. doi: 10.1002/jmv.25915. - DOI - PMC - PubMed

Publication types

MeSH terms

Substances