. 2021 Oct 1:12:722259.
doi: 10.3389/fmicb.2021.722259. eCollection 2021.

Deep (Meta)genomics and (Meta)transcriptome Analyses of Fungal and Bacteria Consortia From Aircraft Tanks and Kerosene Identify Key Genes in Fuel and Tank Corrosion

Affiliations

Deep (Meta)genomics and (Meta)transcriptome Analyses of Fungal and Bacteria Consortia From Aircraft Tanks and Kerosene Identify Key Genes in Fuel and Tank Corrosion

Ines Krohn et al. Front Microbiol. .

Abstract

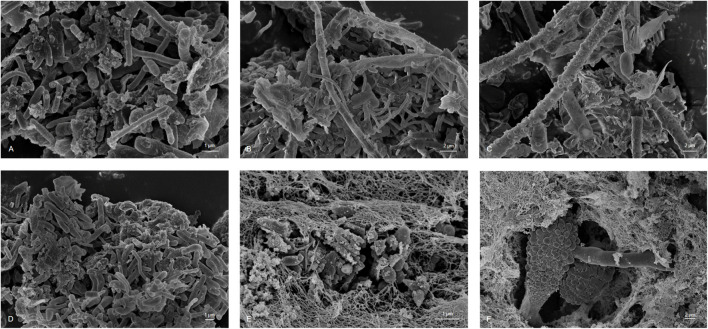
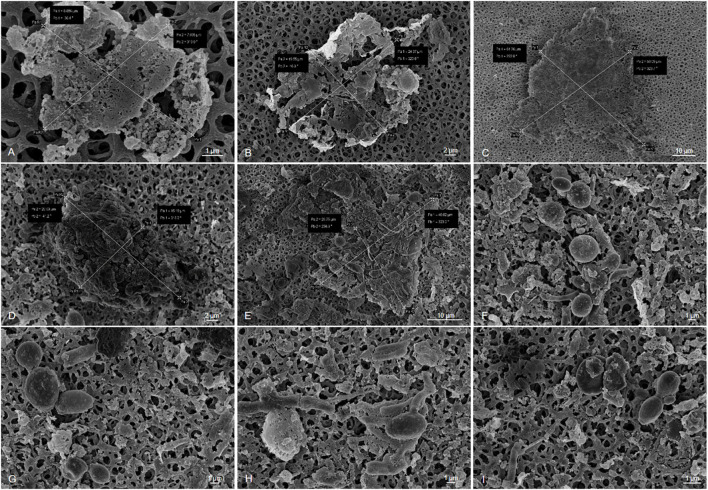
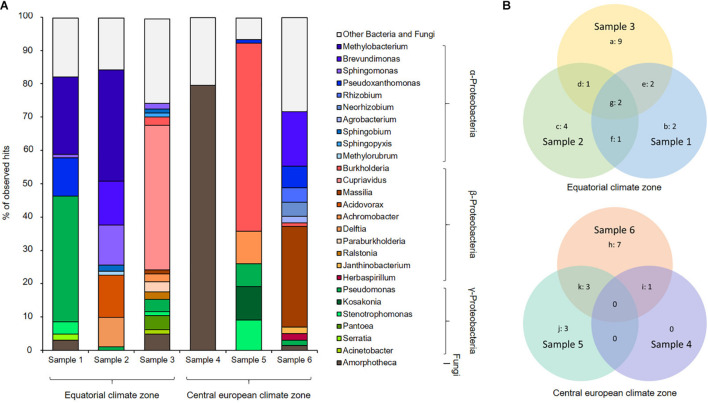
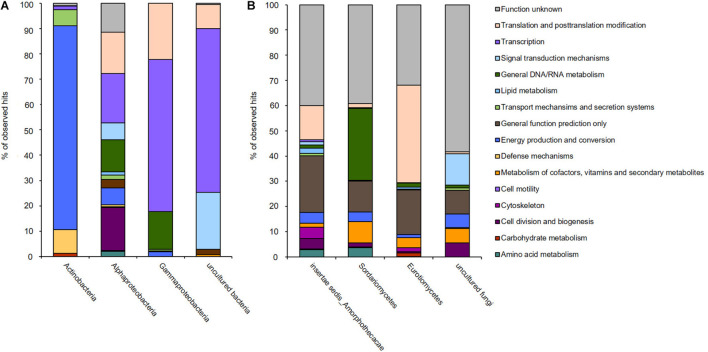
Microbial contamination of fuels, associated with a wide variety of bacteria and fungi, leads to decreased product quality and can compromise equipment performance by biofouling or microbiologically influenced corrosion. Detection and quantification of microorganisms are critical in monitoring fuel systems for an early detection of microbial contaminations. To address these challenges, we have analyzed six metagenomes, one transcriptome, and more than 1,200 fluid and swab samples taken from fuel tanks or kerosene. Our deep metagenome sequencing and binning approaches in combination with RNA-seq data and qPCR methods implied a metabolic symbiosis between fungi and bacteria. The most abundant bacteria were affiliated with α-, β-, and γ-Proteobacteria and the filamentous fungi Amorphotheca. We identified a high number of genes, which are related to kerosene degradation and biofilm formation. Surprisingly, a large number of genes coded enzymes involved in polymer degradation and potential bio-corrosion processes. Thereby, the transcriptionally most active microorganisms were affiliated with the genera Methylobacteria, Pseudomonas, Kocuria, Amorpotheka, Aspergillus, Fusarium, and Penicillium. Many not yet cultured bacteria and fungi appeared to contribute to the biofilm transcriptional activities. The largest numbers of transcripts were observed for dehydrogenase, oxygenase, and exopolysaccharide production, attachment and pili/flagella-associated proteins, efflux pumps, and secretion systems as well as lipase and esterase activity.

Keywords: bacteria and fungi; biocorrosion; biofilm formation; biofouling; fuel contamination; kerosene and aircraft; omics analysis.


Conflict of interest statement

BH, TL, CS, and RR were employed by company Lufthansa Technik AG HAM. The remaining authors declare that the research was conducted in the absence of any commercial or financial relationships that could be construed as a potential conflict of interest.

Figures

FIGURE 1
FIGURE 1
Scanning Electron Microscopy microphotography of sampled material showing hypha and conidia of fungi species and bacteria integrated in an EPS matrix (A) sample 1, (B) sample 2, (C) sample 3, (D) sample 4, (E) sample 5, and (F) sample 6; scale bars of 1–2 μm are indicated in the images (REM LEO 1525, 5.00 kV).
FIGURE 2
FIGURE 2
Sonification experiments of filtered kerosene on cellulose acetate membranes (F and W sampling). Sonification conditions: amplitude 60% of 200 W, cycle: 50%, volume: 500 ml, (A–C) sonification time: 0 s, (D–F) Sonification time: 15 s, (G–I) sonification time: 30 s. Scale bars of 1–10 μm are indicated in the images (REM LEO 1525, 5.00 kV).
FIGURE 3
FIGURE 3
Phylogenetic profiling of fuel biofilm-derived gene sequences based on Kraken2 analysis. (A) Metagenome stacked bar chart Kraken2, cutoff 1%, (B) Venn diagram showing the number of bins affiliated with assumed organisms uniquely, and the overlap of organisms within particular relationships using the Kraken2 dataset; digits indicate number of organisms a: Cupriavidus, Acinetobacter, Burkholderia, Paraburkholderia, Sphingopyxis, Pantoea, Massilia, Ralstonia, Achromobacter, b: Serratia, Pseudoxanthomonas, c: Acidovorax, Delftia, Methylorubrum, Brevundimonas, d: Sphingobium, e: Amorphotheca, Stenotrophomonas, f: Methylobacterium, g: Pseudomonas, Sphingomonas, h: Agrobacterium, Herbaspirillum, Rhizobium, Janthinobacterium, Massilia, Neorhizobium, Brevundimonas, i: Amorphotheca, j: Kosakonia, Stenotrophomonas, Achromobacter, k: Pseudomonas, Burkholderia, Pseudoxanthomonas.
FIGURE 4
FIGURE 4
Transcribed microbiome and expressed genes of (A) bacterial and (B) fungal classes of one biofilm sample from a fuel-containing habitat. The generated sequence data (approximately 132 mio reads) were mapped to the available six metagenomes.
FIGURE 5
FIGURE 5
Heat map reflecting the expression of genes affiliated with kerosene and polymer degradation, biofilm formation, transport and secretion systems, and general metabolism and energy production mechanisms of the individual (A) bacterial and (B) fungi-related reads; color key: formula image 
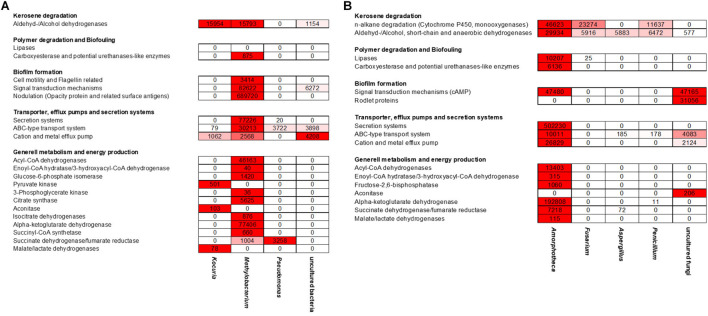
high expression level, formula image low expression level.
FIGURE 6
FIGURE 6
Metatranscriptome mapping to the reference genomes of (A) Methylobacterium brachiatum (GCF_003697185.1) and (B) Amorphotheca resinae (GCA_003019875.1). Numbers outside the circles show the genome coordinates in Mbp. Moving inward, the subsequent two rings show CDSs in forward (brown) and reverse (green) strands. Pseudogenes are displayed in gray; genes coding for tRNAs and rRNAs are marked in dark green and red, respectively (M. brachiatum only). Black bars indicate RPKM values for each CDS and are displayed in the same scale for (A,B). The last two inner plots indicate GC content and a GC skew [(GC)/(G + C)], where dark yellow and purple indicate values above and below average, respectively. The top 5 most expressed genes are denoted with a yellow triangle. Genes associated with kerosene degradation are marked with a red dot, potential mechanisms involved in polymer degradation with a blue dot, and genes for biofilm formation with a pink dot. For real RPKM values and further details, see Supplementary Table 6.

Similar articles

Cited by

References

    1. Anders S., Pyl P. T., Huber W. (2015). HTSeq–a Python framework to work with high-throughput sequencing data. Bioinformatics 31 166–169. 10.1093/bioinformatics/btu638 - DOI - PMC - PubMed
    1. Andrews S. (2010). FASTQC. A quality control tool for high throughput sequence data. Available online at: https://www.bioinformatics.babraham.ac.uk/projects/fastqc/ (accessed October 21, 2019).
    1. Anwar M. Z., Lanzen A., Bang-Andreasen T., Jacobsen C. S. (2019). To assemble or not to resemble—a validated comparative metatranscriptomics workflow (CoMW). GigaScience 8:giz096. - PMC - PubMed
    1. Beale D. J., Morrison P. D., Key C., Palombo E. A. (2014). Metabolic profiling of biofilm bacteria known to cause microbial influenced corrosion. Water Sci. Technol. 69 1–8. 10.2166/wst.2013.425 - DOI - PubMed
    1. Beauvais A., Schmidt C., Guadagnini S., Roux P., Perret E., Henry C., et al. (2007). An extracellular matrix glues together the aerial-grown hyphae of Aspergillus fumigatus. Cell Microbiol. 9 1588–1600. 10.1111/j.1462-5822.2007.00895.x - DOI - PubMed

LinkOut - more resources