. 2021 May 20:14:2867-2897.
doi: 10.5194/gmd-14-2867-2021.

The Community Multiscale Air Quality (CMAQ) model versions 5.3 and 5.3.1: system updates and evaluation

Affiliations

The Community Multiscale Air Quality (CMAQ) model versions 5.3 and 5.3.1: system updates and evaluation

K Wyat Appel et al. Geosci Model Dev. .

Abstract

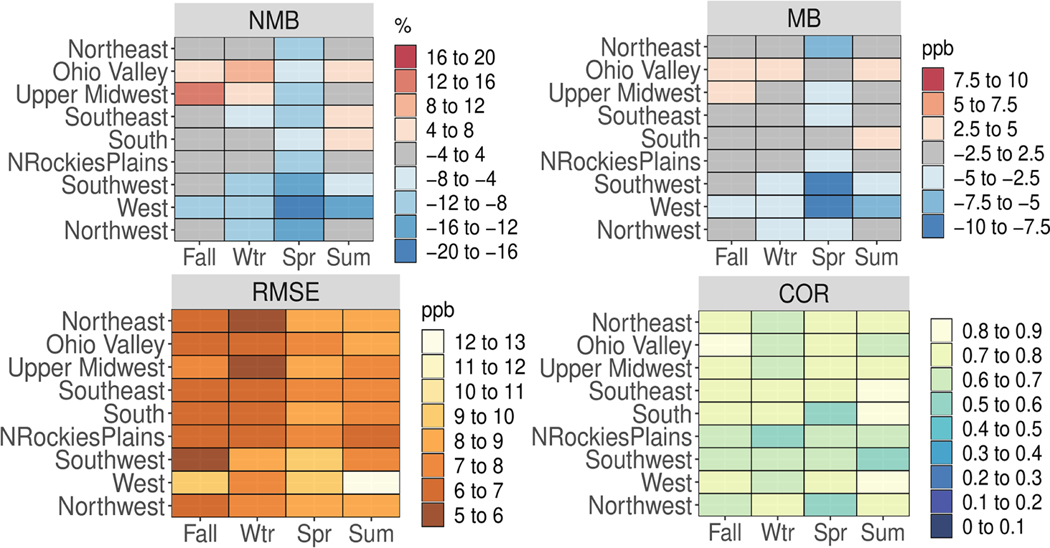
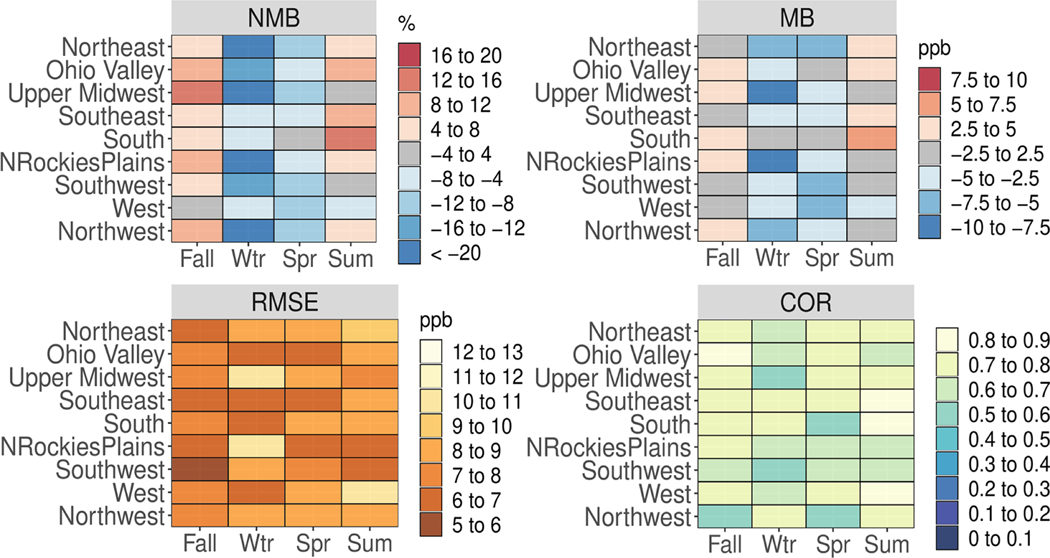
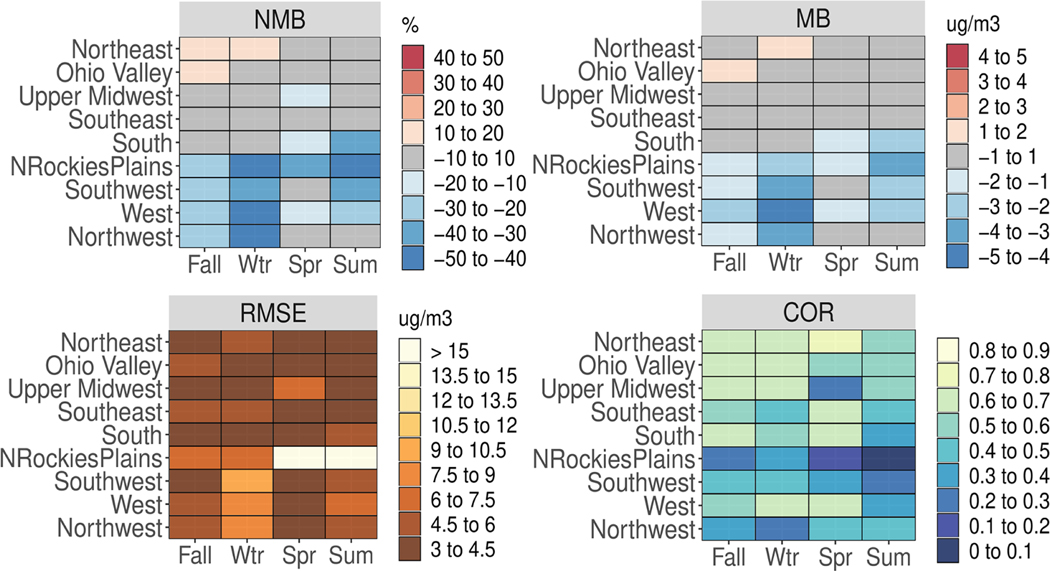
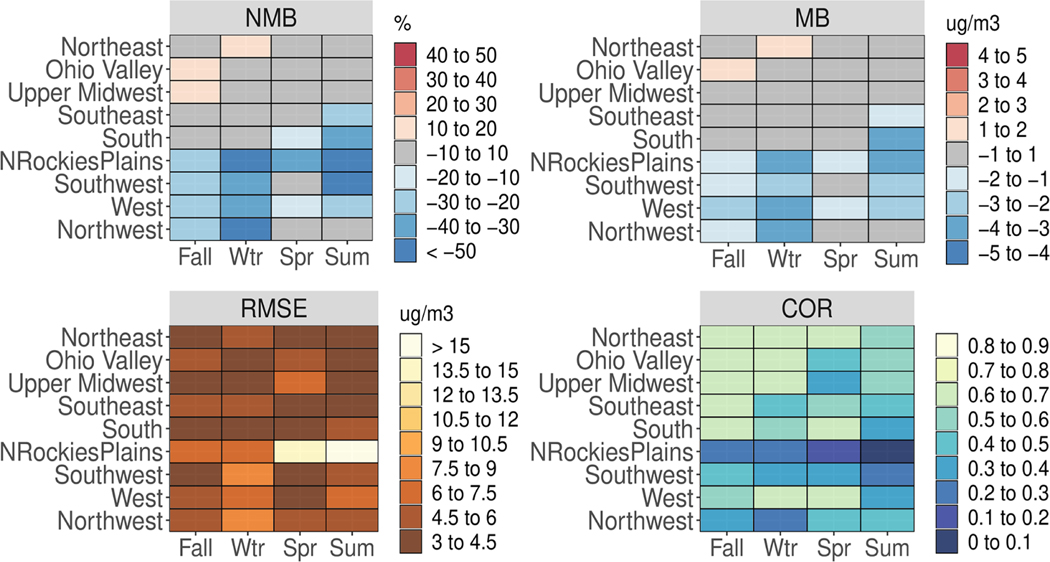
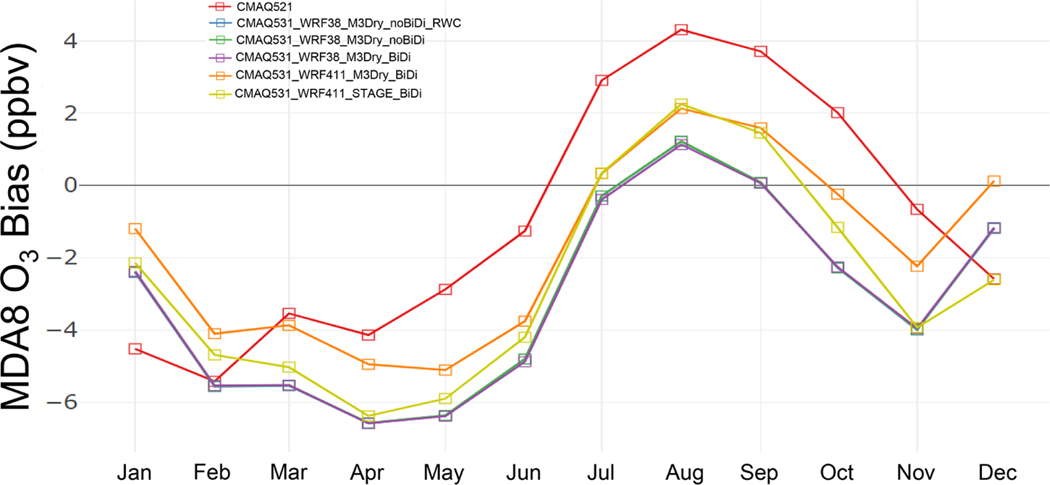
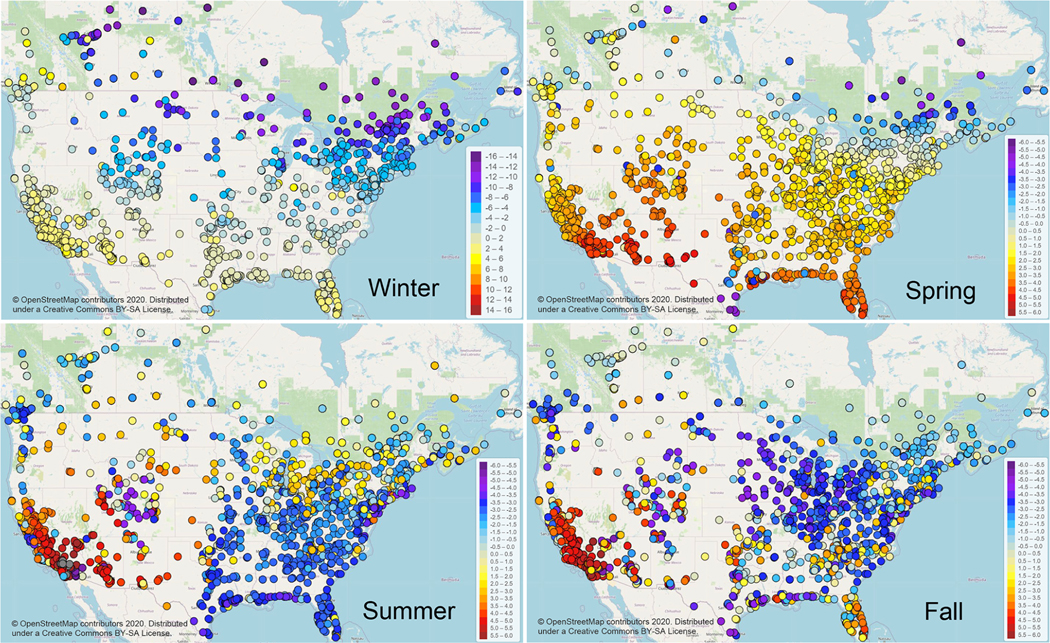
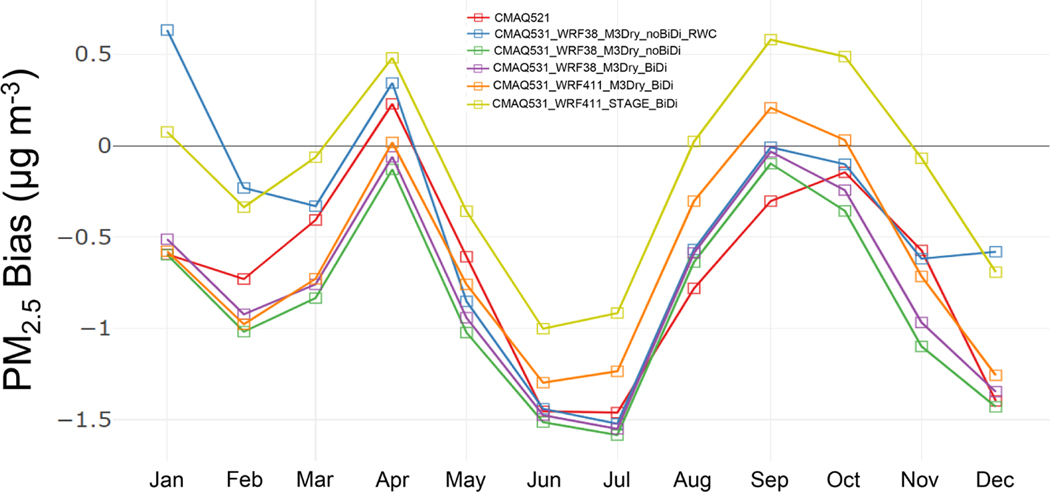
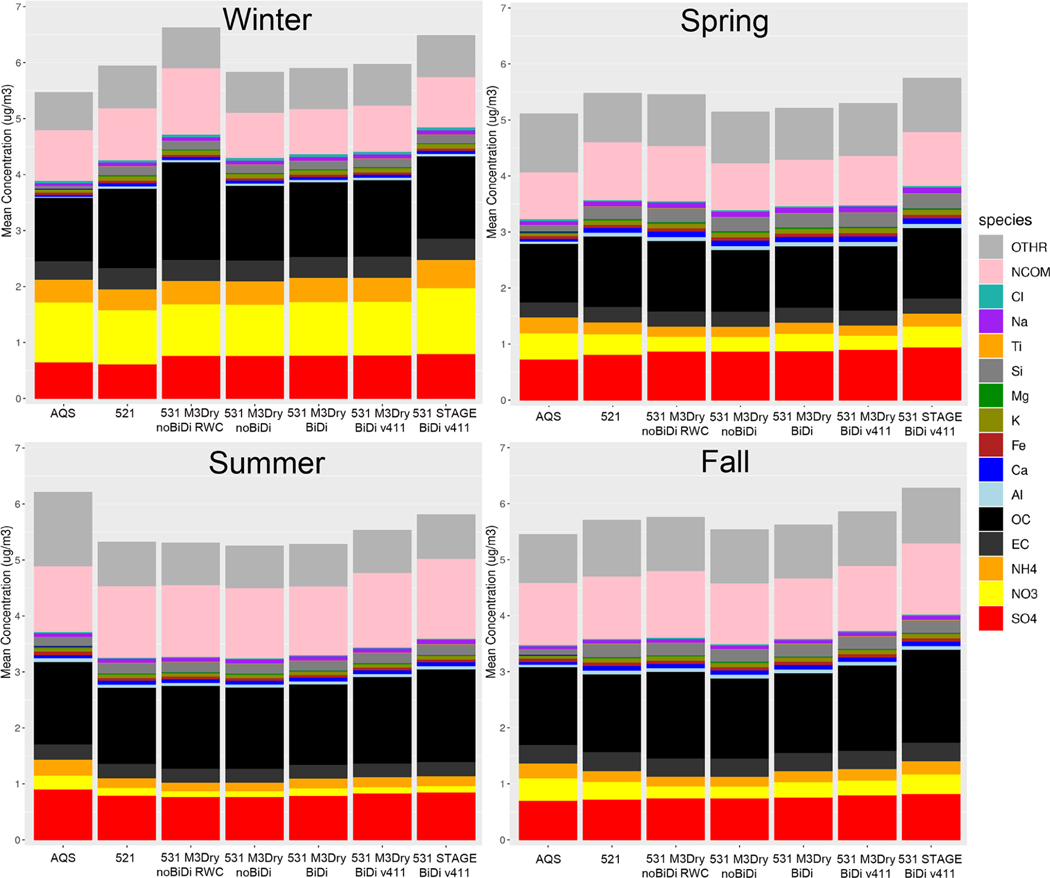
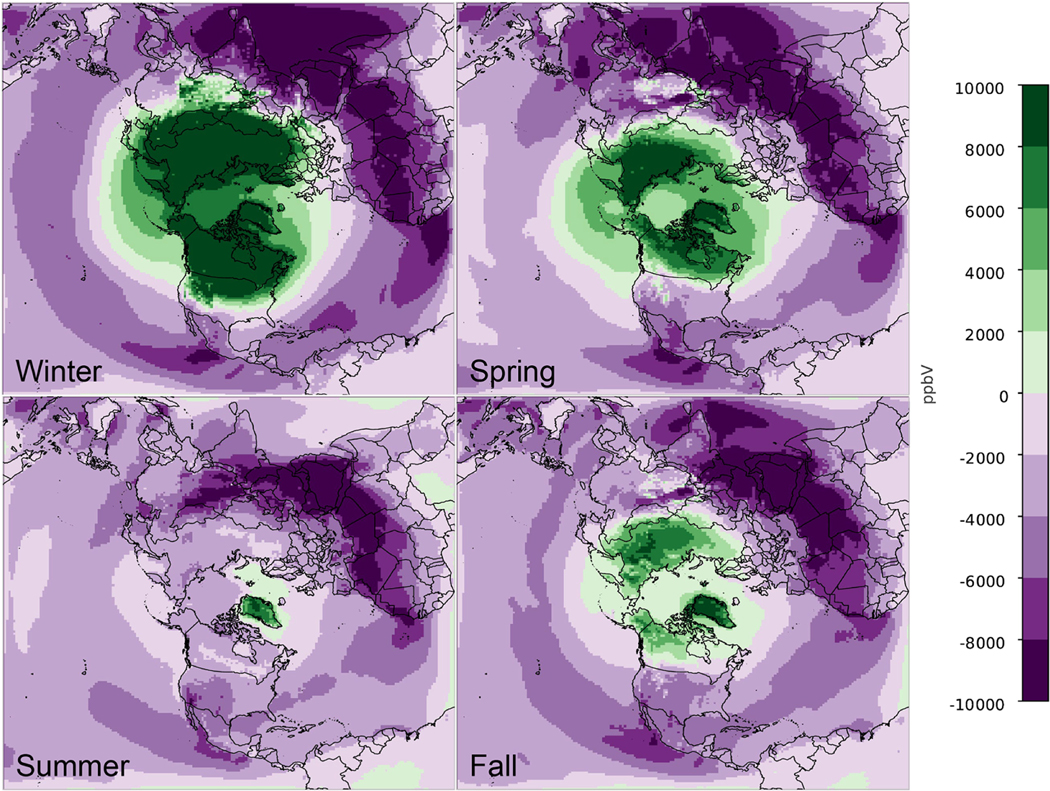
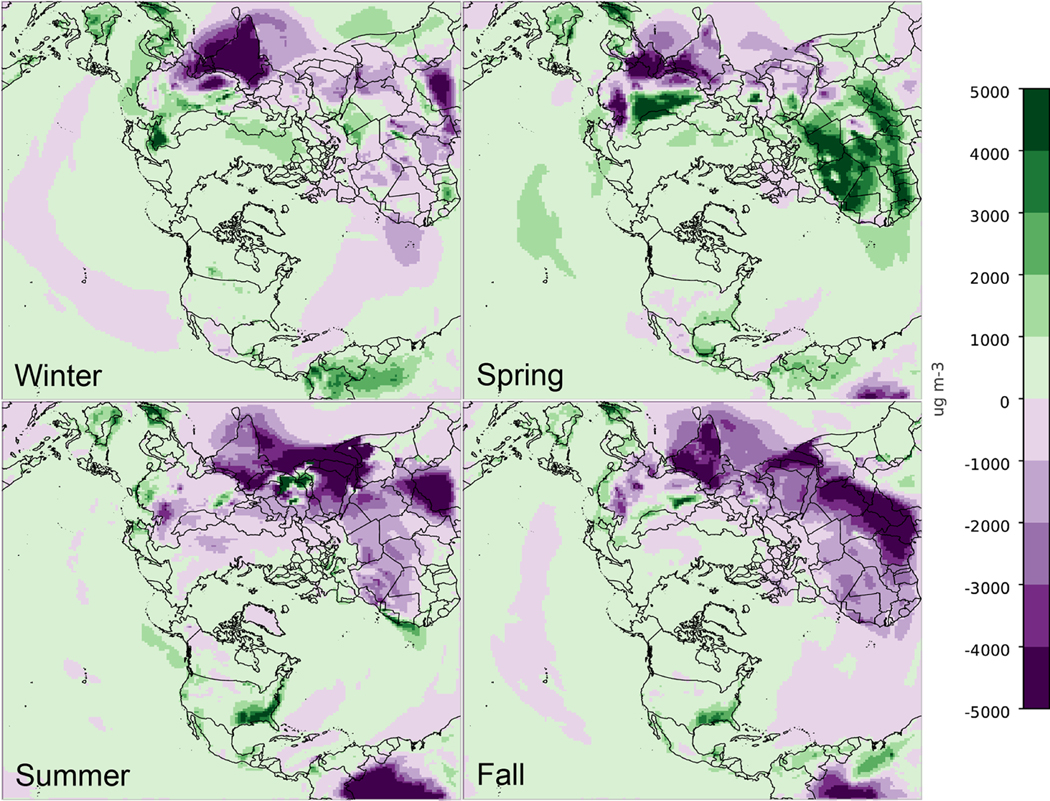
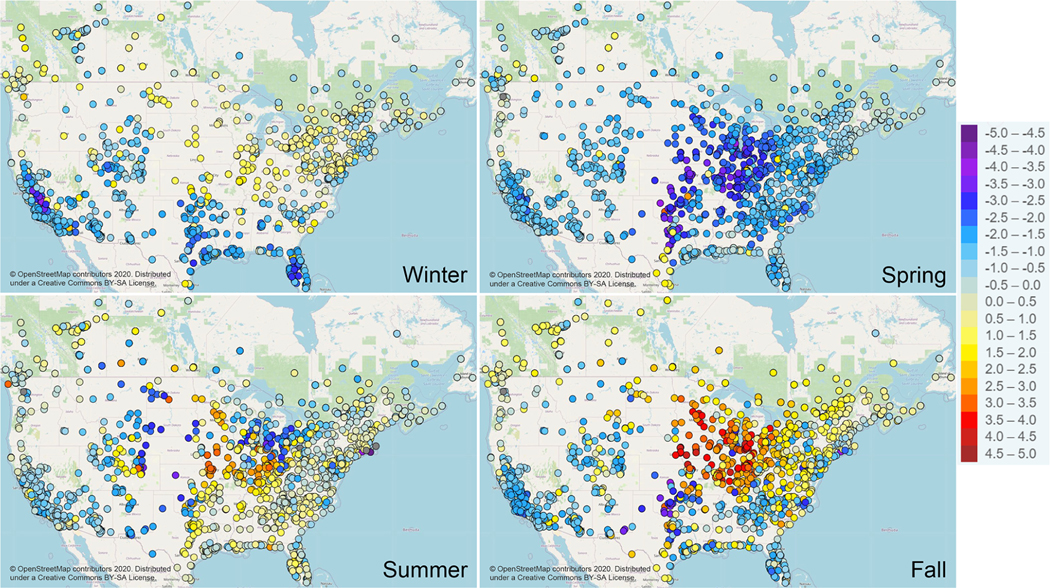
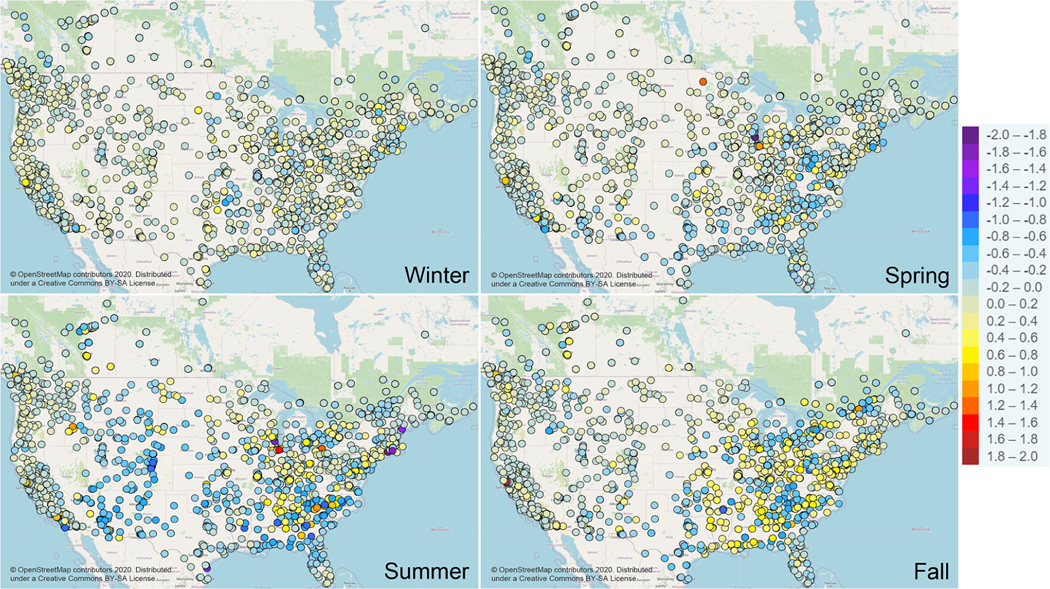
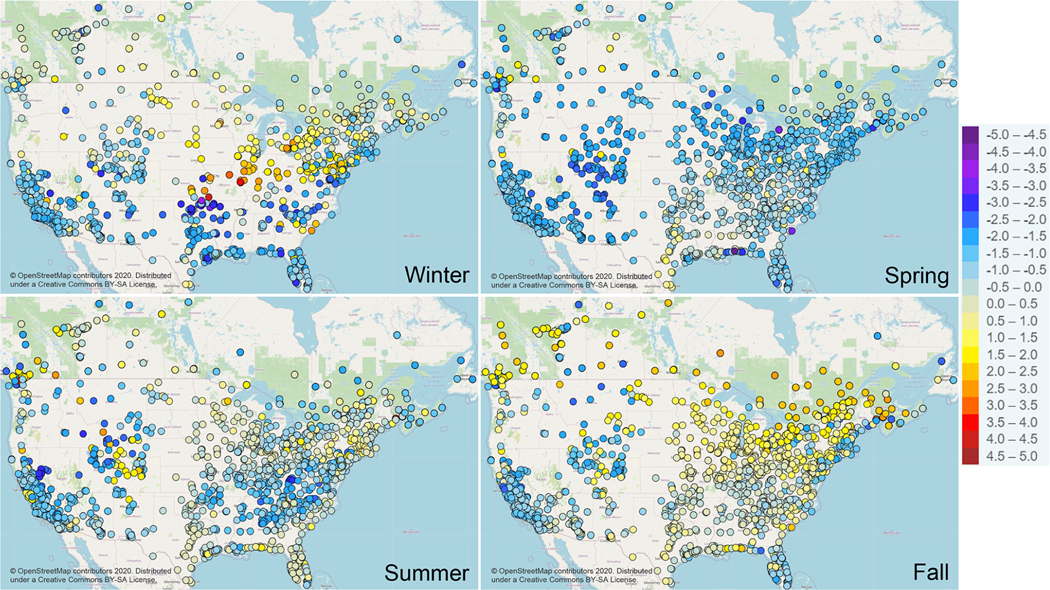
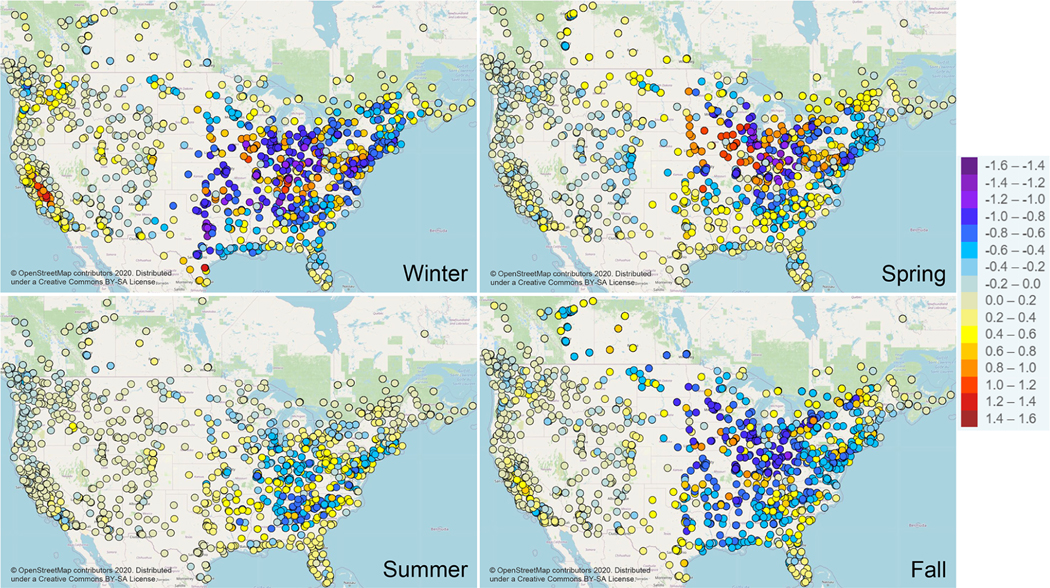
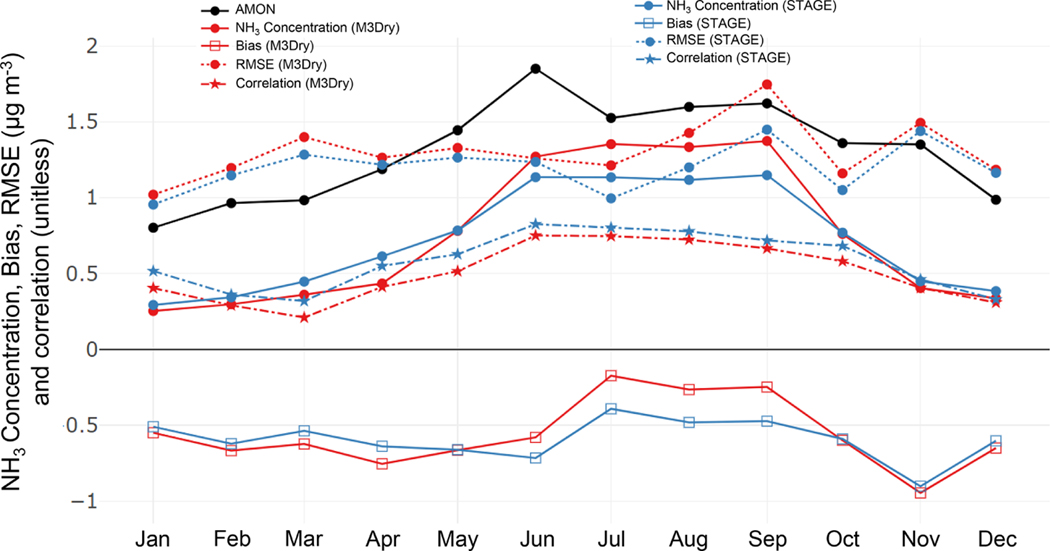
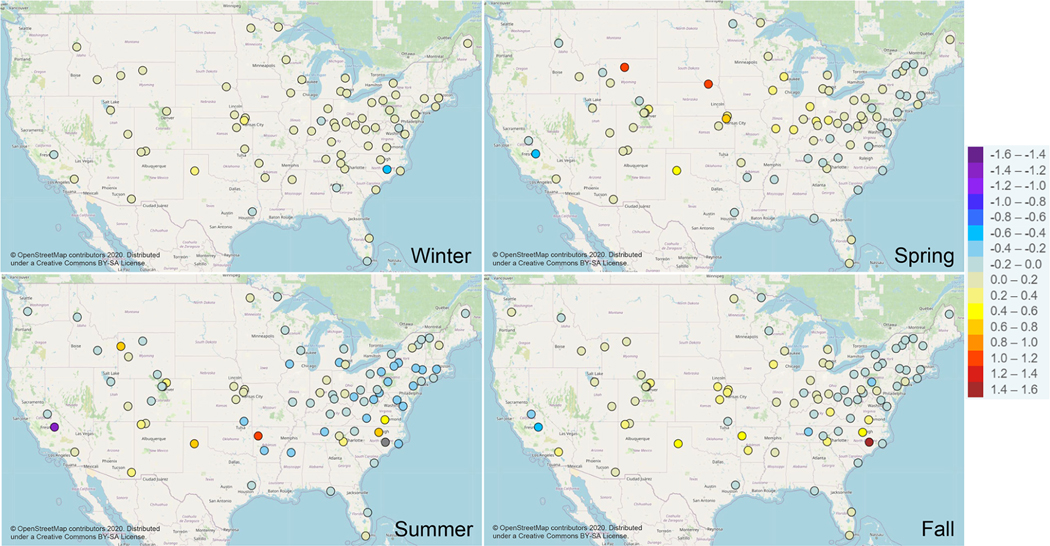
The Community Multiscale Air Quality (CMAQ) model version 5.3 (CMAQ53), released to the public in August 2019 and followed by version 5.3.1 (CMAQ531) in December 2019, contains numerous science updates, enhanced functionality, and improved computation efficiency relative to the previous version of the model, 5.2.1 (CMAQ521). Major science advances in the new model include a new aerosol module (AERO7) with significant updates to secondary organic aerosol (SOA) chemistry, updated chlorine chemistry, updated detailed bromine and iodine chemistry, updated simple halogen chemistry, the addition of dimethyl sulfide (DMS) chemistry in the CB6r3 chemical mechanism, updated M3Dry bidirectional deposition model, and the new Surface Tiled Aerosol and Gaseous Exchange (STAGE) bidirectional deposition model. In addition, support for the Weather Research and Forecasting (WRF) model's hybrid vertical coordinate (HVC) was added to CMAQ53 and the Meteorology-Chemistry Interface Processor (MCIP) version 5.0 (MCIP50). Enhanced functionality in CMAQ53 includes the new Detailed Emissions Scaling, Isolation and Diagnostic (DESID) system for scaling incoming emissions to CMAQ and reading multiple gridded input emission files. Evaluation of CMAQ531 was performed by comparing monthly and seasonal mean daily 8 h average (MDA8) O3 and daily PM2.5 values from several CMAQ531 simulations to a similarly configured CMAQ521 simulation encompassing 2016. For MDA8 O3, CMAQ531 has higher O3 in the winter versus CMAQ521, due primarily to reduced dry deposition to snow, which strongly reduces wintertime O3 bias (2-4 ppbv monthly average). MDA8 O3 is lower with CMAQ531 throughout the rest of the year, particularly in spring, due in part to reduced O3 from the lateral boundary conditions (BCs), which generally increases MDA8 O3 bias in spring and fall ( 0.5 μg m-3). For daily 24 h average PM2.5, CMAQ531 has lower concentrations on average in spring and fall, higher concentrations in summer, and similar concentrations in winter to CMAQ521, which slightly increases bias in spring and fall and reduces bias in summer. Comparisons were also performed to isolate updates to several specific aspects of the modeling system, namely the lateral BCs, meteorology model version, and the deposition model used. Transitioning from a hemispheric CMAQ (HCMAQ) version 5.2.1 simulation to a HCMAQ version 5.3 simulation to provide lateral BCs contributes to higher O3 mixing ratios in the regional CMAQ simulation in higher latitudes during winter (due to the decreased O3 dry deposition to snow in CMAQ53) and lower O3 mixing ratios in middle and lower latitudes year-round (due to reduced O3 over the ocean with CMAQ53). Transitioning from WRF version 3.8 to WRF version 4.1.1 with the HVC resulted in consistently higher (1.0-1.5 ppbv) MDA8 O3 mixing ratios and higher PM2.5 concentrations (0.1-0.25 μg m-3) throughout the year. Finally, comparisons of the M3Dry and STAGE deposition models showed that MDA8 O3 is generally higher with M3Dry outside of summer, while PM2.5 is consistently higher with STAGE due to differences in the assumptions of particle deposition velocities to non-vegetated surfaces and land use with short vegetation (e.g., grasslands) between the two models. For ambient NH3, STAGE has slightly higher concentrations and smaller bias in the winter, spring, and fall, while M3Dry has higher concentrations and smaller bias but larger error and lower correlation in the summer.


Conflict of interest statement

Competing interests. The authors declare that they have no conflict of interest.

Figures

Figure 1.
Figure 1.
NMB (%), MB (ppbv), RMSE (ppbv), and Pearson correlation coefficient values for MDA8 O3 for all AQS sites based on season and NOAA climate region for the CMAQ521 simulation.
Figure 2.
Figure 2.
NMB (%), MB (ppbv), RMSE (ppbv), and Pearson correlation coefficient values for MDA8 O3 for all AQS sites based on season and NOAA climate region for the CMAQ531_WRF411_M3Dry_BiDi simulation.
Figure 3.
Figure 3.
NMB (%), MB (μg m−3), RMSE (μg m−3), and Pearson correlation coefficient (COR) values for daily average PM2.5 for all AQS sites based on season and NOAA climate region for the CMAQ521 simulation.
Figure 4.
Figure 4.
NMB (%), MB (μg m−3), RMSE (μg m−3), and Pearson correlation coefficient (COR) values for daily average PM2.5 for all AQS sites based on season and NOAA climate region for the CMAQ531_WRF411_M3Dry_BiDi simulation.
Figure 5.
Figure 5.
Time series of monthly average MDA8 O3 bias (ppbv) compared against all AQS sites. Note that the blue, green, and purple lines all fall very close to one another.
Figure 6.
Figure 6.
Seasonal average MDA8 O3 absolute bias difference (ppbv) between the CMAQ521 and CMAQ531_WRF38_M3Dry_BiDi simulations for all AQS and NAPS sites. Cool shading (negative values) indicates a smaller bias in the CMAQ531_WRF38_M3Dry_BiDi simulation, warm colors (positive values) indicates a smaller bias in the CMAQ521 simulation. Note that the scale is different for the winter season. Grey shading indicates values beyond the range of the scale.
Figure 7.
Figure 7.
Time series of monthly average PM2.5 bias (μg m−3) for all AQS sites.
Figure 8.
Figure 8.
Seasonal average PM2.5 absolute bias difference (μg m−3) between the CMAQ521 and CMAQ531_WRF38_M3Dry_BiDi simulations for all AQS and NAPS sites. Cool shading (negative values) indicate smaller bias in the CMAQ531_WRF38_M3Dry_BiDi simulation, warm colors (positive values) indicate smaller bias in the CMAQ521 simulation. Grey shading indicates values beyond the range of the scale.
Figure 9.
Figure 9.
Seasonal stacked bar plots of speciated PM2.5 (μg m−3) for AQS sites. The height of the bar represents the total PM2.5 concentration. Refer to Table 1 for more details about the simulation configurations.
Figure 10.
Figure 10.
Difference in seasonal average surface O3 mixing ratios (ppbv; all hours) between HCMAQ521 and HCMAQ531_M3Dry simulations (HCMAQ531_M3Dry – HCMAQ521). Green shading indicates higher O3 mixing ratios and purple shading indicates lower O3 mixing ratios in the HCMAQ531_M3Dry simulation.
Figure 11.
Figure 11.
Difference in seasonal average surface PM2.5 concentrations (μg m−3; all hours) between the HCMAQ521 and HCMAQ531_M3Dry simulations (HCMAQ531_M3Dry – HCMAQ521). Green shading indicates higher PM2.5 concentrations and purple shading indicates lower PM2.5 concentrations with the HCMAQ531_M3Dry simulation.
Figure 12.
Figure 12.
Seasonal average MDA8 O3 absolute bias difference (ppbv) between the CMAQ531_WRF38_M3Dry_BiDi and CMAQ531_WRF411_M3Dry_BiDi simulations for all AQS and NAPS sites to highlight the impact of the updated WRF version. Cool shading (negative values) indicates smaller bias in the CMAQ531_WRF411_M3Dry_BiDi simulation, and warm colors (positive values) indicate smaller bias in the CMAQ531_WRF38_M3Dry_BiDi simulation.
Figure 13.
Figure 13.
Seasonal average PM2.5 absolute bias difference (μg m−3) between the CMAQ531_WRF38_M3Dry_BiDi and CMAQ531_WRF411_M3Dry_BiDi simulations for all AQS and NAPS sites to highlight the impact of the updated WRF version. Cool shading (negative values) indicates smaller bias in the CMAQ531_WRF411_M3Dry_BiDi simulation, and warm colors (positive values) indicate smaller bias in the CMAQ531_WRF38_M3Dry_BiDi simulation.
Figure 14.
Figure 14.
Seasonal average MDA8 O3 absolute bias difference (ppbv) between CMAQ531_WRF411_M3Dry_BiDi and CMAQ531_WRF411_STAGE_BiDi simulations for all AQS and NAPS sites to highlight the impact of the M3Dry and STAGE deposition models. Cool shading (negative values) indicates smaller bias in the CMAQ531_WRF411_M3Dry_BiDi simulation, and warm colors (positive values) indicate smaller bias in the CMAQ531_WRF411_STAGE_BiDi simulation.
Figure 15.
Figure 15.
Seasonal average PM2.5 absolute bias difference (μg m−3) between CMAQ531_WRF411_M3Dry_BiDi and CMAQ531_WRF411_STAGE_BiDi simulations for all AQS and NAPS sites to highlight the impact of the M3Dry and STAGE deposition models. Cool shading (negative values) indicates smaller bias in the CMAQ531_WRF411_M3Dry_BiDi simulation, and warm colors (positive values) indicate smaller bias in the CMAQ531_WRF411_STAGE_BiDi simulation.
Figure 16.
Figure 16.
Time series of monthly average observed and simulated NH3 concentrations (solid circle; μg m−3), bias (open square; μg m−3), RMSE (dotted solid circle; μg m−3), and Pearson correlation coefficient (dot-dashed solid stars) for all AMON sites for CMAQ531_WRF411_M3Dry_BiDi simulation (red) and CMAQ531_WRF411_STAGE_BiDi simulation (blue).
Figure 17.
Figure 17.
Seasonal average NH3 absolute bias difference (μg m−3) between CMAQ531_WRF411_M3Dry_BiDi and CMAQ531_WRF411_STAGE_BiDi simulations for all AMON sites. Cool shading (negative values) indicates smaller bias in the CMAQ531_WRF411_M3Dry_BiDi simulation, and warm colors (positive values) indicate smaller bias in the CMAQ531_WRF411_STAGE_BiDi simulation. Grey shading indicates values beyond the range of the scale.

References

    1. Appel KW, Gilliam RC, Davis N, Zubrow A, and Howard SC: Overview of the Atmospheric Model Evaluation Tool (AMET) v1.1 for evaluating meteorological and air quality models, Environ. Modell. Softw, 26, 434–443, 10.1016/j.envsoft.2010.09.007, 2011. - DOI
    1. Appel KW, Napelenok SL, Foley KM, Pye HOT, Hogrefe C, Luecken DJ, Bash JO, Roselle SJ, Pleim JE, Foroutan H, Hutzell WT, Pouliot GA, Sarwar G, Fahey KM, Gantt B, Gilliam RC, Heath NK, Kang D, Mathur R, Schwede DB, Spero TL, Wong DC, and Young JO: Description and evaluation of the Community Multiscale Air Quality (CMAQ) modeling system version 5.1, Geosci. Model Dev, 10, 1703–1732, 10.5194/gmd-10-1703-2017, 2017. - DOI - PMC - PubMed
    1. Bachmann JD: Will the Circle Be Unbroken: A History of the U.S. National Ambient Air Quality Standards, J. Air Waste Manage, 57, 652–697, 2007. - PubMed
    1. Bash JO, Cooter EJ, Dennis RL, Walker JT, and Pleim JE: Evaluation of a regional air-quality model with bidirectional NH3 exchange coupled to an agroecosystem model, Biogeosciences, 10, 1635–1645, 10.5194/bg-10-1635-2013, 2013. - DOI
    1. Byun D. and Schere KL: Review of the governing equations, computational algorithms, and other components of the Models-3 Community Multiscale Air Quality (CMAQ) modeling system, Appl. Mech. Rev, 59, 51–77, 2006.

LinkOut - more resources