Review
. 2021 Oct 19;2021(2):niab025.
doi: 10.1093/nc/niab025. eCollection 2021.

Metacognitive asymmetries in visual perception

Affiliations
Review

Metacognitive asymmetries in visual perception

Matan Mazor et al. Neurosci Conscious. .

Erratum in

Abstract

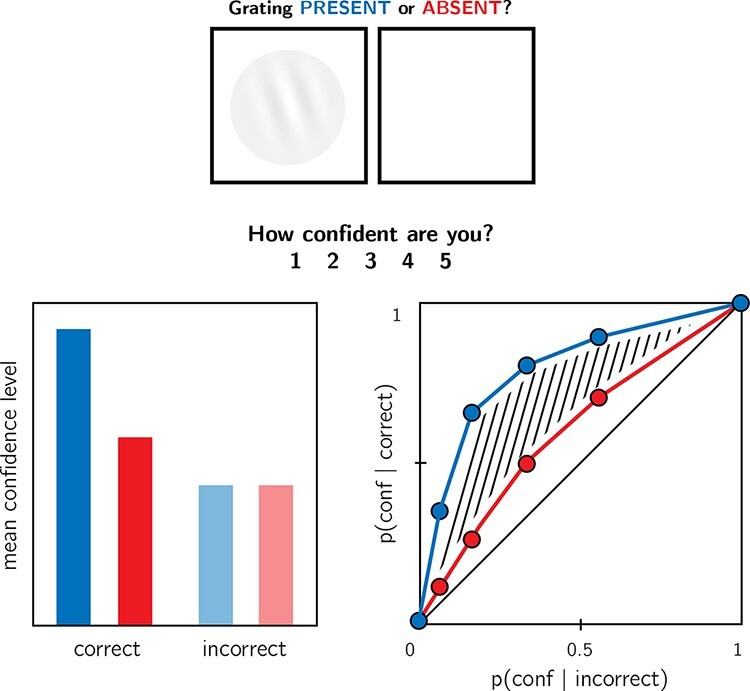
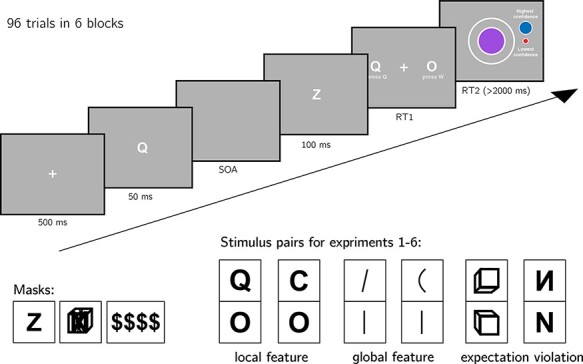
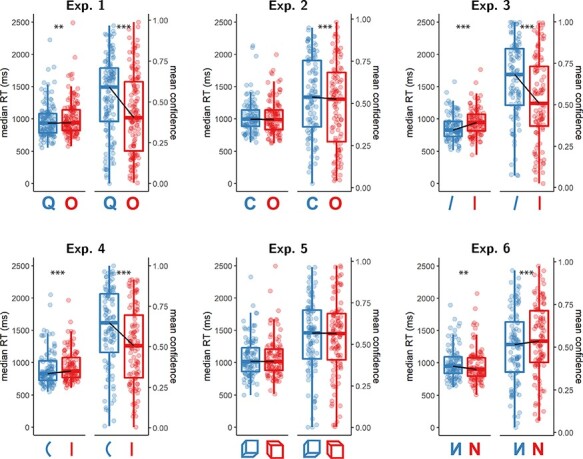
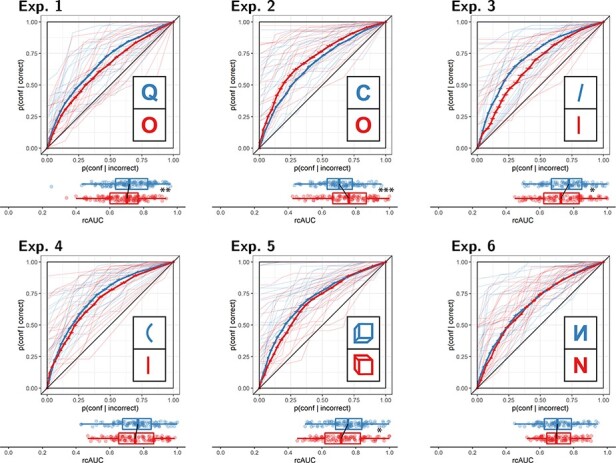
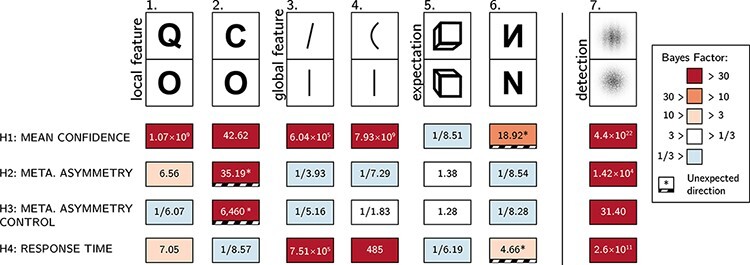
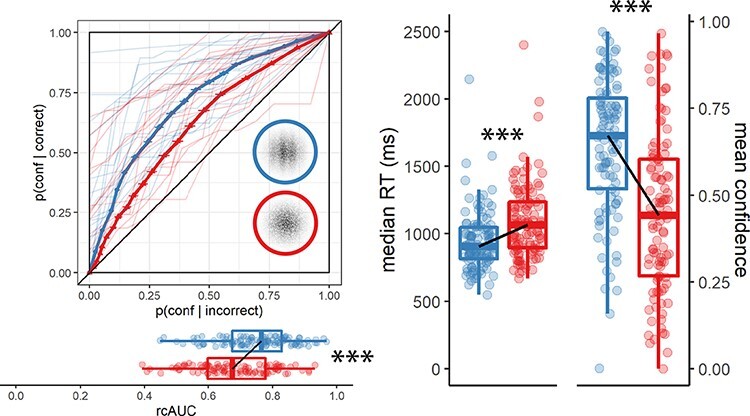
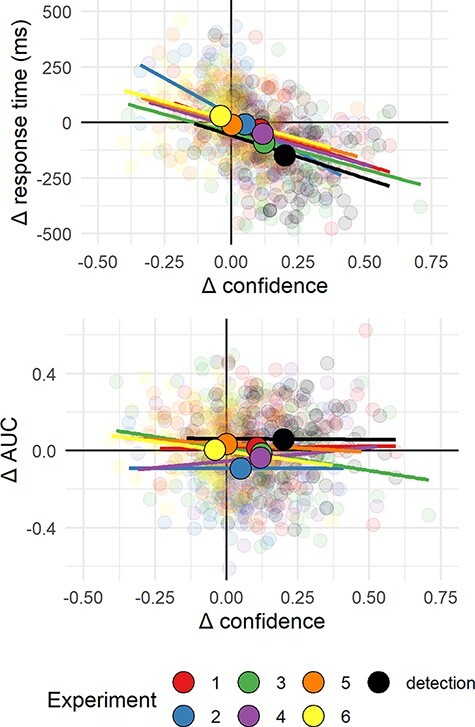
Representing the absence of objects is psychologically demanding. People are slower, less confident and show lower metacognitive sensitivity (the alignment between subjective confidence and objective accuracy) when reporting the absence compared with presence of visual stimuli. However, what counts as a stimulus absence remains only loosely defined. In this Registered Report, we ask whether such processing asymmetries extend beyond the absence of whole objects to absences defined by stimulus features or expectation violations. Our pre-registered prediction was that differences in the processing of presence and absence reflect a default mode of reasoning: we assume an absence unless evidence is available to the contrary. We predicted asymmetries in response time, confidence, and metacognitive sensitivity in discriminating between stimulus categories that vary in the presence or absence of a distinguishing feature, or in their compliance with an expected default state. Using six pairs of stimuli in six experiments, we find evidence that the absence of local and global stimulus features gives rise to slower, less confident responses, similar to absences of entire stimuli. Contrary to our hypothesis, however, the presence or absence of a local feature has no effect on metacognitive sensitivity. Our results weigh against a proposal of a link between the detection metacognitive asymmetry and default reasoning, and are instead consistent with a low-level visual origin of metacognitive asymmetries for presence and absence.

Keywords: absence; metacognition; presence.


Figures

Figure 1.
Figure 1.
In visual detection, subjective confidence ratings following judgments about target absence are typically lower and less correlated with objective accuracy than following judgments about target presence. Top panel: a typical detection experiment. The participant reports whether a visual grating was present or absent and then rates their subjective decision confidence. Bottom left: typically, mean confidence in “yes” responses (blue) is higher than in “no” responses (red). This effect is much more pronounced in correct trials. Bottom right: the interaction between accuracy and response type on confidence (metacognitive asymmetry) manifests as a lower area under the response conditional type 2 Receiver Operating Characteristic (rcROC) curve for “no” responses compared with “yes” responses. Plots do not directly correspond to a specific dataset but portray typical results in visual detection
Figure 2.
Figure 2.
Experiment design. Metacognitive asymmetry effects were tested for six stimulus features in six separate experiments, encompassing three levels of abstraction: local features, global features, and expectation violations. The presented trial corresponds to the first stimulus pair, with Q and O as the two stimuli
Figure 3.
Figure 3.
Reaction time and confidence distributions for Experiments 1–6. Box edges and central lines represent the 25, 50, and 75 quantiles. Whiskers cover data points within four inter-quartile ranges around the median. Black lines connect the median values for the two responses. Stars represent significance in a two-sided t-test: **p < 0.01, ***p < 0.001
Figure 4.
Figure 4.
Response conditional type 2 ROC curves for Experiments 1–6. The area under the curve is a measure of metacognitive sensitivity. Error bars stand for the standard error of the mean. For illustration, the curves of the first 20 participants of each experiment are plotted in low opacity. Below each ROC: distributions of the area under the curve for the two responses, across participants. Same conventions as in Fig. 3. Stars represent significance in a two-sided t-test: *p < 0.05, **p < 0.01, ***p < 0.001
Figure 5.
Figure 5.
Summary of results from Experiments 1–6 and exploratory Experiment 7. Rows correspond to our four pre-registered hypotheses: a difference in confidence, a difference in metacognitive sensitivity, a difference in metacognitive sensitivity when controlling for response and confidence bias, and a difference in response times
Figure 6.
Figure 6.
Response conditional type 2 ROC curves (left panel) and confidence and reaction time distributions (right panel) for Experiment 7 (detection positive control). The structure of this figure is similar to Figures 3 and 4: ***p < 0.001
Figure 7.
Figure 7.
Upper panel: Difference in mean confidence between S1 and S2 responses plotted against difference in mean response time between S1 and S2 responses across the seven experiments. Lower panel: Difference in mean confidence between S1 and S2 responses plotted against difference in metacognitive sensitivity, controlling for response bias, across the seven experiments. Semi-transparent circles represent individual subjects. Opaque circles are the means for each of the seven experiments, across participants. Lines indicate the best-fitting linear regression line for Experiments 1–7

Similar articles

Cited by

References

    1. Albonico A, Furubacke A, Barton JJ. et al. Perceptual efficiency and the inversion effect for faces, words and houses. Vision Res 2018;153:91–7. - PubMed
    1. Aust F, Barth M. 2020. Papaja: Create APA Manuscripts with R Markdown. https://github.com/crsh/papaja (1 August 2021, date last accessed).
    1. Borchers HW (2019). Pracma: Practical Numerical Math Functions. https://CRAN.R-project.org/package=pracma (1 August 2021, date last accessed).
    1. Calder-Travis J, Charles L, Bogacz R. et al.. Bayesian confidence in optimal decisions 2020. 10.31234/osf.io/j8sxz. - DOI - PMC - PubMed
    1. Champely S. 2020. Pwr: Basic Functions for Power Analysis. https://CRAN.R-project.org/package=pwr (1 August 2021, date last accessed).