. 2021 Dec 1;10(12):bio058688.
doi: 10.1242/bio.058688. Epub 2021 Dec 2.

Cellular senescence limits translational readthrough

Affiliations

Cellular senescence limits translational readthrough

Neylen Del Toro et al. Biol Open. .

Abstract

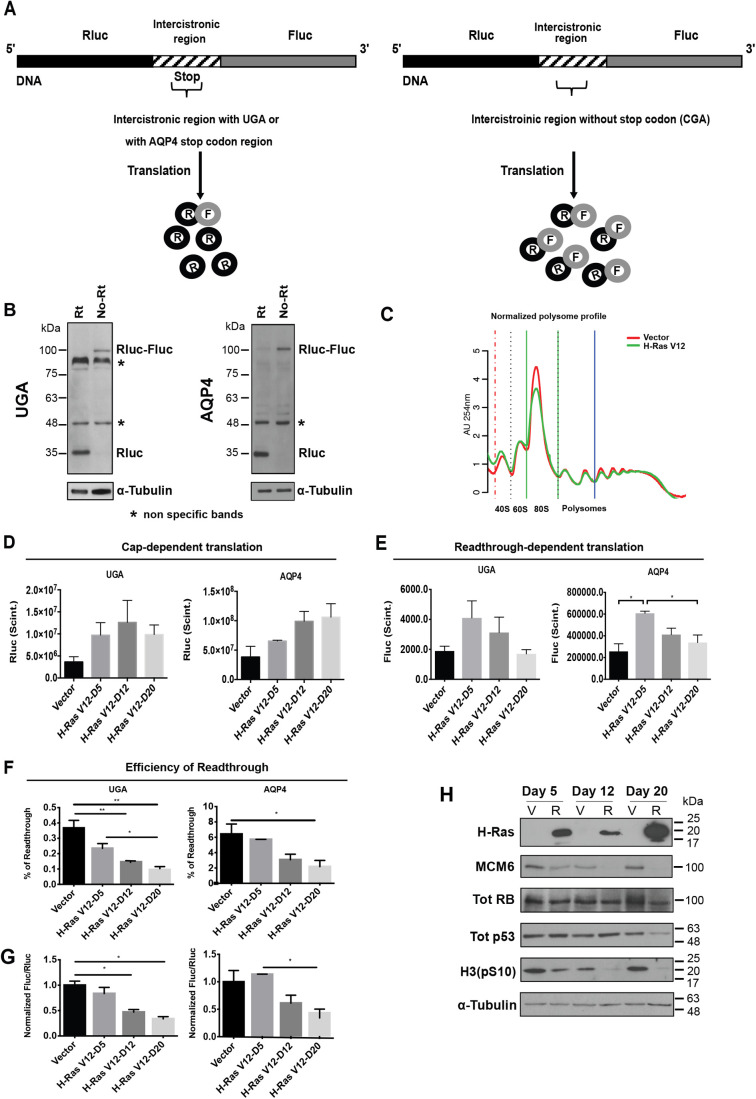
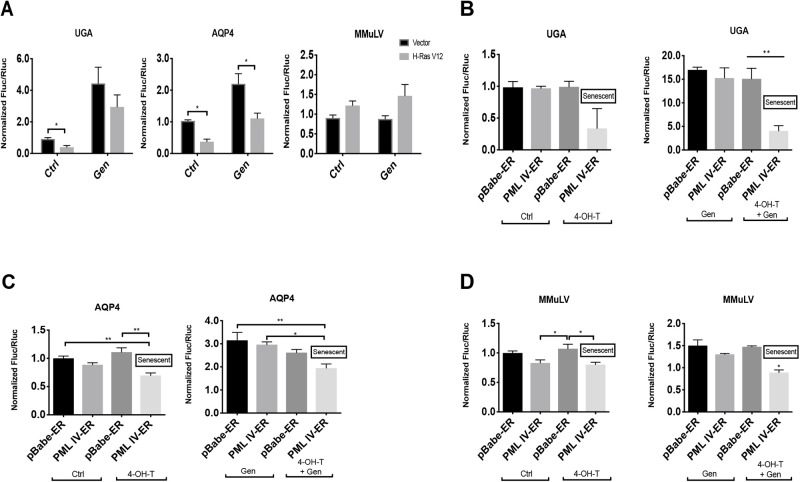
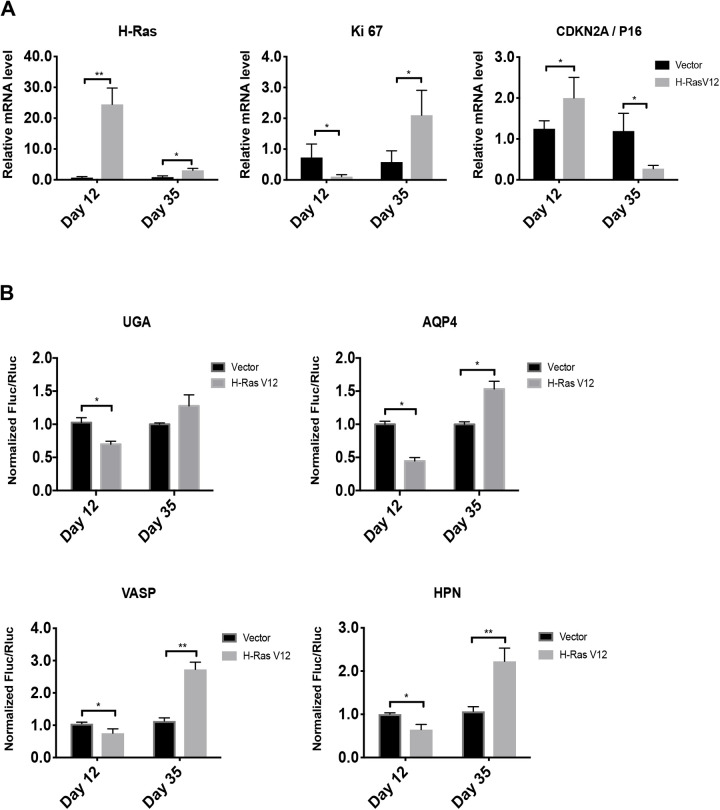
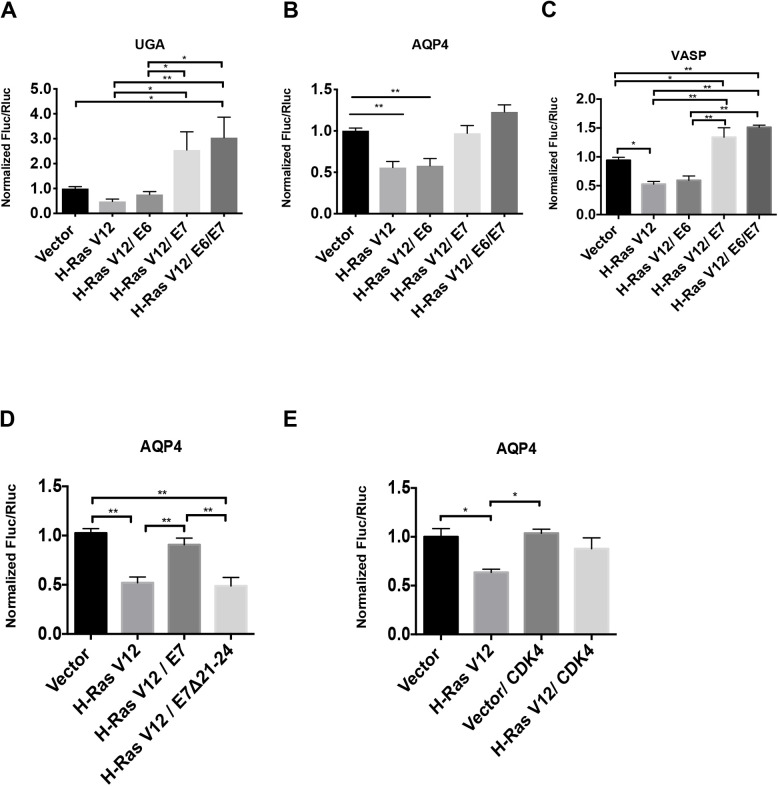
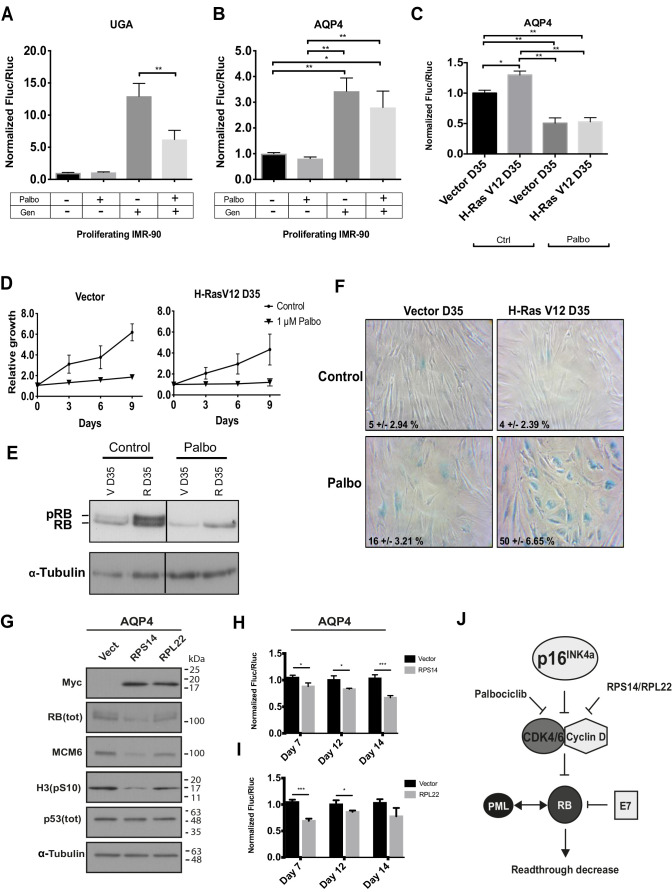
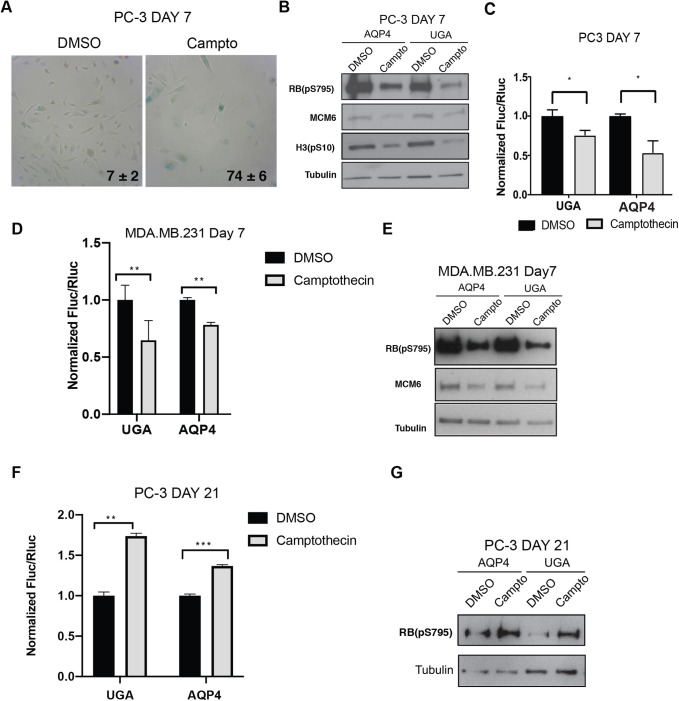
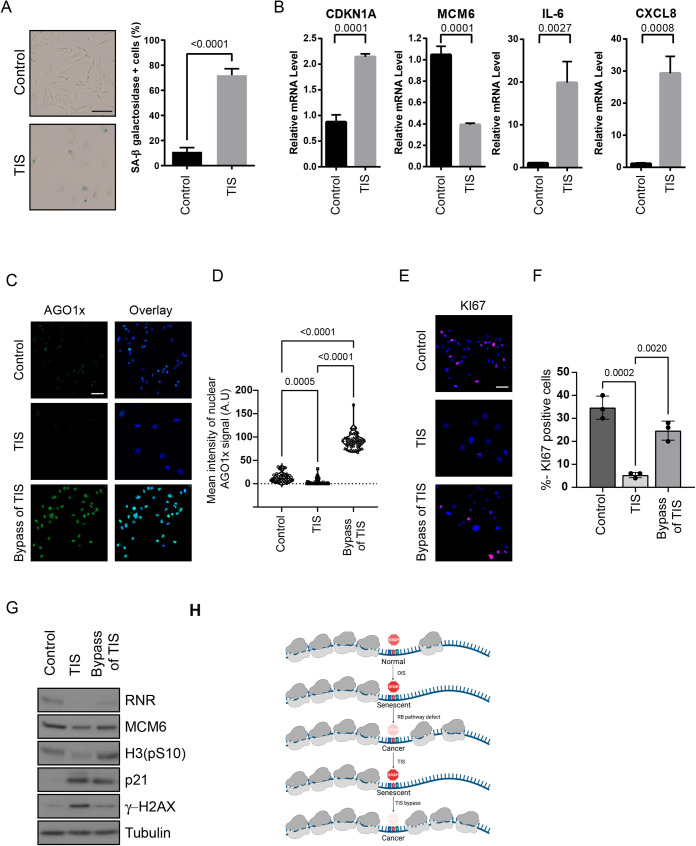
The origin and evolution of cancer cells is considered to be mainly fueled by DNA mutations. Although translation errors could also expand the cellular proteome, their role in cancer biology remains poorly understood. Tumor suppressors called caretakers block cancer initiation and progression by preventing DNA mutations and/or stimulating DNA repair. If translational errors contribute to tumorigenesis, then caretaker genes should prevent such errors in normal cells in response to oncogenic stimuli. Here, we show that the process of cellular senescence induced by oncogenes, tumor suppressors or chemotherapeutic drugs is associated with a reduction in translational readthrough (TR) measured using reporters containing termination codons withing the context of both normal translation termination or programmed TR. Senescence reduced both basal TR and TR stimulated by aminoglycosides. Mechanistically, the reduction of TR during senescence is controlled by the RB tumor suppressor pathway. Cells that escape from cellular senescence either induced by oncogenes or chemotherapy have an increased TR. Also, breast cancer cells that escape from therapy-induced senescence express high levels of AGO1x, a TR isoform of AGO1 linked to breast cancer progression. We propose that senescence and the RB pathway reduce TR limiting proteome diversity and the expression of TR proteins required for cancer cell proliferation.

Keywords: Retinoblastoma (RB) tumor suppressor; Senescence; Translation termination; Translational readthrough.


Conflict of interest statement

Competing interests The authors declare no competing or financial interests.

Figures

Fig. 1.
Fig. 1.
Readthrough is reduced in OIS. (A) Rluc (Renilla luciferase) in black is linked to Fluc (Firefly luciferase) in gray, by an intercistronic region in stripes. Rluc is the internal control of the gene, while Fluc is the readthrough sensor. A UGA codon within an artificial context or the AQP4 stop codon region is inserted in the intercistronic region (left). The expression of Fluc indicates the efficiency of readthrough. The intercistronic region from the non-readthrough control lacks the stop codon (TGA mutated by CGA) (right). (B) Immunoblots for Rluc in IMR-90 cells transduced with UGA and AQP4 reporters (Rt) or with the non-readthrough controls (No Rt), 12 days post infection. Alpha-Tubulin was used as a loading control. *, non-specific bands at 48 and 90 kDa; n=3. (C) Polysome profiles were performed 12 days post infection with an empty vector (Vector) or H-Ras V12 oncogene (H-RasV12) showing that global translation is similar in senescent and non-senescent IMR-90 cells, n=3. (D) Rluc plots indicate cap-dependent translation in IMR-90 cells with an empty vector (Vector) or with the oncogene H-Ras V12 (H-RasV12) at day 5 (D5, still proliferating), 12 (D12, senescent cells) or 20 (D20, senescent cells). Error bars indicate s.d of three independent experiments, n=3. (E) Fluc plots indicate the decrease of readthrough-dependent-translation of cells as in D. Error bars indicate s.d. of three independent experiments, n=3. (F) The percent of readthrough was calculated in cells as in D by dividing the Fluc/Rluc ratio from UGA or AQP4 luciferase reporters by the Fluc/Rluc ratio from non-readthrough controls multiplied by 100, n=3. (G) Fluc/Rluc ratios with data as in F but normalized relative to empty vector-infected cells n=3. (H) Immunoblots of H-Ras, total RB (Tot RB), total p53 (Tot p53), MCM6, phosphorylated Histone H3 on serine 10 [H3(pS10)] and tubulin at days 5, 12 and 20 post infection with an empty vector (V) or H-RasV12 oncogene (R), n=3, representative blot is shown. For panels E, F and G, significance was tested with one-way ANOVA with post-hoc Tukey HSD tests. Error bars indicate SD of three independent experiments. Tukey HSD P-values indicate that *=P<0.05 and **P<0.01.
Fig. 2.
Fig. 2.
Gentamicin-dependent translation errors are reduced in OIS and PML-induced senescence. (A) IMR-90 cells were transduced with either an empty vector (Vector) or H-RasV12 oncogene (H-RasV12), to induce OIS, and with a luciferase reporter containing either: a UGA within an artificial context, a stop codon within the natural context from AQP4 or a MMuLV programmed readthrough region for gag-pol proteins inserted in the intercistronic region of the reporter. Cells were treated with vehicle (Ctrl) or 900 μg/ml of gentamicin sulfate (Gen) for 24 h before measuring luciferase activities at day 12 post infection. Unpaired Student's t-test were performed. Error bars indicate SD of biological triplicates. *=P<0.05 is significantly different, using two-tailed Student's t-test, n=3. B-D. IMR-90 cells were transduced with pBabe-ER empty vector (pBabe-ER) or pBabe-PML-IV-ER (PML IV-ER), and with luciferase reporters UGA (B), AQP4 (C) or MMuLV (D). Cells were treated with vehicle (Ctrl) or 100 nM 4-hydroxy-tamoxifen (4-OHT), inducing or not PML-IV nuclear translocation to induce senescence. Moreover, cells were treated with vehicle or 900 μg/ml of gentamicin sulfate (Gen) for 24 h before measuring luciferase activities at day 12 post PML-IV induction. Normalized Fluc/Rluc ratios indicate the efficiency of readthrough. Normalizations are presented as means relative to empty vector-infected cells from three independent experiments with technical triplicates for each experiment, except for (C,D), which are representative of two independent experiments with similar results. B-D: One-way ANOVA with post-hoc Tukey HSD were performed. Error bars indicate SD of biological triplicates (B) or technical triplicates (C, D). Tukey HSD P-values indicate that *=P<0.05, **=P<0.01 are significantly different.
Fig. 3.
Fig. 3.
Cells that bypassed-OIS show increased readthrough. (A) RT-qPCR for H-RAS and senescent marker mRNAs were performed in IMR-90 cells at day 12 and 35 post infection with an empty vector (Vector) or H-RasV12 oncogene (H-RasV12). Data are normalized over TBP and HMBS, and presented as means relative to vector infected cells, n=3. B. Luciferase activities in non-senescent and senescent cells measured at day 12 and 35 post-infection in cells having the indicated reporters. Normalizations are presented as means relative to vector-infected cells from three independent experiments with technical triplicates for each experiment, except for UGA reporter, which are representative of two independent experiments with similar results. Error bars indicate SD of biological triplicates (AQP4, HPN, VASP) or technical triplicates (UGA). *=P<0.05, **=P<0.01 are significantly different, using two-tailed Student's t-test.
Fig. 4.
Fig. 4.
RB pathway disruption increases readthrough. (A–C) Readthrough efficiencies expressed as normalized Fluc/Rluc obtained from the luciferase reporters bearing a UGA stop codon within an artificial context (A) or a stop codon within natural contexts from either AQP4 (B) or VASP (B) that were expressed in IMR-90 cells. These cells also expressed HTERT, an empty vector (Vector) or H-RasV12 and an empty control vector (pLXSN), E6, E7 or E6/E7 oncogenes to study the readthrough efficiency in proliferating versus senescent versus transformed-like cells, n=3. (D) Relative readthrough luciferase values from IMR-90 cells transduced with the AQP4 readthrough reporter, with an empty vector (Vector) or H-RasV12 and an empty control vector (pLXSN), wild-type E7 or E7 Δ21-24 mutant oncogene. (E) IMR-90 cells were transduced with an empty vector or H-RasV12 or CDK4 and AQP4 luciferase reporters to study the readthrough efficiency variations in proliferating versus senescent versus cells overexpressing CDK4, n=3. A–E. Luciferase activities were measured in non-senescent and senescent cells at day 12 post-infection. Normalizations are presented as means relative to vector-infected cells, n=3 with technical triplicates for each experiment. One-way ANOVA with post-hoc Tukey HSD were performed. Error bars indicate SD of biological triplicates. Tukey HSD P-values indicate that *=P<0.05, **=P<0.01 are significantly different.
Fig. 5.
Fig. 5.
RB pathway activation reduces readthrough. (A,B) Normalized Fluc/Rluc ratios of IMR-90 cells transduced with luciferase reporters UGA (A) or AQP4 (B) and treated with vehicle and/or 1 μM of palbociclib (Palbo) and/or 900 μg/ml of gentamicin sulfate (Gen) for 5 days before luciferase measurements. Error bars indicate SD of three independent experiments, n=3. (C) Normalized Fluc/Rluc ratios of IMR-90 fibroblasts transduced with an empty vector (Vector) or H-RasV12 oncogene (H-RasV12) to induce OIS but cultured for 35 days until they bypassed the phenotype (D35) and with AQP4 luciferase reporter. Cells were treated with vehicle (Ctrl) or 1 μM of palbociclib (Palbo) for 5 days before measuring luciferase activities at day 35 post-infection. Normalizations are presented as means relative to vector-infected cells, n=3 with technical triplicates for each experiment. One-way ANOVA with post-hoc Tukey HSD. Error bars indicate SD of biological triplicates. Tukey HSD P-values indicate that *=P<0.05, **=P<0.01 are significantly different. (D) Growth curves of proliferating (Vector) and ras bypassed (H-RasV12 D35) IMR-90 cells treated with vehicle (Control) or 1 μM of palbociclib (Palbo) for 5 days are shown. Data are presented as means normalized to day 0 of each condition and error bars indicate SD of three independent experiments, n=3. (E) Immunoblots for total RB (Tot RB) (note: upper band represents phosphorylated RB: pRB) and alpha-tubulin from non-senescent (V D35) and ras bypassed cells (R D35) following treatments with vehicle (Ctrl) or 1 μM of palbociclib (Palbo) for 5 days. Blots are representative of three independent experiments with similar results. (F) SA-β-gal of proliferating (Vector D35) IMR-90 cells and IMR-90 cells that have by-passed the senescent stage (H-RasV12 D35) treated for 5 days with vehicle (Ctrl) or 1 μM of palbociclib (Palbo) and fixed at day 35 (D35) post-infection. Data were quantified from many fields within one experiment to represent the entire petri dish. Three independent cell counts up to a total of at least 100 cells are presented as the mean and SD of positive cells. (G) Immunoblots for indicated proteins at day 7 post infection with an empty vector (Vect), pBABE-RPS14(WT)-Myc (RPS14) or pBABE-RPL22(WT)-Myc (RPL22): Myc (Myc-tag), total RB [RB (tot)], MCM6, phosphorylated H3 on serine 10 [H3(pS10)], total p53 [p53(tot)] and alpha-tubulin. Blots are representative of three independent experiments with similar results. (H,I) Normalized Fluc/Rluc ratios of IMR-90 cells transduced with an empty vector (Vector), or pBABE-RPS14(WT)-Myc (RPS14, H), or pBABE-RPL22(WT)-Myc (RPL22, I), and with the luciferase reporter AQP4. Luciferase activities were measured at days 7, 12 and 14 post infection. Normalizations are presented as means relative to vector-infected cells, n=3 with technical triplicates for each experiment Unpaired t-tests with equal s.d. were performed. Error bars indicate SD of biological triplicates. *=P<0.05, **=P<0.01, ***=P<0.001 are significantly different, using two-tailed Student's t-test. (J) Schema showing the RB activation/inhibition factors that modulate readthrough.
Fig. 6.
Fig. 6.
Therapy-induced senescence reduces readthrough in cancer cells. (A) SA-β-gal staining of PC-3 cells treated 24 h with vehicle and/or 100 nM of camptothecin and fixed 7 days later (day 7), the percent positive cells ±SD is shown in lower corner, n=3. (B) Immunoblots in PC-3 cells transduced with luciferase reporter (AQP4, UGA) and treated as in A for the proteins: RB(pS795) [phosphorylated RB on serine 795], MCM6, H3(pS10) [phosphorylated H3 on serine 10] and tubulin. Blots are representative of three independent experiments with similar results. (C) Normalized Fluc/Rluc ratios of indicated readthrough reporters in cells as in A. Normalizations are presented as means relative to vehicle treated cells from (UGA) n=4 and (AQP4) n=5 independent experiments each with technical triplicates. (D) Normalized Fluc/Rluc ratios in of MDA.MB.231 cells transduced with the luciferase reporters (UGA, AQP4) and treated as in A. Normalizations are presented as means relative to vehicle treated cells, n=3. (E) Immunoblots for phosphorylated RB at serine 795 [RB(pS795)], MCM6 and tubulin in cells as in D, n=3. (F) Normalized Fluc/Rluc ratios of indicated readthrough reporters in PC-3 cells as in A, 21 days post-treatment when the cell population bypassed senescence. For all luciferase assays, n=3, error bars indicate SD of technical triplicates of each experiment. *=P<0.05, **=P<0.01, ***=P<0.001 using two-tailed Student's t-test. (G) Immunoblots for phosphorylated RB at serine 795 [RB(pS795)] and tubulin in cells as in E, n=3.
Fig. 7.
Fig. 7.
Senescence affects endogenous TR target AGO1x. (A) Images of senescence-associated β galactosidase assay and its quantification in MDA.MB.231 treated with 40 nM camptothecin (therapy-induced senescence (TIS)) or Vehicle (control) for 96 h. Data shows mean of three biological replicates and error bars show SD Students-t-test was performed and P value is indicated. (B) Relative mRNA levels of indicated mRNA in cells as in A. Data shows mean of three biological replicates and error bars show SD Students-t-test was performed and P value is indicated. (C) Immunofluorescence of AGO1x in MDA.MB.231 cells that were treated with 40 nM camptothecin (TIS) or Vehicle (control) or cells that were treated with camptothecin and left to recover for 14 days to allow bypass of senescence (Bypass of TIS). Scale bar=50 µm. A representative image of three biological replicates is shown. D. Quantification of results in (C). A minimum of 50 cells were scored for nuclear staining intensity using Image J. Statistical analysis was performed by ANOVA with Tukey post-test. A.U., arbitrary units. (E) Immunofluorescence of KI67 from MDA.MB.231 cells treated as in C. Scale bar=50 µm. A representative image of three biological replicates is shown. (F) Quantification of the percentage of cells expressing Ki67 shown in E. Statistical analysis was performed by ANOVA with Tukey post-test. (G) Immunoblot against the indicated proteins in MDA.MB.231 cells treated as in C. H3(pS10): phosphorylated Histone H3 at serine 10, and γH2AX: phosphorylated at serine 139 of histone H2AX variant. (H) Regulation of readthrough in senescent cells.

References

    1. Acevedo, M., Vernier, M., Mignacca, L., Lessard, F., Huot, G., Moiseeva, O., Bourdeau, V. and Ferbeyre, G. (2016). A CDK4/6-dependent epigenetic mechanism protects cancer cells from PML-induced senescence. Cancer Res. 76, 3252-3264. 10.1158/0008-5472.CAN-15-2347 - DOI - PubMed
    1. Ajore, R., Raiser, D., McConkey, M., Joud, M., Boidol, B., Mar, B., Saksena, G., Weinstock, D. M., Armstrong, S., Ellis, S. R.et al. (2017). Deletion of ribosomal protein genes is a common vulnerability in human cancer, especially in concert with TP53 mutations. EMBO Mol. Med. 9, 498-507. 10.15252/emmm.201606660 - DOI - PMC - PubMed
    1. Baradaran-Heravi, A., Balgi, A. D., Zimmerman, C., Choi, K., Shidmoossavee, F. S., Tan, J. S., Bergeaud, C., Krause, A., Flibotte, S., Shimizu, Y.et al. (2016). Novel small molecules potentiate premature termination codon readthrough by aminoglycosides. Nucleic Acids Res. 44, 6583-6598. 10.1093/nar/gkw638 - DOI - PMC - PubMed
    1. Beissel, C., Neumann, B., Uhse, S., Hampe, I., Karki, P. and Krebber, H. (2019). Translation termination depends on the sequential ribosomal entry of eRF1 and eRF3. Nucleic Acids Res. 47, 4798-4813. 10.1093/nar/gkz177 - DOI - PMC - PubMed
    1. Belin, S., Beghin, A., Solano-Gonzalez, E., Bezin, L., Brunet-Manquat, S., Textoris, J., Prats, A. C., Mertani, H. C., Dumontet, C. and Diaz, J. J. (2009). Dysregulation of ribosome biogenesis and translational capacity is associated with tumor progression of human breast cancer cells. PLoS ONE 4, e7147. 10.1371/journal.pone.0007147 - DOI - PMC - PubMed

Publication types