Clinical Trial
. 2022 Jan;52(1):138-148.
doi: 10.1002/eji.202149575. Epub 2021 Nov 17.

Altered increase in STAT1 expression and phosphorylation in severe COVID-19

Affiliations
Clinical Trial

Altered increase in STAT1 expression and phosphorylation in severe COVID-19

Hector Rincon-Arevalo et al. Eur J Immunol. 2022 Jan.

Abstract

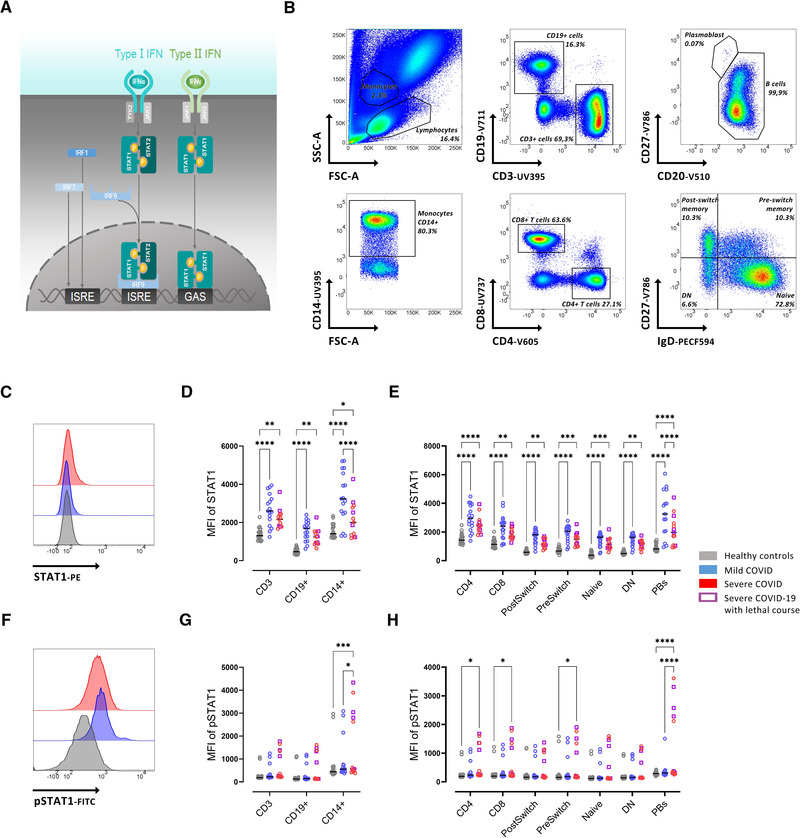
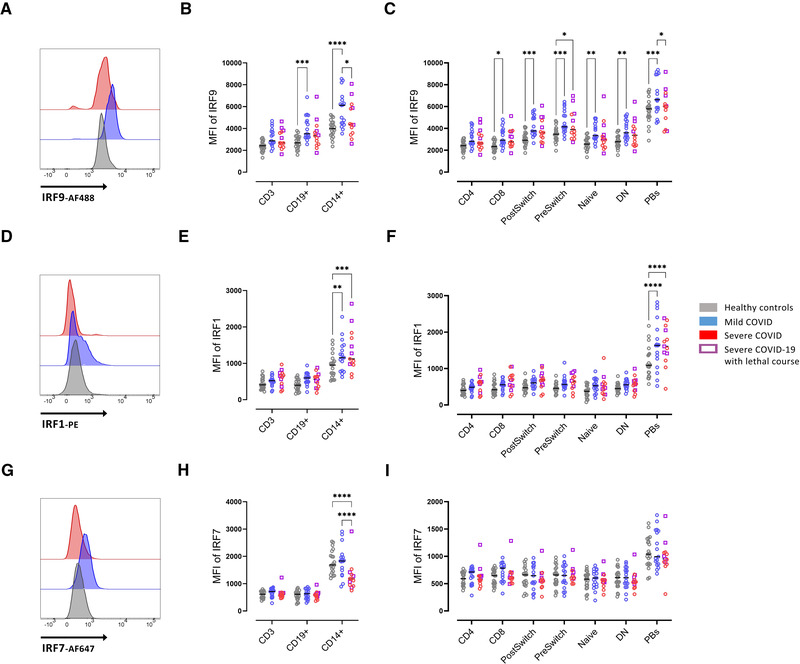
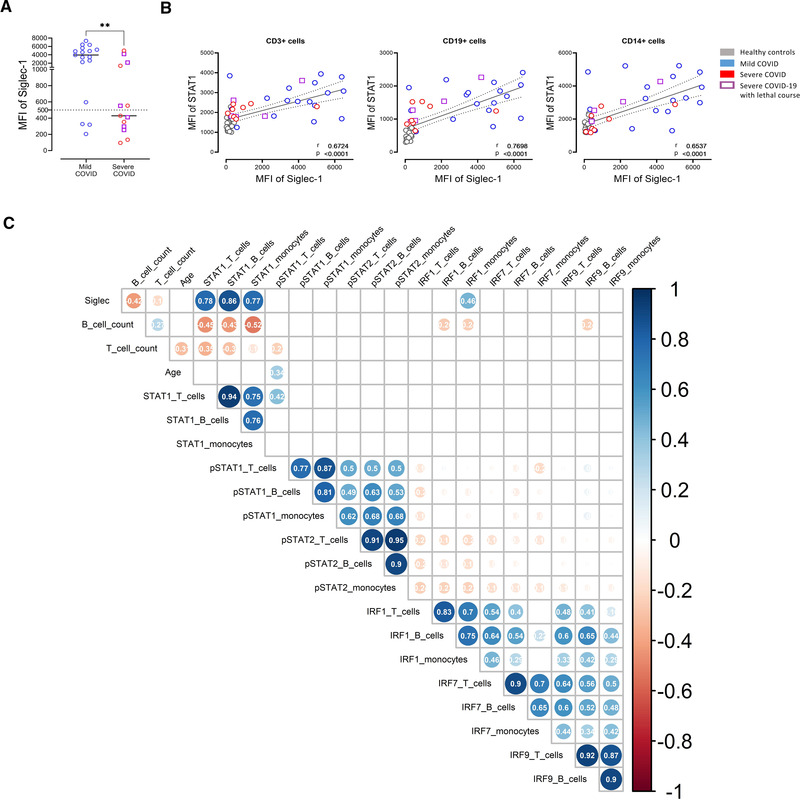
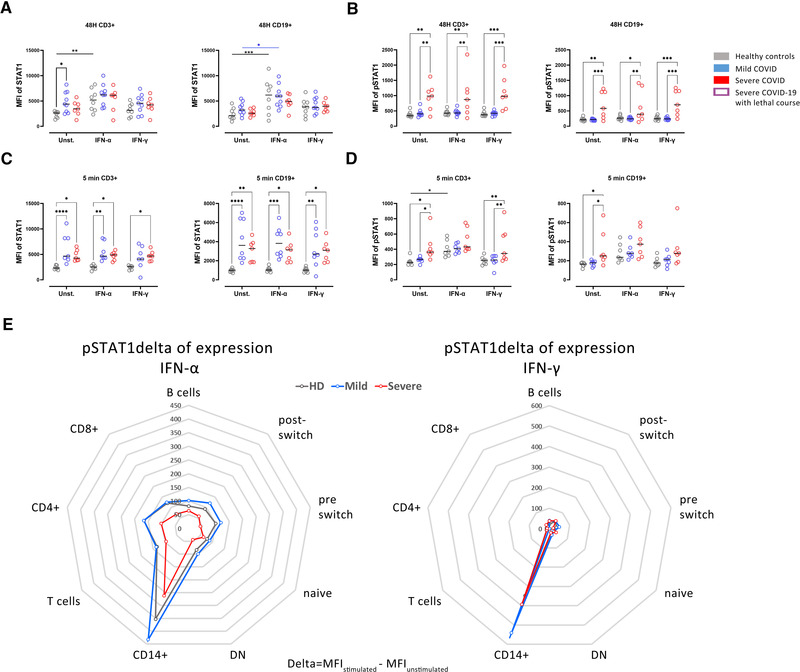
The interferon pathway, a key antiviral defense mechanism, is being considered as a therapeutic target in COVID-19. Both, substitution of interferon and JAK/STAT inhibition to limit cytokine storms have been proposed. However, little is known about possible abnormalities in STAT signaling in immune cells during SARS-CoV-2 infection. We investigated downstream targets of interferon signaling, including STAT1, STAT2, pSTAT1 and 2, and IRF1, 7 and 9 by flow cytometry in 30 patients with COVID-19, 17 with mild, and 13 with severe infection. We report upregulation of STAT1 and IRF9 in mild and severe COVID-19 cases, which correlated with the IFN-signature assessed by Siglec-1 (CD169) expression on peripheral monocytes. Interestingly, Siglec-1 and STAT1 in CD14+ monocytes and plasmablasts showed lower expression among severe cases compared to mild cases. Contrary to the baseline STAT1 expression, the phosphorylation of STAT1 was enhanced in severe COVID-19 cases, indicating a dysbalanced JAK/STAT signaling that fails to induce transcription of interferon stimulated response elements (ISRE). This abnormality persisted after IFN-α and IFN-γ stimulation of PBMCs from patients with severe COVID-19. Data suggest impaired STAT1 transcriptional upregulation among severely infected patients may represent a potential predictive biomarker and would allow stratification of patients for certain interferon-pathway targeted treatments.

Keywords: COVID-19; IRF9; STAT1; Type I interferon; pSTAT1.


Conflict of interest statement

The authors declare no conflict of interest.

Figures

Figure 1
Figure 1
Reduced STAT1 expression in severe COVID‐19 patients. (A) Schematic depiction of JAK/STAT signaling. (B) Gating strategy on whole blood flow cytometry for IgD+CD27‐ (Naïve), IgD+CD27+ (PreSwitch), IgD‐CD27+ (PostSwitched), and IgD‐CD27‐ (Double Negative, DN) as well as CD4+ and CD8+ T cells. (C) Representative histograms of baseline expression of STAT1 on B cells from healthy controls (grey), mild (blue), and severe (red) COVID‐19 patients.  (D) Median fluorescence intensity (MFI) of STAT1 in CD3+, CD19+, and CD14+ cells.  (E) MFI of STAT1 in T‐ and B‐ cell subsets (as described in B). (F) Representative histograms of baseline expression of pSTAT1 on B cells from healthy controls (grey), mild (blue), and severe (red) COVID‐19 patients. (G) MFI of STAT1 in CD3+, CD19+, and CD14+ cells. (H) MFI of pSTAT1 in T‐ and B‐cell subsets (as described in B). Median and data from healthy controls (n = 20), mild COVID‐19 (n = 17), and severe COVID‐19 (n = 13) patients. (B‐H) Data shown are representative from nine independent experiments. Two‐way ANOVA with Sidack post‐test. *p < 0.05, **p < 0.01, ***p < 0.001, and ****p < 0.0001. Deceased patients are indicated as purple quadrats
Figure 2
Figure 2
Enhanced intracellular IRF9 expression in severe COVID‐19. (A) Representative histograms of baseline expression of IRF9 on B cells from healthy controls (grey), mild (blue), and severe (red) COVID‐19 patients. (B) Median fluorescence intensity (MFI) of IRF9 in CD3+, CD19+, and CD14+ cells.  (C) MFI of IRF9 in T‐ and B‐cell subsets (as described in Fig. 1B).  (D) Representative histograms of baseline expression of IRF1 on B cells healthy controls (grey), mild (blue) and severe (red) COVID‐19 patients. (E) MFI of IRF1 in CD3+, CD19+, and CD14+ cells. (F) MFI of IRF1 in T‐ and B‐cell subsets (as described in Fig. 1B). (G) Representative histograms of baseline expression of IRF7 on B cells from healthy controls (grey), mild (blue), and severe (red) COVID‐19 patients. (H) MFI of IRF7 in CD3+, CD19+, and CD14+ cells. (I) MFI of IRF7 in T‐ and B‐cell subsets (as described in Fig. 1B). Median and data from healthy controls (n = 20), mild COVID‐19 (n = 17), and severe COVID‐19 (n = 13) patients. (A‐I) Data shown are representative from nine independent experiments. Two‐way ANOVA with Sidack post‐test. *p < 0.05, **p < 0.01, ***p < 0.001, and ****p < 0.0001. Deceased patients are indicated as purple quadrats
Figure 3
Figure 3
Significant correlation of STAT1 and Siglec‐1 (CD169). (A) Siglec‐1 (CD169) expression on CD14+ monocytes in mild and severe COVID‐19 patients. (B) Correlation of Siglec‐1 expression on the surface of CD14+ monocytes with intracellular STAT1 expression in CD3+ T cells, CD19+ B cells, or CD14 + monocytes. Each point represents a donor. Mann–Whitney U test. *p < 0.05, **p < 0.01. (C) Spearman´s correlation matrix showing the correlation of all investigated parameters (STAT1, pSTAT1, pSTAT2, IRF1, IRF7, and IRF9) in relation to the analyzed cell populations (B cells, T cells, and monocytes). Corresponding correlations are represented by red (negative) or blue (positive) circles. Size and intensity of color refer to the strength of correlation. Data from healthy controls (n = 20), mild COVID‐19 (n = 17), and severe COVID‐19 (n = 13) patients.  (A‐C) Data shown are representative from nine independent experiments. Only correlations with p ≤ 0.05 are indicated. Deceased patients are indicated as purple quadrats
Figure 4
Figure 4
Attenuated pSTAT1 response upon IFN type I and II stimulation in severe COVID‐19. (A) STAT1 and (B) pSTAT1 expression in CD3+ T cells and CD19+ B cells in culture of PBMCs from healthy controls (grey, n = 8), mild (blue, n = 9), or severe (red, n = 7) COVID‐19 patients. Cells were stimulated for 48 h with either IFN‐α (5 ng/mL) or IFN‐γ (5 ng/mL), or only RPMI as a control. (C) STAT1 and (D) pSTAT1 expression in PBMCs of the same donors as in (A) stimulated with IFN‐α (100 ng/mL) or IFN‐γ (100 ng/mL) for 5 min. (E) Delta of pSTAT1 expression in cell populations after stimulation with IFN‐α (left) or IFN‐γ (right) for 5 min in the three study groups. Untreated control values of pSTAT1 were subtracted to show the individual increase of STAT1 phosphorylation. Data are presented as radar diagrams. Two‐way ANOVA with Sidack post‐test. *p < 0.05, **p < 0.01, ***p < 0.001, and ****p < 0.0001

Similar articles

Cited by

References

    1. Platanias, L. C. , Mechanisms of type‐I‐ and type‐II‐interferon‐mediated signalling. Nat. Rev. Immunol. 2005. 5: 375–386. - PubMed
    1. Vivier, E. , Tomasello, E. , Baratin, M. , Walzer, T. and Ugolini, S. , Functions of natural killer cells. Nat. Immunol. 2008. 9: 503–510. - PubMed
    1. Bonjardim, C. A. , Interferons (IFNs) are key cytokines in both innate and adaptive antiviral immune responses–and viruses counteract IFN action. Microbes Infect. 2005. 7: 569–578. - PubMed
    1. Bastard, P. , Rosen, L. B. , Zhang, Q. , Michailidis, E. , Hoffmann, H. H. , Zhang, Y. , Dorgham, K. et al., Autoantibodies against type I IFNs in patients with life‐threatening COVID‐19. Science 2020. 370: eabd4585. - PMC - PubMed
    1. Zhang, Q. , Bastard, P. , Liu, Z. , Le Pen, J. , Moncada‐Velez, M. , Chen, J. , Ogishi, M. et al., Inborn errors of type I IFN immunity in patients with life‐threatening COVID‐19. Science 2020. 370: eabd4570. - PMC - PubMed

Publication types

Substances