. 2022 Jan;31(1):187-208.
doi: 10.1002/pro.4213. Epub 2021 Nov 6.

RCSB Protein Data Bank: Celebrating 50 years of the PDB with new tools for understanding and visualizing biological macromolecules in 3D

Affiliations

RCSB Protein Data Bank: Celebrating 50 years of the PDB with new tools for understanding and visualizing biological macromolecules in 3D

Stephen K Burley et al. Protein Sci. 2022 Jan.

Abstract

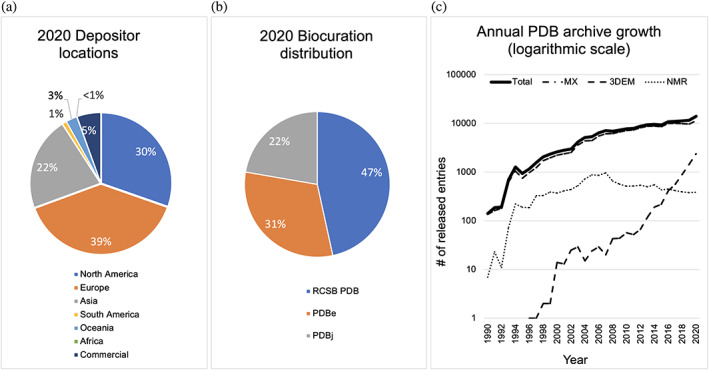
The Research Collaboratory for Structural Bioinformatics Protein Data Bank (RCSB PDB), funded by the US National Science Foundation, National Institutes of Health, and Department of Energy, has served structural biologists and Protein Data Bank (PDB) data consumers worldwide since 1999. RCSB PDB, a founding member of the Worldwide Protein Data Bank (wwPDB) partnership, is the US data center for the global PDB archive housing biomolecular structure data. RCSB PDB is also responsible for the security of PDB data, as the wwPDB-designated Archive Keeper. Annually, RCSB PDB serves tens of thousands of three-dimensional (3D) macromolecular structure data depositors (using macromolecular crystallography, nuclear magnetic resonance spectroscopy, electron microscopy, and micro-electron diffraction) from all inhabited continents. RCSB PDB makes PDB data available from its research-focused RCSB.org web portal at no charge and without usage restrictions to millions of PDB data consumers working in every nation and territory worldwide. In addition, RCSB PDB operates an outreach and education PDB101.RCSB.org web portal that was used by more than 800,000 educators, students, and members of the public during calendar year 2020. This invited Tools Issue contribution describes (i) how the archive is growing and evolving as new experimental methods generate ever larger and more complex biomolecular structures; (ii) the importance of data standards and data remediation in effective management of the archive and facile integration with more than 50 external data resources; and (iii) new tools and features for 3D structure analysis and visualization made available during the past year via the RCSB.org web portal.

Keywords: Mol*; PDB; Protein Data Bank; RCSB Protein Data Bank; Worldwide Protein Data Bank; electron microscopy; macromolecular crystallography; micro-electron diffraction; open access; web-native molecular graphics.


Figures

FIGURE 1
FIGURE 1
PDB data deposition and release metrics. (a) Depositor geographic locations in 2020. (b) Structure deposition processing by wwPDB regional data centers in 2020. (c) Annual rates of PDB archive growth (logarithmic scale) for 3DEM (dashed line), NMR (dotted line), MX (dashed‐dotted line), and all methods (total, solid line)
FIGURE 2
FIGURE 2
Exploring PDB structures of spike proteins from SARS‐CoV‐2 variants. (a) Colored ribbon drawing representation of the spike protein trimer (individual polypeptide chains are depicted with different colors, and attached carbohydrates are depicted as atomic stick figures; PDB ID 6vxx). (b) Locations of selected substitutions seen in the Delta variant (T95, G142, A222, L417, L452‐labeled, and D950) are indicated with red hemispheres. (c) Close up view of L452 in the structure of the ACE2‐binding domain of the original viral isolate (PDB ID 7ora). (d) Close up view of R452 in a structure of the R452 variant (PDB ID 7orb). (Atom color coding: C‐green or dark yellow; N‐blue; O‐red)
FIGURE 3
FIGURE 3
RCSB.org web portal exploration of a glycosylated form of SARS‐CoV‐2 spike protein D614G variant (PDB ID 7krr). (a) Oligosaccharide section of the SSP for PDB ID 7krr. (b) Mol* 3D interaction view of the corresponding oligosaccharide in 3D SNFG representation (two blue cubes) at a glycosylation site in the vicinity of the location of a common amino acid substitution (residue 614). The protein is shown with green ribbon representation. Amino acid G614 and nearby residues are shown in ball‐and‐stick representation. (Atom color coding: C‐green or orange, denoting the neighboring spike protein; N‐blue; O‐red; S‐yellow)
FIGURE 4
FIGURE 4
Structure motif search for SARS‐CoV‐2 main protease active site residues (PDB ID 6lu7). (a) Query construction using the Mol* GUI. (b) Query construction using the Advanced Search Query Builder. (c) 3D visualization of a structure motif search hit using Mol*
FIGURE 5
FIGURE 5
jFATCAT‐flexible 3D comparison and alignment of SARS‐CoV (PDB ID 5x5b, Chain A; orange) with SARS‐CoV‐2 (PDB ID 6vsb, Chain A; blue) spike protein structures
FIGURE 6
FIGURE 6
SSP for a SARS‐CoV E protein (PDB ID 5x29) (left) with a view of the homopentamer looking down the molecular pore and Mol* visualization with predicted membrane location depicted using pink circles with dashed grey border (right). Each E protein monomer is shown in ribbon representation (color coded by hydrophobicity: dark green hydrophobic, dark red polar) and viewed nearly parallel to the plane of the membrane bilayer with the extracellular portion of each monomer in the upper portion of the image
FIGURE 7
FIGURE 7
Chemical Attribute searching from the Advanced Search Query Builder. The executed. Search (upper) identified 33 peptide‐like ligands similar to ligand PRD_002214 occurring in PDB ID 7lb7 (lower). N.B.: Result count from search includes ligand PRD_002214. Search results can be narrowed by selecting from the “Refinements” menu (lower left, red box)
FIGURE 8
FIGURE 8
Examining the 3D structure of a SARS‐CoV‐2 papain‐like proteinase enzyme inhibitor (CCD ID TTT) in PDB ID 7jir. (left) Mol* view generated by clicking on the “Ligand Interaction” button (right). Portions of the macromolecule in the neighborhood of the ligand/inhibitor are shown using ribbon representation (green), while residues participating in non‐covalent interactions within 5 Å of the ligand/inhibitor are shown in ball‐and‐stick representation with the ligand denoted by the presence of a light green halo surround. (Atom color coding: C‐green; N‐blue; O‐red; S‐light yellow.) Mol* view of ligand TTT, displaying a 2|Fobserved|‐|Fcalculated| difference electron density map as a mesh, contoured at 1.5σ. Carbon atoms of the ligand are colored dark yellow for ease of visualization. Non‐covalent interactions between the ligand and protein are highlighted with dashed lines. (Interaction color coding: Hydrogen bonds‐blue; ππ Interactions: dark yellow‐light green)
FIGURE 9
FIGURE 9
Understanding ligand TTT quality in five coronavirus papain‐like proteinase structures. (upper) Each 2D graph has color coded ranking scales from worst (0%, red) to best (100%, blue) for ligand experimental data fitting quality (horizontal axis) and ligand geometry quality (vertical axis). Each symbol represents an Instance of ligand TTT, showing experimental data fitting quality (horizontal) and denoting geometry quality (vertical). The green diamond symbol in each plot indicates the best‐fitted Instance of ligand TTT in PDB ID 7jir, corresponding to the green‐highlighted row of the tabular report (lower), detailing ligand quality metrics and related information for each instance of ligand TTT. Other rows of the tabular report highlighted in yellow and gray correspond to the same‐color circle symbols in the Upper Middle and Upper Right 2D graphs
FIGURE 10
FIGURE 10
Use of the Chemical Sketch Tool exemplified with CCD ID TTT [5‐amino‐2‐methyl‐N‐[(1R)‐1‐naphthalen‐1‐ylethyl]benzamide]. The Search box at the bottom of the Chemical Sketch Tool page enables single click searching of the PDB archive using various search criteria with either InChI or SMILES chemical descriptors
FIGURE 11
FIGURE 11
RCSB.org Browse Annotations page showing SCOP2 annotations integrated with large numbers of PDB structures
FIGURE 12
FIGURE 12
RCSB.org Structure Summary Annotations page showing immunology‐related annotations [IMGT and SAbDab] for PDB ID 1igy

References

    1. Protein Data Bank . Crystallography: Protein data bank. Nat New Biol. 1971;233:223–223. - PubMed
    1. Berman HM, Henrick K, Nakamura H. Announcing the worldwide protein data bank. Nat Struct Biol. 2003;10:980. - PubMed
    1. wwPDB consortium . Protein data bank: The single global archive for 3D macromolecular structure data. Nucleic Acids Res. 2019;47:D520–D528. - PMC - PubMed
    1. Berman HM, Westbrook J, Feng Z, et al. The protein data bank. Nucleic Acids Res. 2000;28:235–242. - PMC - PubMed
    1. Burley SK, Bhikadiya C, Bi C, et al. RCSB protein data bank: Powerful new tools for exploring 3D structures of biological macromolecules for basic and applied research and education in fundamental biology, biomedicine, biotechnology, bioengineering, and energy sciences. Nucleic Acids Res. 2021;49:D437–D451. - PMC - PubMed

Publication types

MeSH terms