. 2022 Jan;34(2):e2100096.
doi: 10.1002/adma.202100096. Epub 2021 Nov 14.

Extracellular Matrix in Synthetic Hydrogel-Based Prostate Cancer Organoids Regulate Therapeutic Response to EZH2 and DRD2 Inhibitors

Affiliations

Extracellular Matrix in Synthetic Hydrogel-Based Prostate Cancer Organoids Regulate Therapeutic Response to EZH2 and DRD2 Inhibitors

Matthew J Mosquera et al. Adv Mater. 2022 Jan.

Abstract

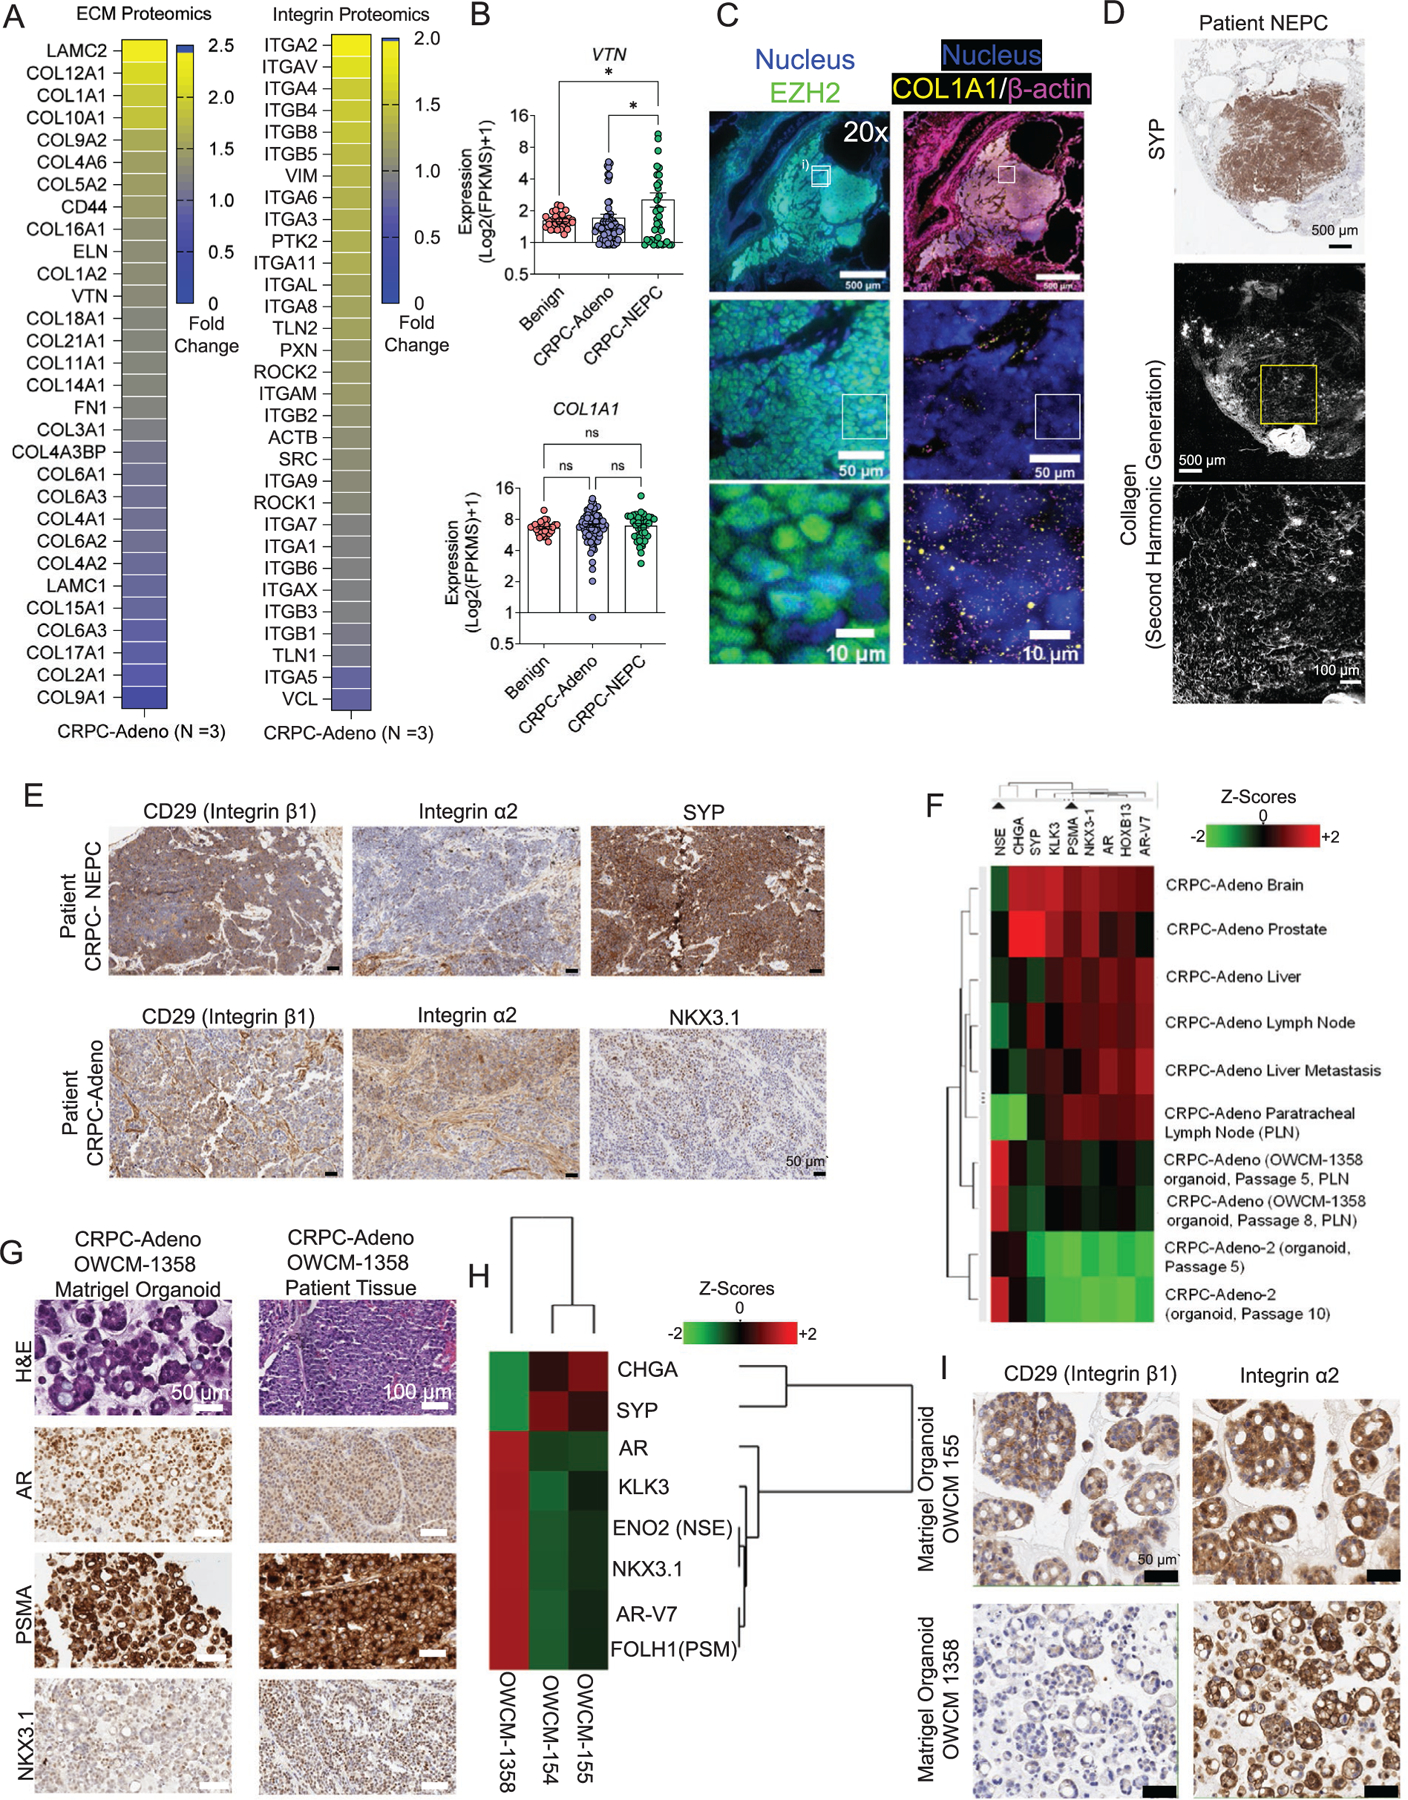
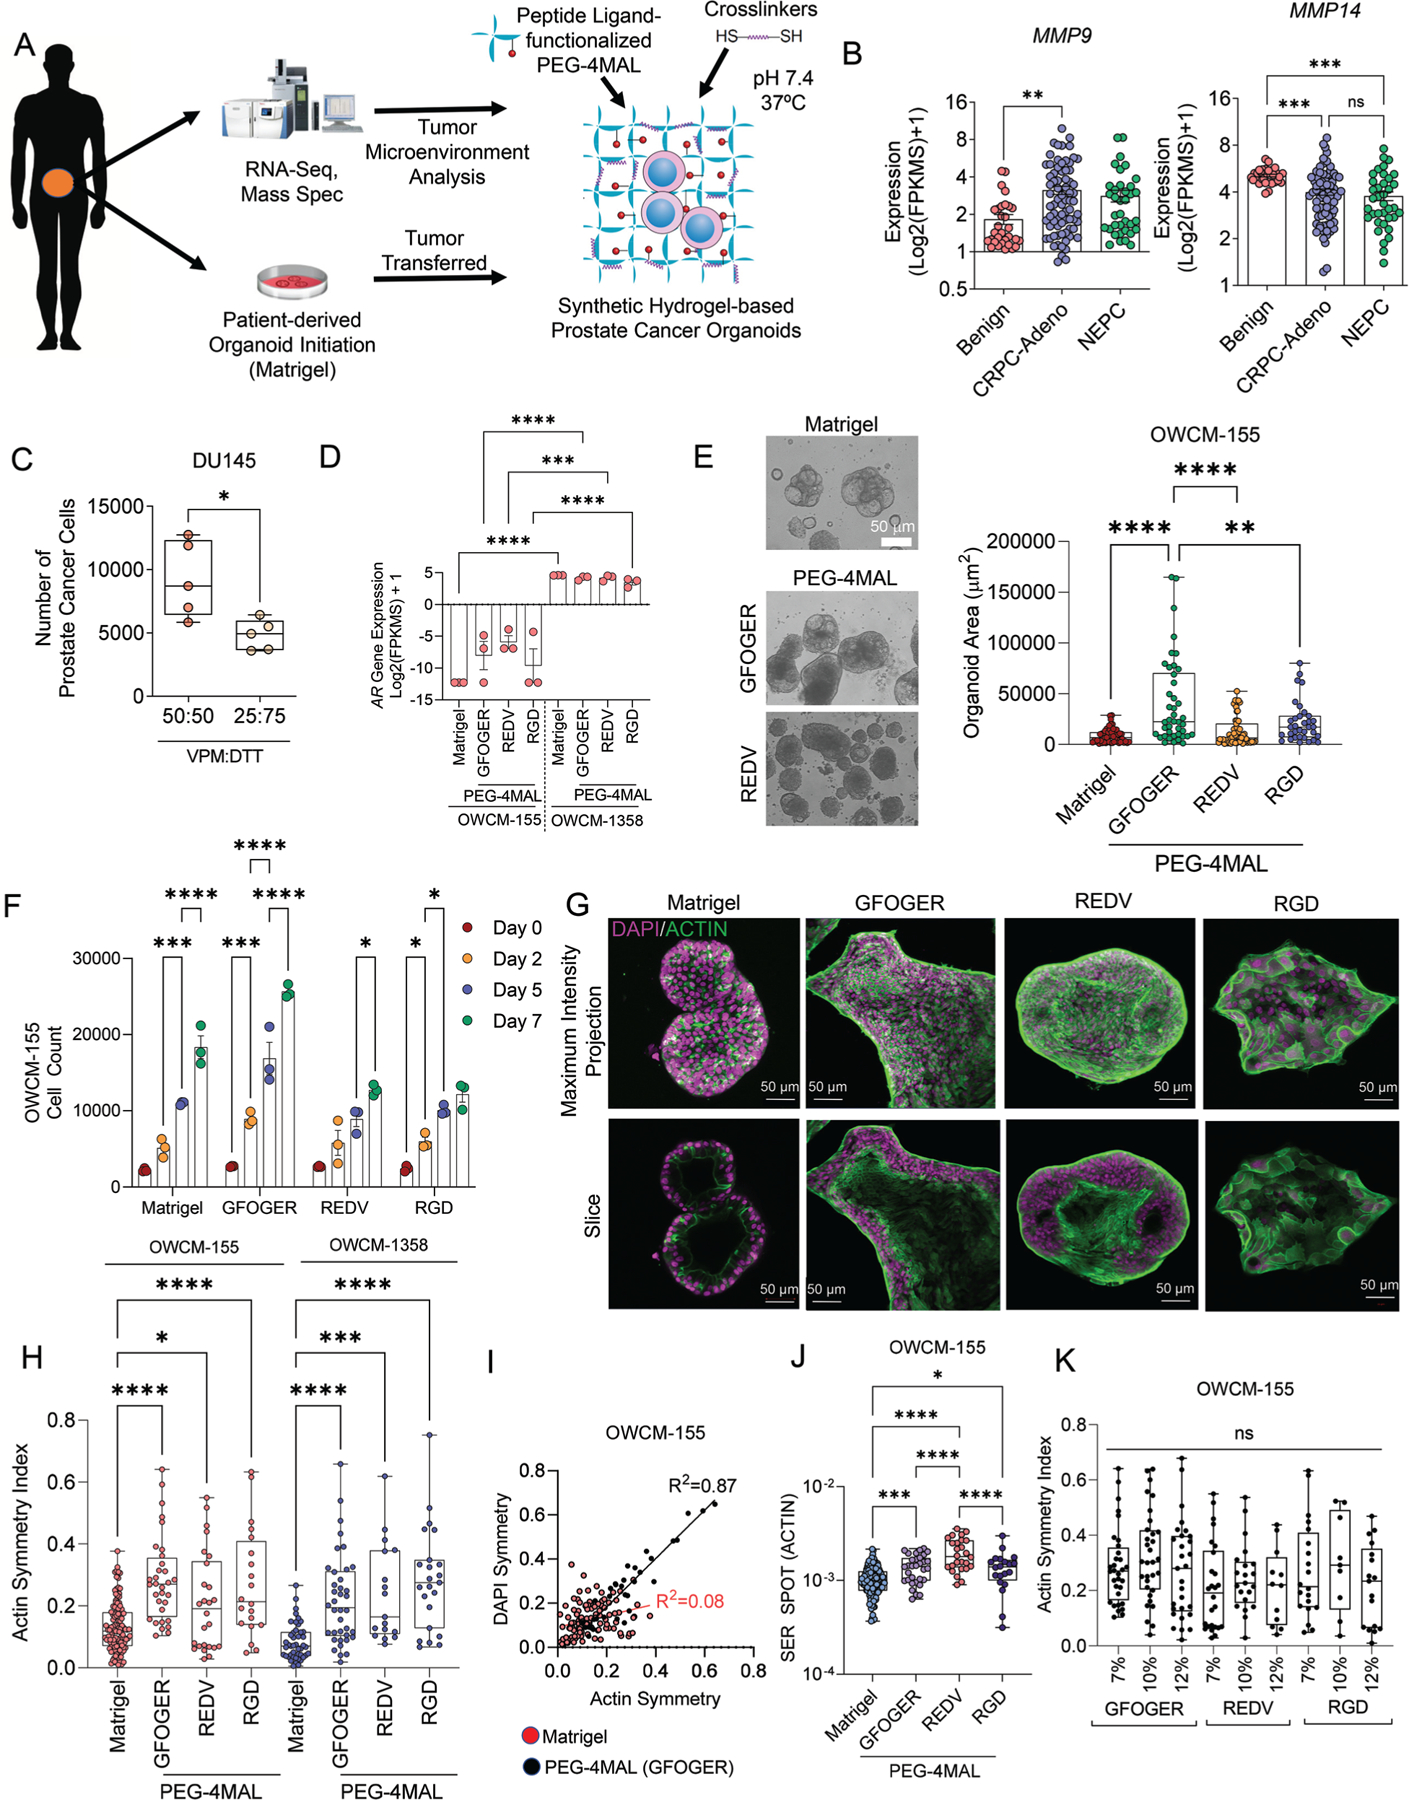
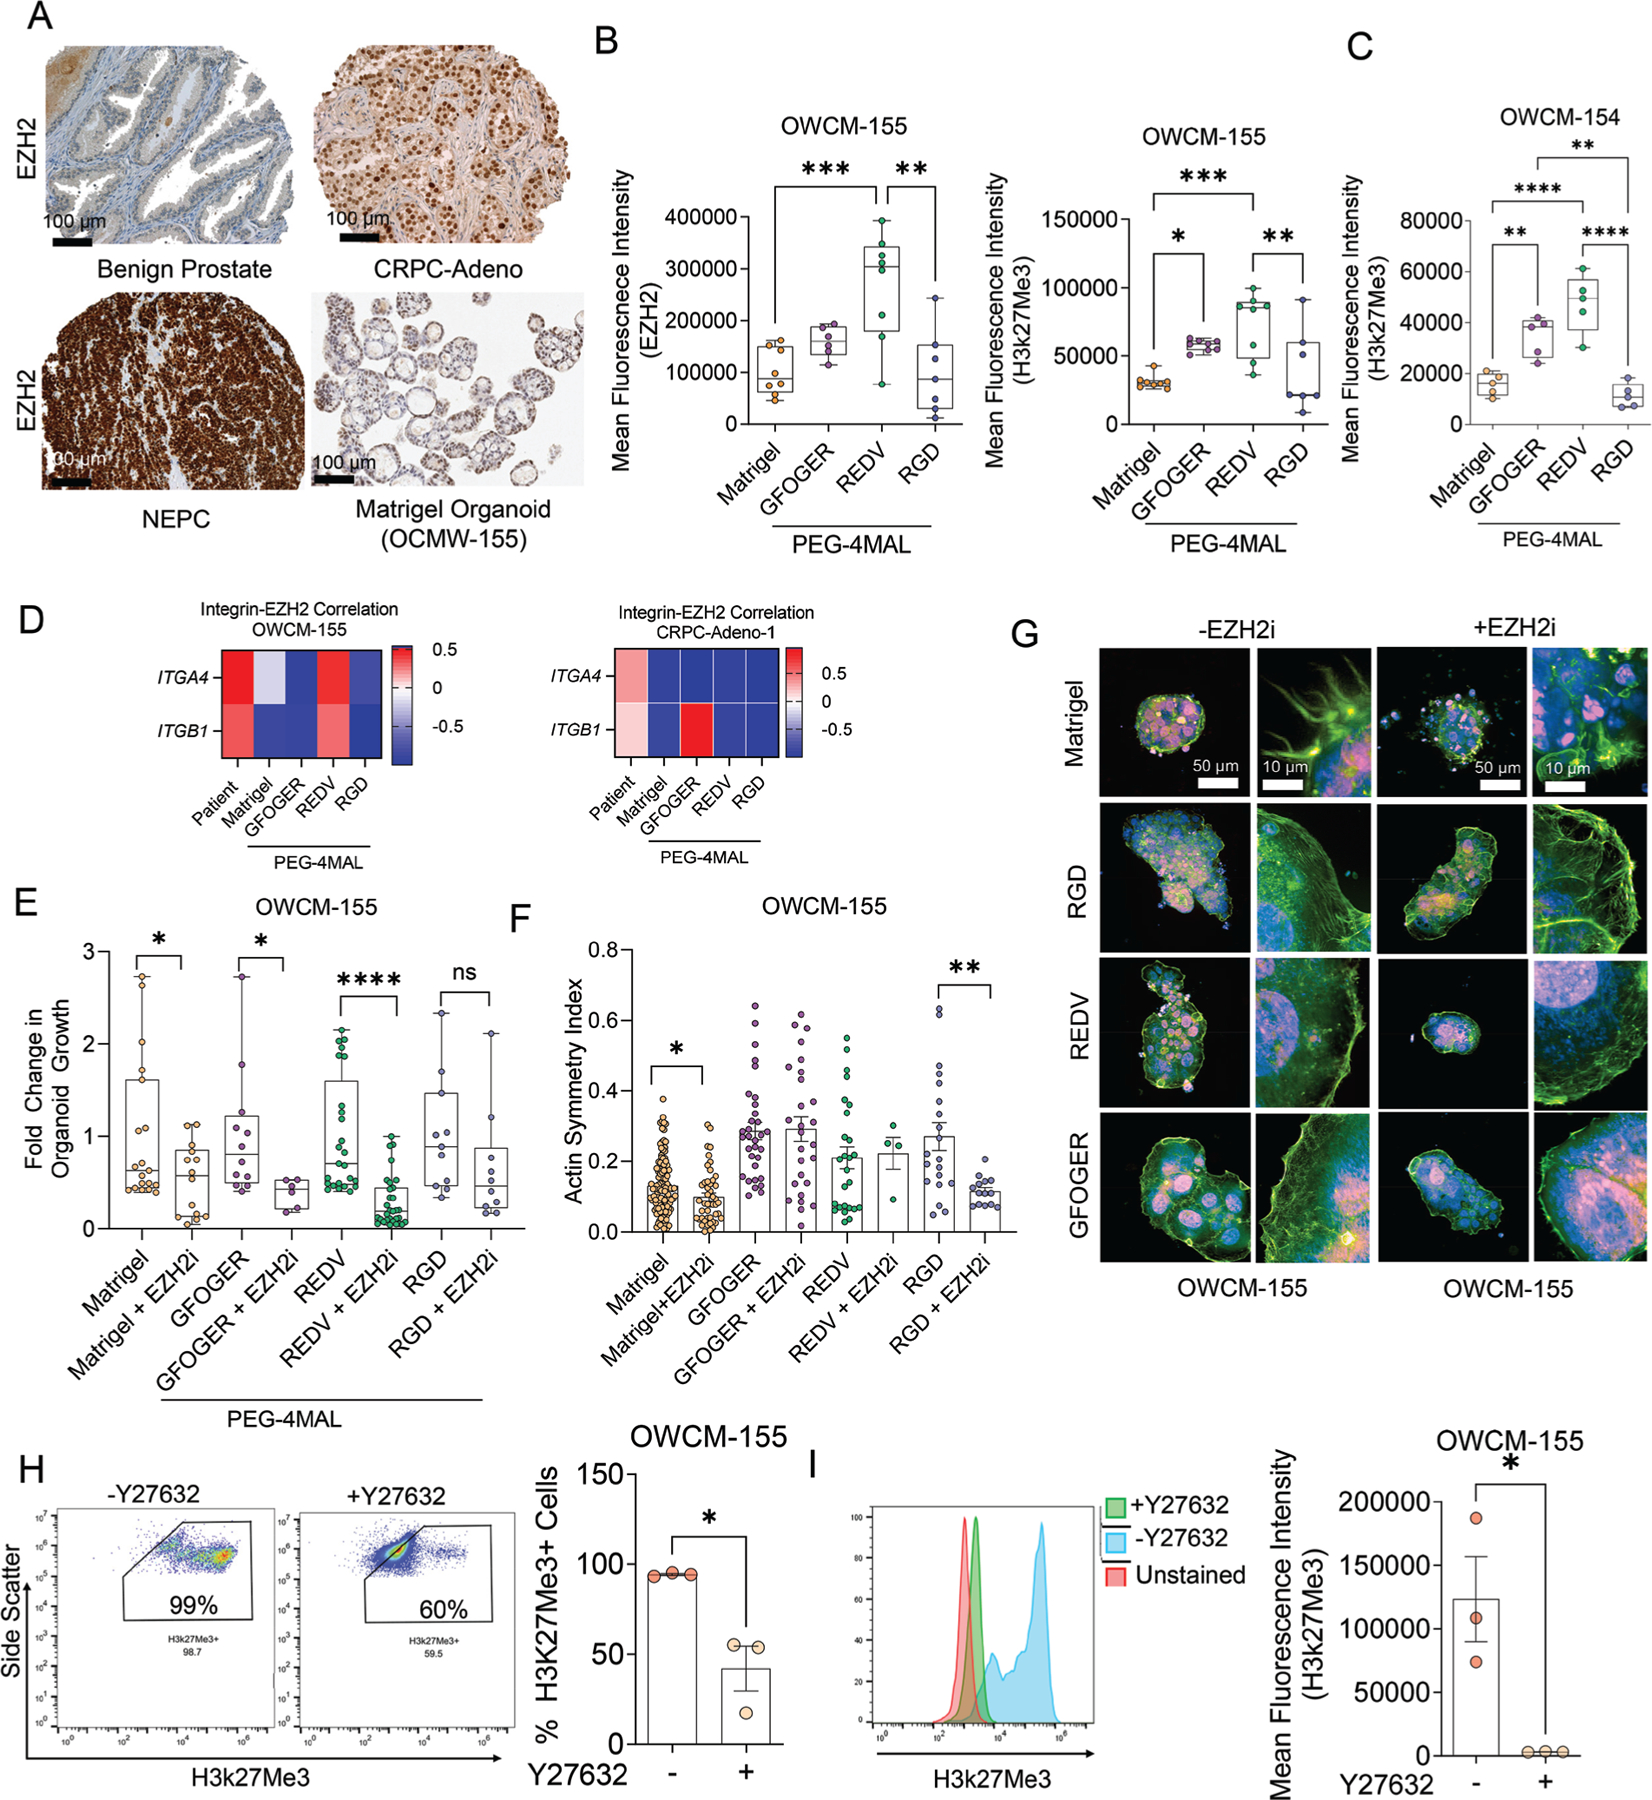
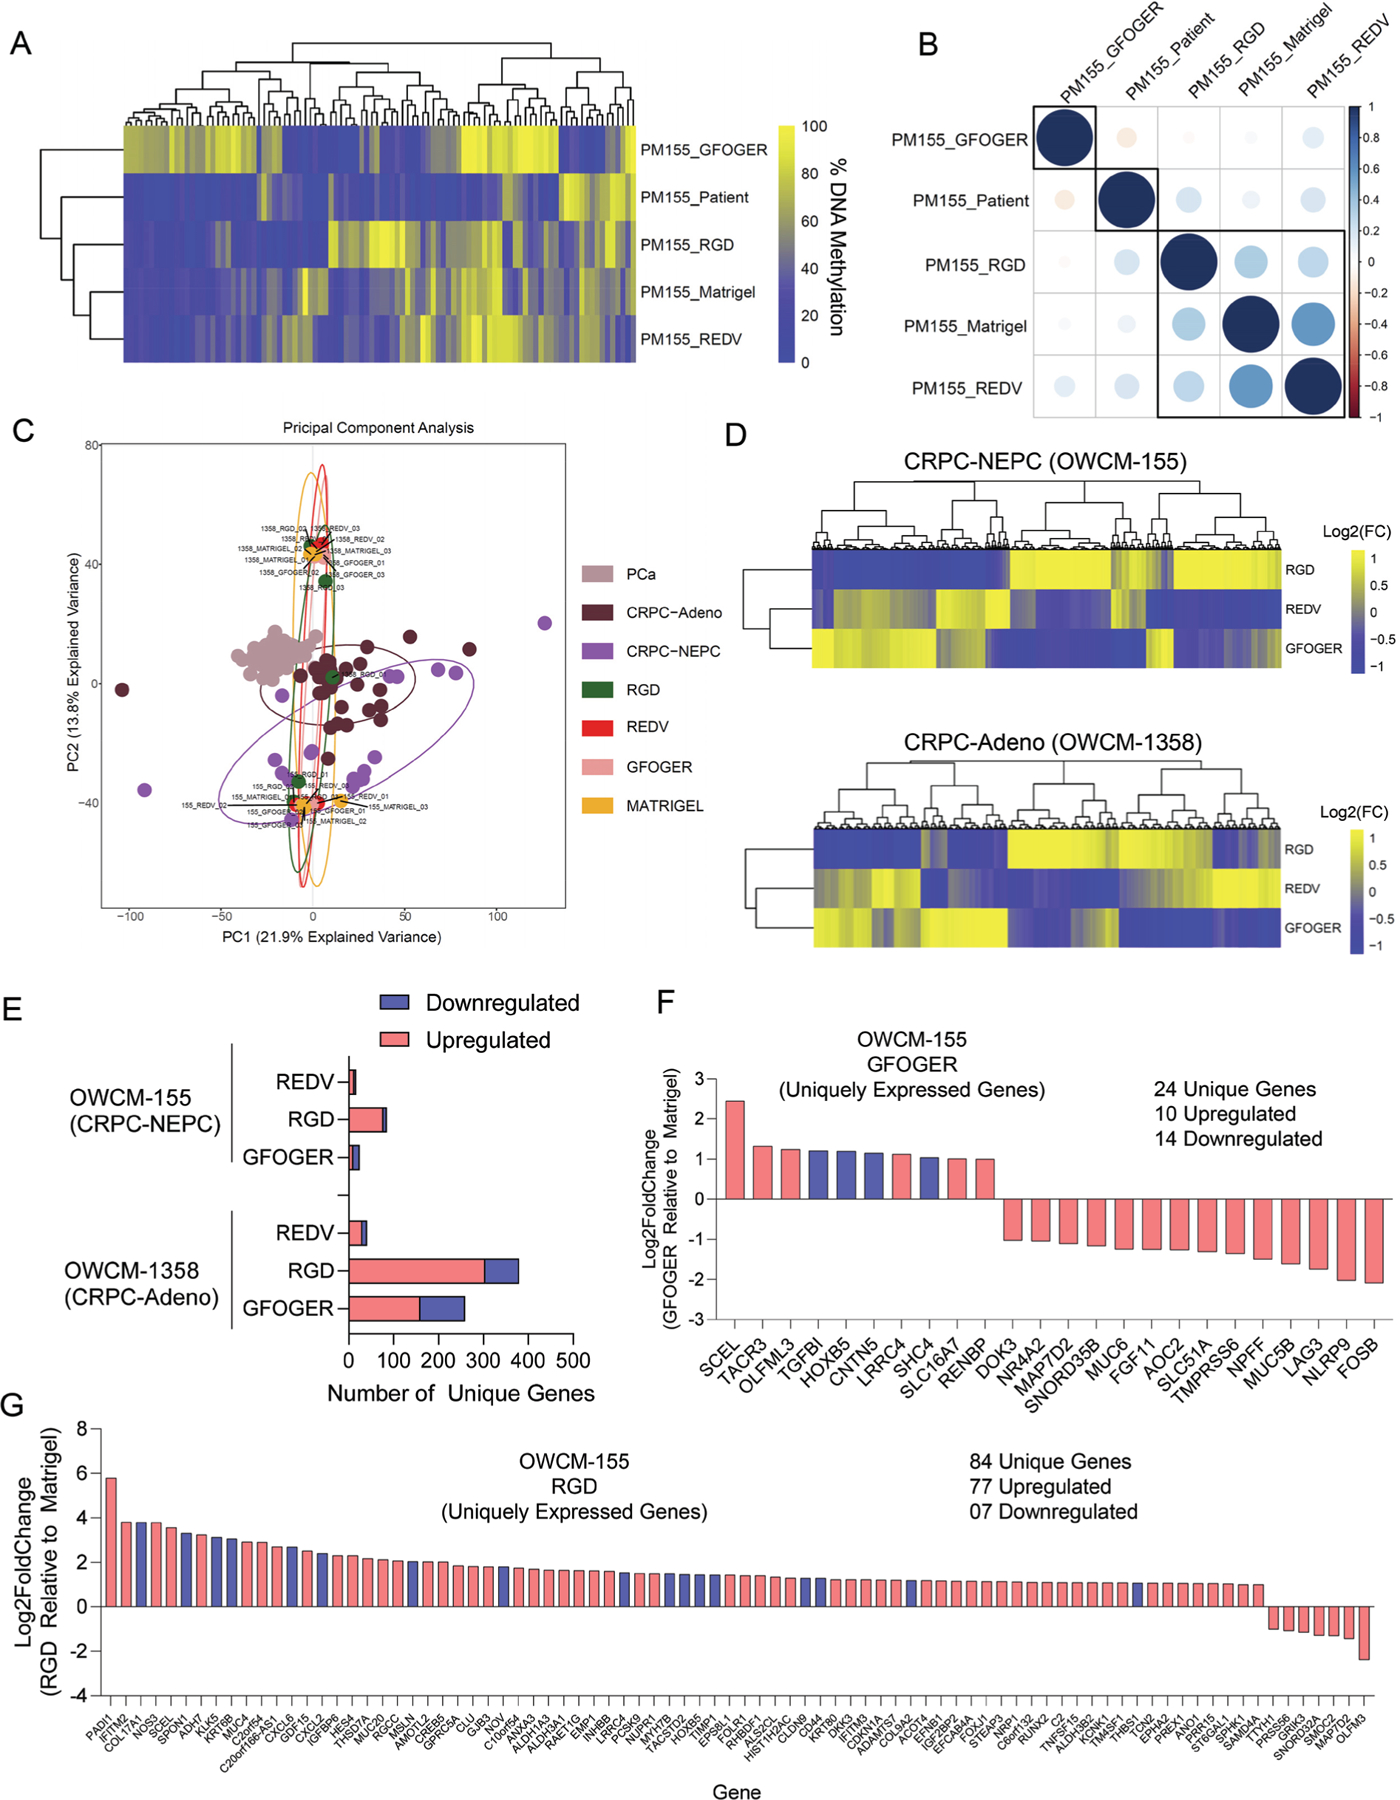
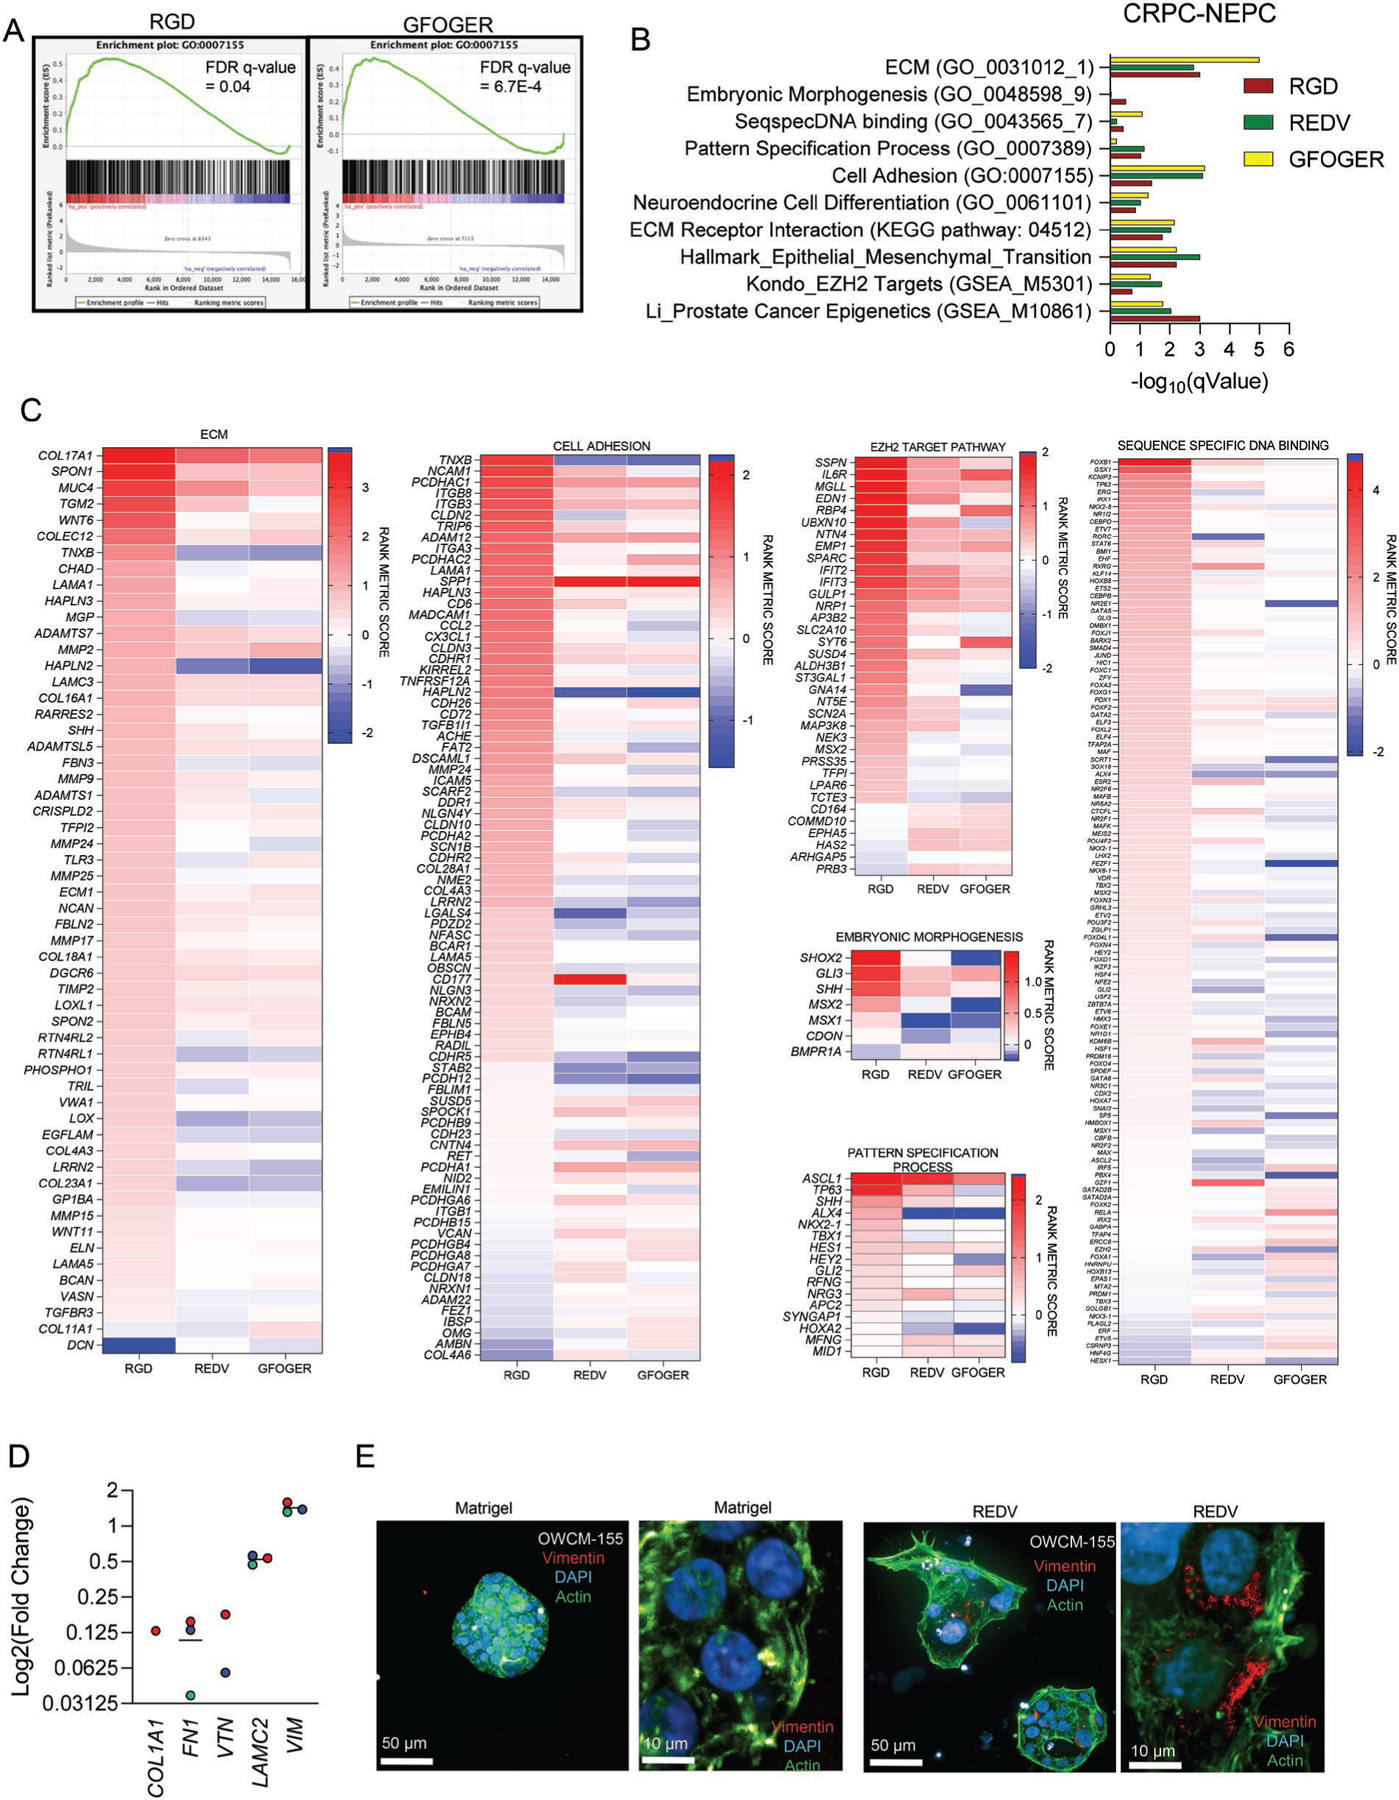
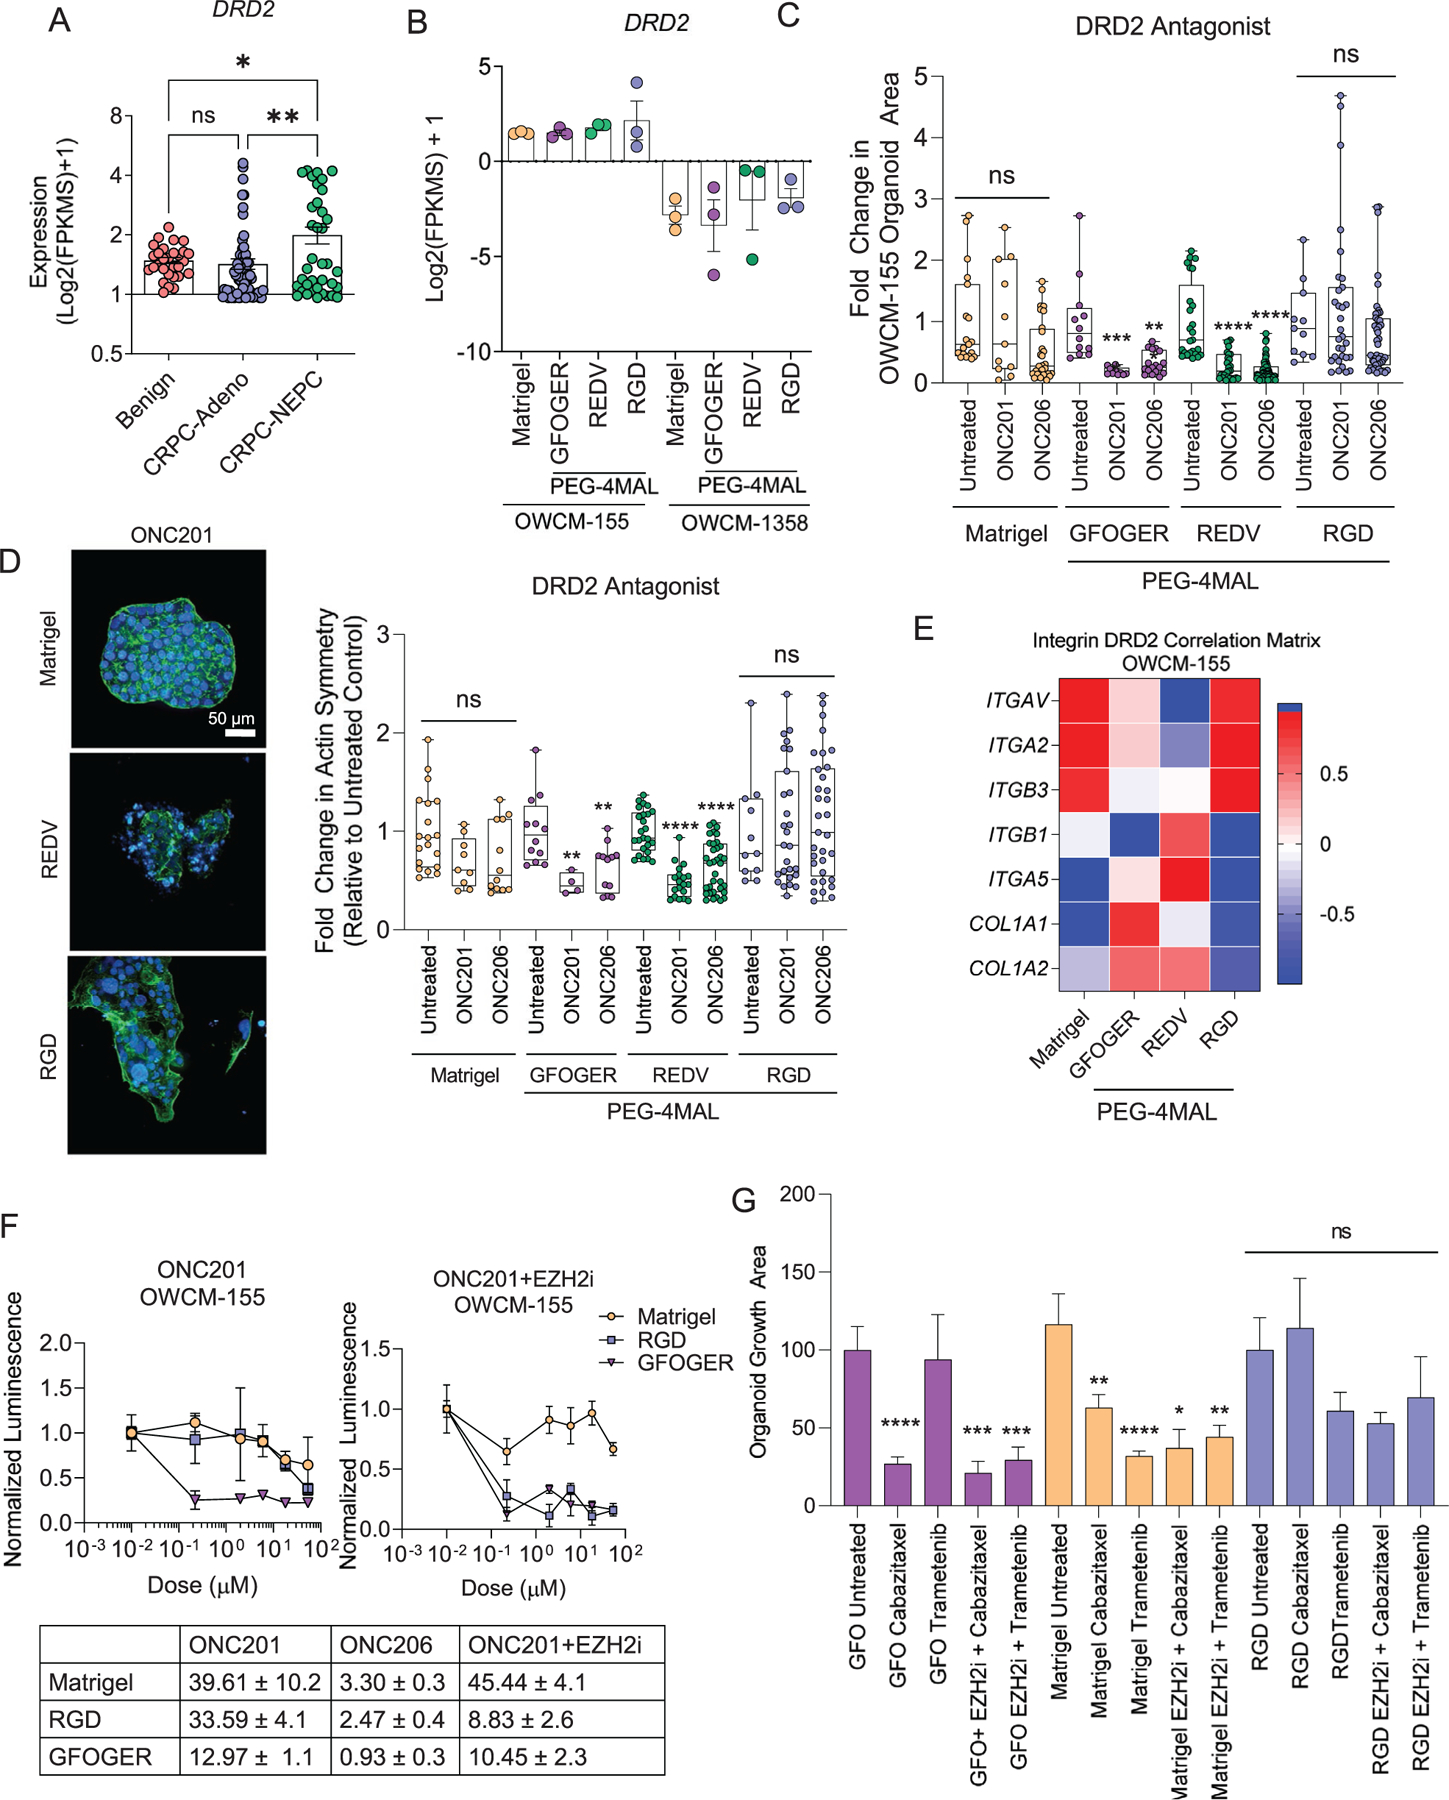
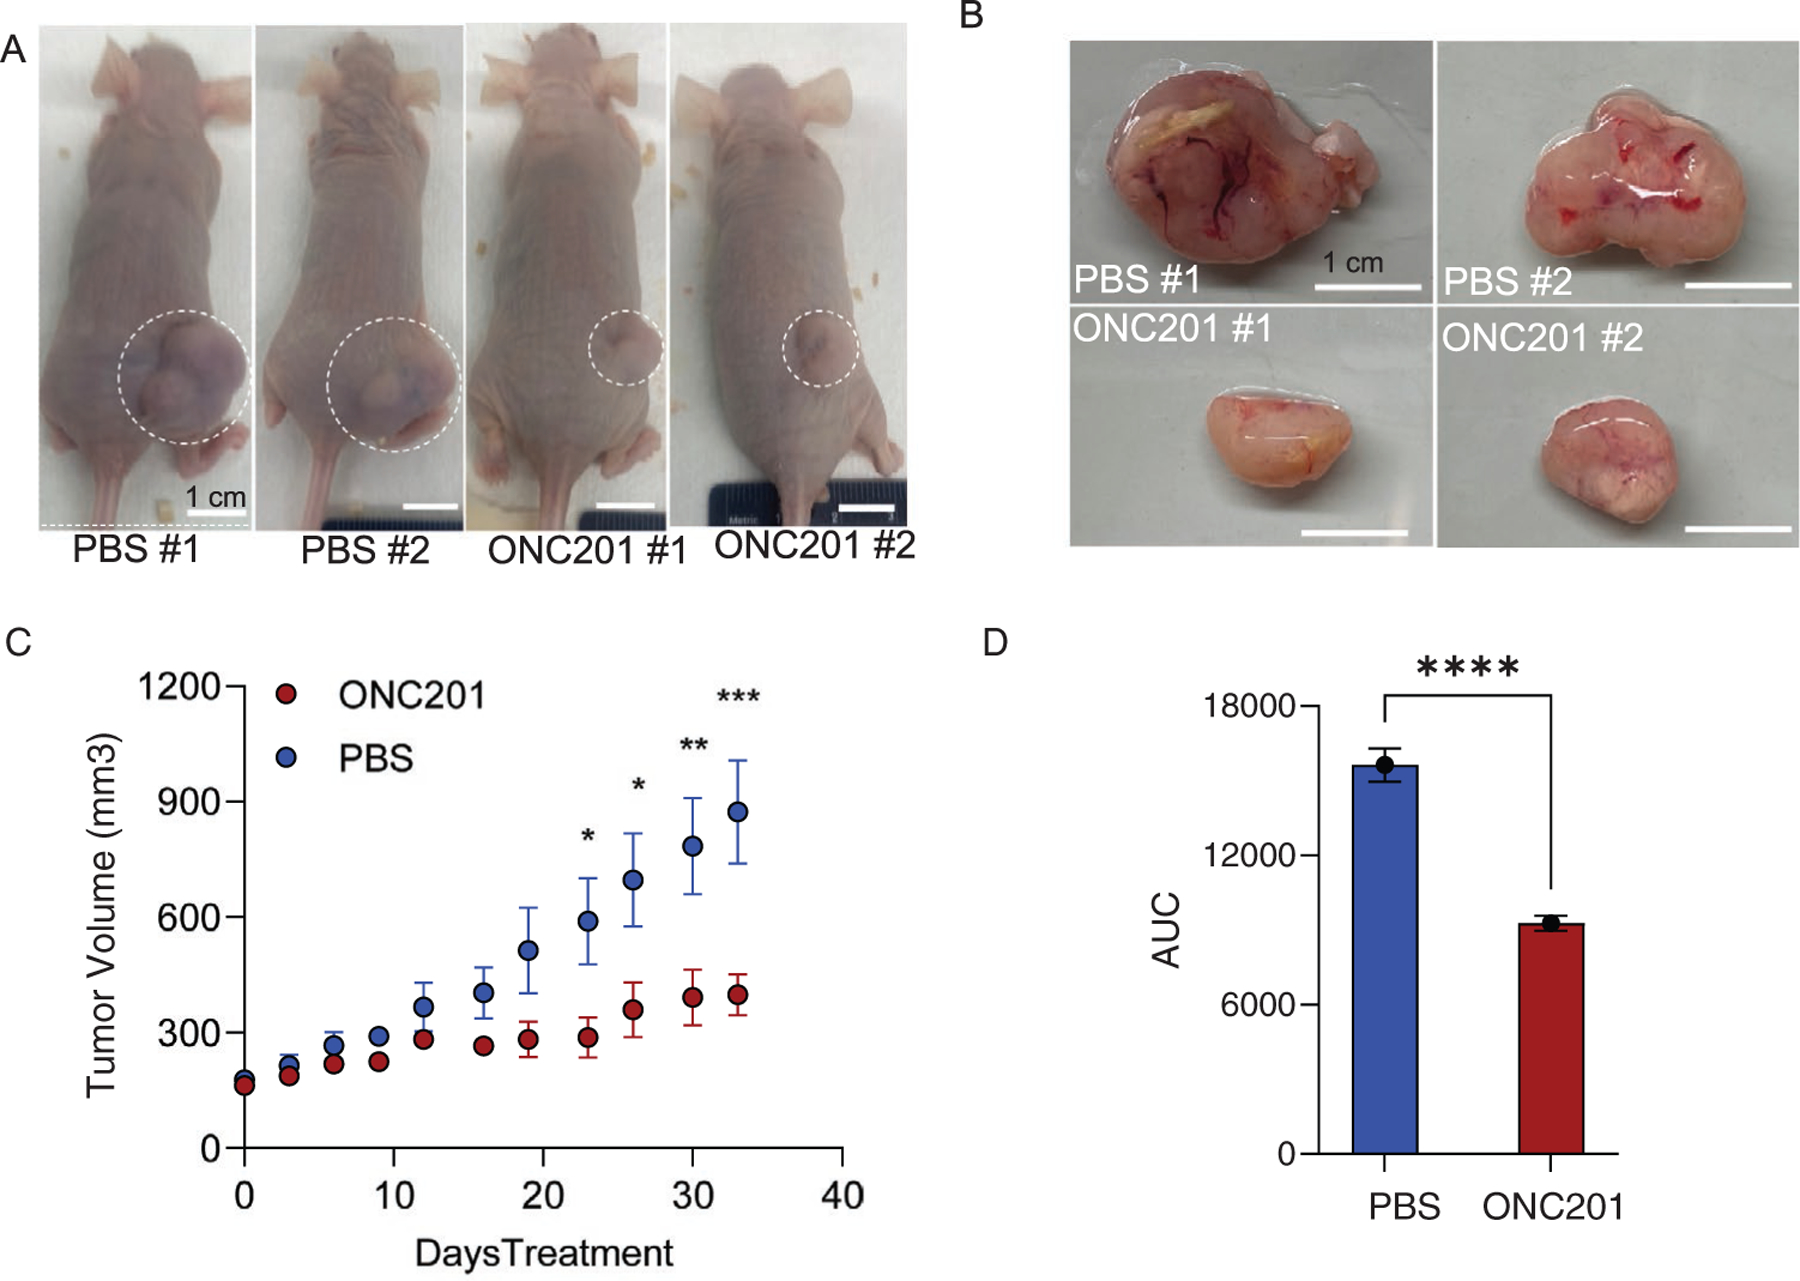
Following treatment with androgen receptor (AR) pathway inhibitors, ≈20% of prostate cancer patients progress by shedding their AR-dependence. These tumors undergo epigenetic reprogramming turning castration-resistant prostate cancer adenocarcinoma (CRPC-Adeno) into neuroendocrine prostate cancer (CRPC-NEPC). No targeted therapies are available for CRPC-NEPCs, and there are minimal organoid models to discover new therapeutic targets against these aggressive tumors. Here, using a combination of patient tumor proteomics, RNA sequencing, spatial-omics, and a synthetic hydrogel-based organoid, putative extracellular matrix (ECM) cues that regulate the phenotypic, transcriptomic, and epigenetic underpinnings of CRPC-NEPCs are defined. Short-term culture in tumor-expressed ECM differentially regulated DNA methylation and mobilized genes in CRPC-NEPCs. The ECM type distinctly regulates the response to small-molecule inhibitors of epigenetic targets and Dopamine Receptor D2 (DRD2), the latter being an understudied target in neuroendocrine tumors. In vivo patient-derived xenograft in immunocompromised mice showed strong anti-tumor response when treated with a DRD2 inhibitor. Finally, we demonstrate that therapeutic response in CRPC-NEPCs under drug-resistant ECM conditions can be overcome by first cellular reprogramming with epigenetic inhibitors, followed by DRD2 treatment. The synthetic organoids suggest the regulatory role of ECM in therapeutic response to targeted therapies in CRPC-NEPCs and enable the discovery of therapies to overcome resistance.

Keywords: chemoresistance; dopamine receptors; epigenetics; neuroendocrine; tumor microenvironment.


Conflict of interest statement

Conflict of Interest

V.P. and J.E.A. are employees and shareholders of Chimerix, Inc. M.J.M is an employee at Teva Pharmaceutical and this work was completed prior to his employment at Teva. L.P is an employee at Loxo Oncology at Lilly, this work was completed prior to her employment at Loxo, she is acting on her own, and these endeavors are not in any manner affiliated with Loxo Oncology at Lilly.

Figures

Figure 1.
Figure 1.
Proteomic, transcriptomic, and spatial omic analysis of patient tumors and establishment of CRPC-Adeno Matrigel organoids. A) Mass spectrometry analysis of ECM components (left) and integrin signaling-related components (right) in primary CRPC-Adeno tumors relative to adjacent normal tissue (average of n = 3). B) RNA-seq transcriptomic analysis of ECM components and integrins in CRPC-Adeno and CRPC-NEPC patient tumor biopsies, as compared to benign tissues (n = 74 CRPC-Adeno, n = 37 CRPC-NEPC, n = 31 benign samples). Data presented as mean ± SEM. C) Multiplexed single-cell spatial omics RNA analysis of prostate tumors. Left column: Immunostaining of EZH2 on CRPC-NEPC prostate tumors. Zoomed in images of single-cell EZH2 distributions (green) in the second and third rows. Right column: FISH based detection of single COL1A1 and β-actin RNA molecules in the same area of the CRPC-NEPC prostate tumors using a FISH signal amplification assay, HCR. Zoomed-in images of single-cell RNA distributions of COL1A1 (yellow) and β-actin (magenta) in the second and third rows. Data representative of two patient biopsies. D) SHG microscopy images of collagen fibers in CRPC-NEPC tissues. The tissue samples were embedded in paraffin and stained with Synaptophysin (SYP). The SHG of tissue samples were imaged on a deparaffinized unstained slide using a two-photon microscope. Data representative of two patient biopsies. E) IHC staining of CRPC-NEPC and CRPC-Adeno patient biopsies. SYP and NKX3.1 staining for CRPC-NEPC and CRPC-Adeno, respectively, and expression of integrin α2 and β1. Data representative of two patient biopsies. F) Development and characterization of a new CRPC-Adeno organoid (OWCM-1358) from a patient tumor biopsy. Nanostring analysis of hallmark gene expression in multiple metastatic sites and derived Matrigel organoids. G) H&E and IHC staining of CRPC-Adeno patient and OWCM-1358 Matrigel organoid that demonstrated CRPC-Adeno gene signature. H) Nanostring-based comparative analysis of prostate cancer-associated genes among CRPC-Adeno (OWCM-1358) and CRPC-NEPC Matrigel organoids (OWCM-154, OWCM-155). I) IHC staining of CRPC-NEPC and CRPC-Adeno Matrigel organoids. SYP and NKX3.1 staining for CRPC-NEPC and CRPC-Adeno, respectively, and expression of integrin α2 and β1. Data representative of two samples.
Figure 2.
Figure 2.
Development and characterization of PEG-4MAL-based synthetic hydrogels to grow prostate cancer organoids. A) Schematic of prostate tumor tissue processing, Matrigel organoid derivation of primary tumors, and serial implantation into ECM-specific PEG-4MAL hydrogels. B) RNA-seq transcriptomic analysis of the patient cohort for matrix MMPs (n = 74 CRPC-Adeno, n = 37 CRPC-NEPC, n = 31 benign samples). Data presented as mean ± S.E.M. C) Growth of DU145 prostate cells in PEG-4MAL organoids with varying VPM:DTT ratios (n = 5). Data presented as mean ± S.E.M. D) AR gene expression in CRPC-Adeno (OWCM-1358) and CRPC-NEPC (OWCM-155) organoids of Matrigel and PEG-4MAL (n = 3 per condition). Data presented as mean ± S.E.M. E) Phase-contrast image of Matrigel and PEG-4MAL organoids and quantified organoid cluster area from confocal microscopy. Each plot represents 3 hydrogels. Data presented as mean ± S.E.M. F) Growth of OWCM-155 cells under Matrigel and defined ECM conditions (n = 3). Data presented as mean ± S.E.M. G) Representative confocal imaging of organoid morphology across ECM conditions (DAPI: purple, actin: green). H) Actin symmetry index across organoid ECM conditions from high-content imaging (CRPC-NEPC: Matrigel n = 128, GFOGER n = 32, REDV n = 26, RGD n = 20; CRPC-Adeno: Matrigel n = 45, GFOGER n = 38, REDV n = 17, RGD n = 23 cell clusters). The box plots show mean (+), median, quartiles (boxes), and range (whiskers). I) Correlation between DAPI and Actin symmetry between Matrigel and GFOGER organoids (Matrigel n = 128, GFOGER n = 32, REDV n = 26, RGD n = 20 cell clusters). J) Texture analysis of actin morphology among organoids. The box plots show mean, median, quartiles (boxes), and range (whiskers). K) Actin symmetry index across organoid stiffness and ECM conditions from high-content imaging. The box plots show mean, median, quartiles (boxes), and range (whiskers). For (C), an unpaired t-test was performed. For all remaining comparisons, groups were compared by a one-way analysis of variance (ANOVA), with posthoc Tukey’s test. For *p < 0.05, **p < 0.01, ***p < 0.001, and ****p < 0.0001.
Figure 3.
Figure 3.
Synthetic ECM regulates EZH2 expression and therapeutic response to EZH2 inhibitor in CRPC-NEPC organoids. A) IHC staining demonstrating EZH2 expression in benign prostate, CRPC-Adeno, and CRPC-NEPC patient tumor biopsies. Comparative EZH2 levels in OWCM-155 (CRPC-NEPC) Matrigel organoids. B) Flow cytometry analysis of EZH2 and H3k27Me3 expression across OWCM-154 (CRPC-NEPC) organoid conditions (n = 5 per condition). Box plots show mean, median, quartiles (boxes), and range (whiskers). For *p < 0.05, **p < 0.01, ***p < 0.001, and ****p < 0.0001. C) Flow cytometry analysis of H3k27Me3 expression across organoid conditions (n = 5 per condition). Box plots show mean, median, quartiles (boxes), and range (whiskers). For *p < 0.05, **p < 0.01, ***p < 0.001, and ****p < 0.0001. D) Integrin and EZH2 gene expression correlation matrices for CRPC-NEPC and CRPC-Adeno organoids. Average of n = 3. E) Fold change in OWCM-155organoid growth area under treatment with an EZH2i GSK343 (Matrigel n = 19, Matrigel+EZH2i n = 14, GFOGER n = 12, GFOGER+EZH2i n = 6, REDV n = 25, REDV+EZH2i n = 31, RGD n = 11, RGD+EZH2i n = 10). A two-tailed t-test evaluated each treated and untreated comparison with *p < 0.05 and ****p < 0.0001. The box plots show mean, median, quartiles (boxes), and range (whiskers). F) Actin symmetry index from high-content imaging (Matrigel n = 128, Matrigel+EZH2i n = 49, GFOGER 7% n = 32, GFOGER 7%+EZH2i n = 27, GFOGER 10%+EZH2i n = 32, GFOGER 10%+EZH2i n = 11). The box plots show mean, median, quartiles (boxes), and range (whiskers). G) Representative images of organoids from high-content imaging under EZH2 inhibition and untreated conditions. (Purple: EZH2, blue: DAPI, green: actin). H,I) Percentage H3K27Me3+ cells (H) and expression level of H3k27Me3 (I) under ROCKi Y27632 conditions. The flow cytometry plots represent gating strategy (H) and histogram overlay represents a shift in the H3k27Me3 signal (I). Data are presented as mean ± S.E.M. An unpaired two-tailed t-test was performed for (H) and (I). For all other comparisons, a one-way ANOVA, with posthoc Tukey’s test was performed with *p < 0.05, **p < 0.01.
Figure 4.
Figure 4.
ECM-dependent differential DNA methylation and gene mobilization in Peg-4MAL hydrogel-based prostate cancer organoids. A) Heirchial clustering heatmap of the DNA methylation levels of the top 100 most variable promoters of methylation. Genes were ranked based on the standard deviation of promoter methylation across all the samples. Data represent pooled cells from 24 PEG-4MAL hydrogel-based organoids and 30 Matrigel organoids. B) Pearson correlation of methylation profiles between patient samples and organoids. The numbers represent pair-wise Pearson correlation coefficients between each pair. Promoter methylation was calculated by averaging the methylation levels of inside CpGs. C) PCA for gene expression in organoids compared to primary patient tumors CRPC-NEPC, CRPC-Adeno, and localized prostate adenocarcinoma PCa. D) Heatmap of differentially expressed genes in CRPC-NEPC OWCM-155 and CRPC-Adeno OWCM-1358 cultured across GFOGER, RGD, and REDV-functionalized PEG-4MAL hydrogel and normalized to Matrigel. Data represent an average of 3 organoids per condition. Yellow (high), blue (low). E) Number of differentially expressed unique genes in OWCM-155 and OWCM-1358 tumors grown in PEG-4MAL organoids relative to Matrigel. Data represent an average of 3 organoids per condition. F) Unique genes expressed by OWCM-155 tumors grown in GFOGER hydrogels. Blue indicates genes that are related to cell adhesion or cytoskeletal pathways. G) Unique genes expressed by OWCM-155 tumors grown in RGD hydrogels. The blue bars indicate genes that are related to cell adhesion or cytoskeletal pathways. The data represent an average of 3 organoids per condition.
Figure 5.
Figure 5.
ECM in synthetic hydrogels drives a transcriptionally distinct phenotype. A) Cumulative enrichment plot of CRPC-NEPC OWCM-155 grown in PEG-4MAL organoids. B) False discovery rate q-values of GSEA pathways. All samples were compared to Matrigel, and a q-value below 0.25 is considered significant. C) Heat maps of pathway-specific enriched genes for OWCM-155 tumors grown in RGD, REDV, and GFOGER-functionalized PEG-4MAL hydrogels. Heat map values are relative to Matrigel. All sequencing data presented here were generated from whole transcriptome sequencing of n = 3 organoids per condition. D) Expression of Vimentin in CRPC-NEPC tumors grown in PEG-4MAL hydrogel-based organoids. E) Representative confocal imaging of Matrigel and REDV organoids for Vimentin (red), DAPI (blue), and Actin (green).
Figure 6.
Figure 6.
Dopamine Receptor 2 as a single agent and combinatorial therapeutic target in CRPC-NEPC. A) Transcriptomic expression of Dopamine Receptor 2 (DRD2) gene across disease progression from the patient cohort (n = 31 Benign, n = 74 CRPC-Adeno, n = 37 CRPC-NEPC). A one-way ANOVA compared all groups with a posthoc Tukey’s test with ****p < 0.0001. B) DRD2 gene expression in PEG-4MAL and Matrigel prostate organoids (n = 3 per condition). C) Fold change in the organoid growth area, determined by high-content imaging of cultures grown under DRD2 inhibition conditions. A one-way ANOVA, with posthoc Tukey’s test with **p < 0.01, ***p < 0.001, and ****p < 0.0001 was used for comparison. D) Left, representative high-content imaging of Matrigel and PEG-4MAL organoid architecture, cultured with ONC201. (DAPI: blue, Actin: green). Right, quantification of actin symmetry of organoids under DRD2 antagonist treatment. Treated groups were compared to untreated controls by a one-way ANOVA, with posthoc Tukey’s test with **p < 0.01, ***p < 0.001, and ***p < 0.0001. E) Correlation heatmap of transcriptomic expression of DRD2 signal with genes differentially expressed by synthetic organoids (n = 3 per condition). F) Drug response curves for ONC201 treatment with and without EZH2 inhibitor, GSK343 (n = 5 per condition). Each growth condition was normalized to untreated conditions for that group. G) Drug response for Cabazitaxel and Trametinib single-agent treatment and with the EZH2 inhibitor, GSK343 (n = 5 per condition). A one-way ANOVA, with posthoc Tukey’s test with **p < 0.01, ***p < 0.001, and ****p < 0.0001 was used for comparison.
Figure 7.
Figure 7.
DRD2 inhibitor ONC-201 reduces tumor volume in the PDX-engrafted nude mouse model of CRPC-NEPC. A) Representative images of mice bearing tumors obtained at week 5. PDX line developed from OWCM-154 Matrigel organoids were transplanted subcutaneously into the flank of male nude mice and once the tumors reached a volume of ≈150 mm3, mice were randomized into treatment groups (n = 5 each), with ONC-201 administered at 125 mg kg−1 once a week by oral gavage for a total of 5 weeks. B) Representative images of tumors harvested from mice at week 5. C) Tumor volume curves for nude mice implanted with CRPC-NEPC OWCM-154 PDX tumors and weekly treated with Saline or ONC-201 (125 mg kg−1, oral) continuously until they reached the study endpoint (n = 5). D) Average area under the curves for the CRPC-NEPC OWCM-154 PDX-engrafted nude mice in the different treatment groups (n = 5).

References

    1. Davies AH, Beltran H, Zoubeidi A, Nat. Rev. Urol 2018, 15, 271. - PubMed
    1. Siegel RL, Miller KD, Jemal A, Ca-Cancer J. Clin 2018, 68, 7. - PubMed
    1. Bray F, Ferlay J, Soerjomataram I, Siegel RL, Torre LA, Jemal A, Ca-Cancer J. Clin 2018, 68, 394. - PubMed
    1. Scher HI, Fizazi K, Saad F, Taplin ME, Sternberg CN, Miller K, de Wit R, Mulders P, Chi KN, Shore ND, Armstrong AJ, Flaig TW, Flechon A, Mainwaring P, Fleming M, Hainsworth JD, Hirmand M, Selby B, Seely L, de Bono JS, N. Engl. J. Med 2012, 367, 1187. - PubMed
    1. de Bono JS, Logothetis CJ, Molina A, Fizazi K, North S, Chu L, Chi KN, Jones RJ, Goodman OB Jr., Saad F, Staffurth JN, Mainwaring P, Harland S, Flaig TW, Hutson TE, Cheng T, Patterson H, Hainsworth JD, Ryan CJ, Sternberg CN, Ellard SL, Flechon A, Saleh M, Scholz M, Efstathiou E, Zivi A, Bianchini D, Loriot Y, Chieffo N, Kheoh T, Haqq CM, Scher HI, N. Engl. J. Med 2011, 364, 1995. - PMC - PubMed

MeSH terms