

A decadal synthesis of atmospheric emissions, ambient air quality, and deposition in the oil sands region
- PMID: 34676977
- PMCID: PMC9299045
- DOI: 10.1002/ieam.4539
A decadal synthesis of atmospheric emissions, ambient air quality, and deposition in the oil sands region
Abstract
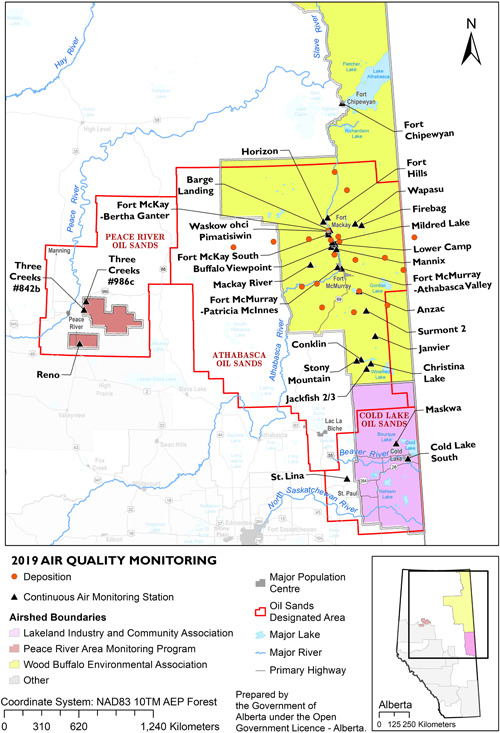
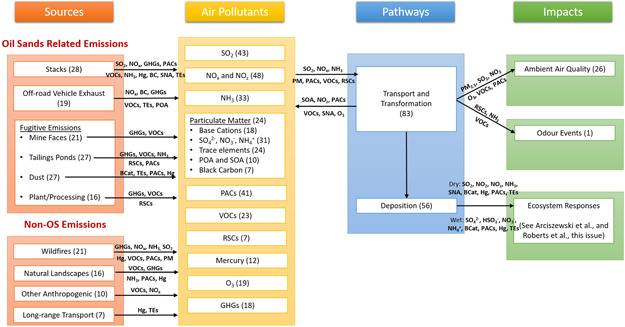
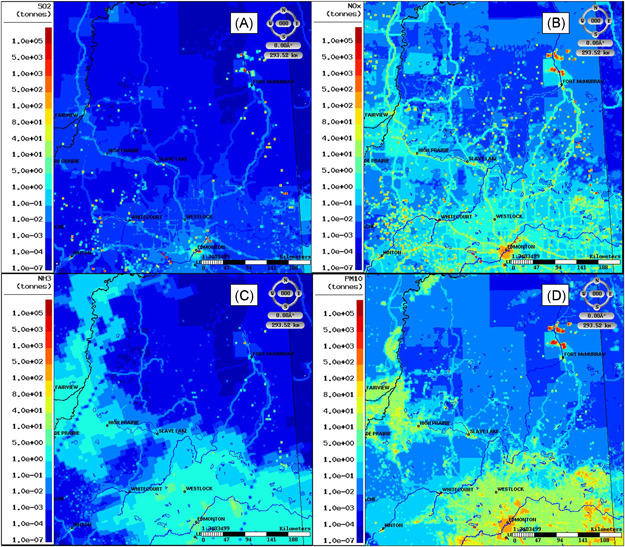
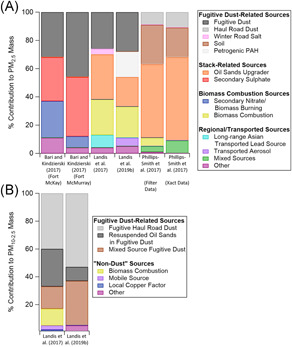
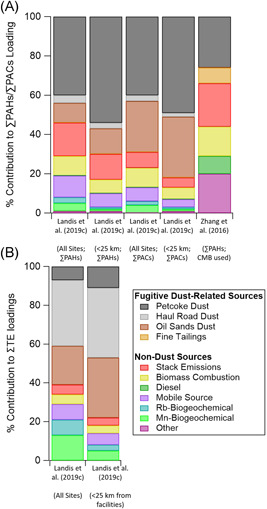
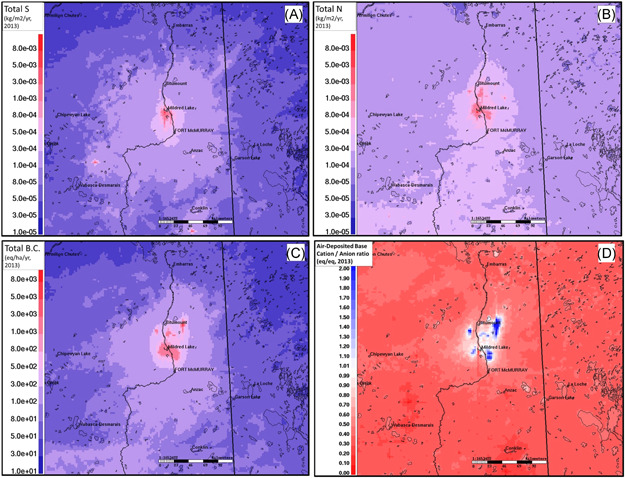
This review is part of a series synthesizing peer-reviewed literature from the past decade on environmental monitoring in the oil sands region (OSR) of northeastern Alberta. It focuses on atmospheric emissions, air quality, and deposition in and downwind of the OSR. Most published monitoring and research activities were concentrated in the surface-mineable region in the Athabasca OSR. Substantial progress has been made in understanding oil sands (OS)-related emission sources using multiple approaches: airborne measurements, satellite measurements, source emission testing, deterministic modeling, and source apportionment modeling. These approaches generally yield consistent results, indicating OS-related sources are regional contributors to nearly all air pollutants. Most pollutants exhibit enhanced air concentrations within ~20 km of surface-mining activities, with some enhanced >100 km downwind. Some pollutants (e.g., sulfur dioxide, nitrogen oxides) undergo transformations as they are transported through the atmosphere. Deposition rates of OS-related substances primarily emitted as fugitive dust are enhanced within ~30 km of surface-mining activities, whereas gaseous and fine particulate emissions have a more diffuse deposition enhancement pattern extending hundreds of kilometers downwind. In general, air quality guidelines are not exceeded, although these single-pollutant thresholds are not comprehensive indicators of air quality. Odor events have occurred in communities near OS industrial activities, although it can be difficult to attribute events to specific pollutants or sources. Nitrogen, sulfur, polycyclic aromatic compounds (PACs), and base cations from OS sources occur in the environment, but explicit and deleterious responses of organisms to these pollutants are not as apparent across all study environments; details of biological monitoring are discussed further in other papers in this special series. However, modeling of critical load exceedances suggests that, at continued emission levels, ecological change may occur in future. Knowledge gaps and recommendations for future work to address these gaps are also presented. Integr Environ Assess Manag 2022;18:333-360. © 2021 The Authors. Integrated Environmental Assessment and Management published by Wiley Periodicals LLC on behalf of Society of Environmental Toxicology & Chemistry (SETAC).
Keywords: Air quality; Atmosphere; Deposition; Emissions; Oil sands.
© 2021 The Authors. Integrated Environmental Assessment and Management published by Wiley Periodicals LLC on behalf of Society of Environmental Toxicology & Chemistry (SETAC).
Conflict of interest statement
The authors declare that there are no conflicts of interest.
Figures
Similar articles
-
An integrated knowledge synthesis of regional ambient monitoring in Canada's oil sands.Integr Environ Assess Manag. 2022 Mar;18(2):428-441. doi: 10.1002/ieam.4505. Epub 2021 Aug 27. Integr Environ Assess Manag. 2022. PMID: 34331737 Free PMC article. Review.
-
Advances in science and applications of air pollution monitoring: A case study on oil sands monitoring targeting ecosystem protection.J Air Waste Manag Assoc. 2019 Jun;69(6):661-709. doi: 10.1080/10962247.2019.1607689. J Air Waste Manag Assoc. 2019. PMID: 31082314 Review.
-
Contribution of emissions from the oil sands activities in Alberta, Canada to atmospheric concentration and deposition of nitrogen and sulfur species at a downwind site.Environ Pollut. 2024 Sep 1;356:124301. doi: 10.1016/j.envpol.2024.124301. Epub 2024 Jun 1. Environ Pollut. 2024. PMID: 38830526
-
History, overview, and governance of environmental monitoring in the oil sands region of Alberta, Canada.Integr Environ Assess Manag. 2022 Mar;18(2):319-332. doi: 10.1002/ieam.4490. Epub 2021 Aug 6. Integr Environ Assess Manag. 2022. PMID: 34241945 Free PMC article. Review.
-
Forest health effects due to atmospheric deposition: Findings from long-term forest health monitoring in the Athabasca Oil Sands Region.Sci Total Environ. 2020 Jan 10;699:134277. doi: 10.1016/j.scitotenv.2019.134277. Epub 2019 Sep 4. Sci Total Environ. 2020. PMID: 31689668
Cited by
-
Essential components and pathways for developing Indigenous community-based monitoring: Examples from the Canadian oil sands region.Integr Environ Assess Manag. 2022 Mar;18(2):407-427. doi: 10.1002/ieam.4485. Epub 2021 Aug 3. Integr Environ Assess Manag. 2022. PMID: 34224211 Free PMC article. Review.
-
An integrated knowledge synthesis of regional ambient monitoring in Canada's oil sands.Integr Environ Assess Manag. 2022 Mar;18(2):428-441. doi: 10.1002/ieam.4505. Epub 2021 Aug 27. Integr Environ Assess Manag. 2022. PMID: 34331737 Free PMC article. Review.
-
Global Patterns of Metal and Other Element Enrichment in Bog and Fen Peatlands.Arch Environ Contam Toxicol. 2024 Feb;86(2):125-139. doi: 10.1007/s00244-024-01051-3. Epub 2024 Feb 10. Arch Environ Contam Toxicol. 2024. PMID: 38340164
-
A critical review of the ecological status of lakes and rivers from Canada's oil sands region.Integr Environ Assess Manag. 2022 Mar;18(2):361-387. doi: 10.1002/ieam.4524. Epub 2021 Oct 25. Integr Environ Assess Manag. 2022. PMID: 34546629 Free PMC article. Review.
-
A synthetic review of terrestrial biological research from the Alberta oil sands region: 10 years of published literature.Integr Environ Assess Manag. 2022 Mar;18(2):388-406. doi: 10.1002/ieam.4519. Epub 2021 Oct 12. Integr Environ Assess Manag. 2022. PMID: 34510725 Free PMC article. Review.
References
-
- Ahad, J. M. E. , Jautzy, J. J. , Cumming, B. F. , Das, B. , Laird, K. R. , & Sanei, H. (2015). Sources of polycyclic aromatic hydrocarbons (PAHs) to northwestern Saskatchewan lakes east of the Athabasca oil sands. Organic Geochemistry, 80, 35–45. 10.1016/j.orggeochem.2015.01.001 - DOI
-
- Akingunola, A. , Makar, P. A. , Zhang, J. , Darlington, A. , Li, S. M. , Gordon, M. , Moran, M. D. , & Zheng, Q. (2018). A chemical transport model study of plume‐rise and particle size distribution for the Athabasca oil sands. Atmospheric Chemistry and Physics, 18(12), 8667–8688. 10.5194/acp-18-8667-2018 - DOI
-
- Alberta Airsheds Council . (2019). Alberta airsheds 2019 air quality report. Alberta Airsheds Council. https://www.albertaairshedscouncil.ca/air-quality-report
-
- Alberta Energy Regulator . (2014). Decision 2014 ABAER 005: Report of recommendations on odours and emissions in the Peace River area (66 pp.). Alberta Airsheds Council.
-
- Alberta Energy Regulator . (2021). ST98: Alberta energy outlook, crude bitumen–Statistics and data. Alberta Airsheds Council. https://www.aer.ca/providing-information/data-and-reports/statistical-re...
Publication types
MeSH terms
Substances
Grants and funding
LinkOut - more resources
Full Text Sources
Medical
Miscellaneous
