. 2021 Oct 22:10:e67292.
doi: 10.7554/eLife.67292.

Intestinal goblet cells sample and deliver lumenal antigens by regulated endocytic uptake and transcytosis

Affiliations

Intestinal goblet cells sample and deliver lumenal antigens by regulated endocytic uptake and transcytosis

Jenny K Gustafsson et al. Elife. .

Abstract

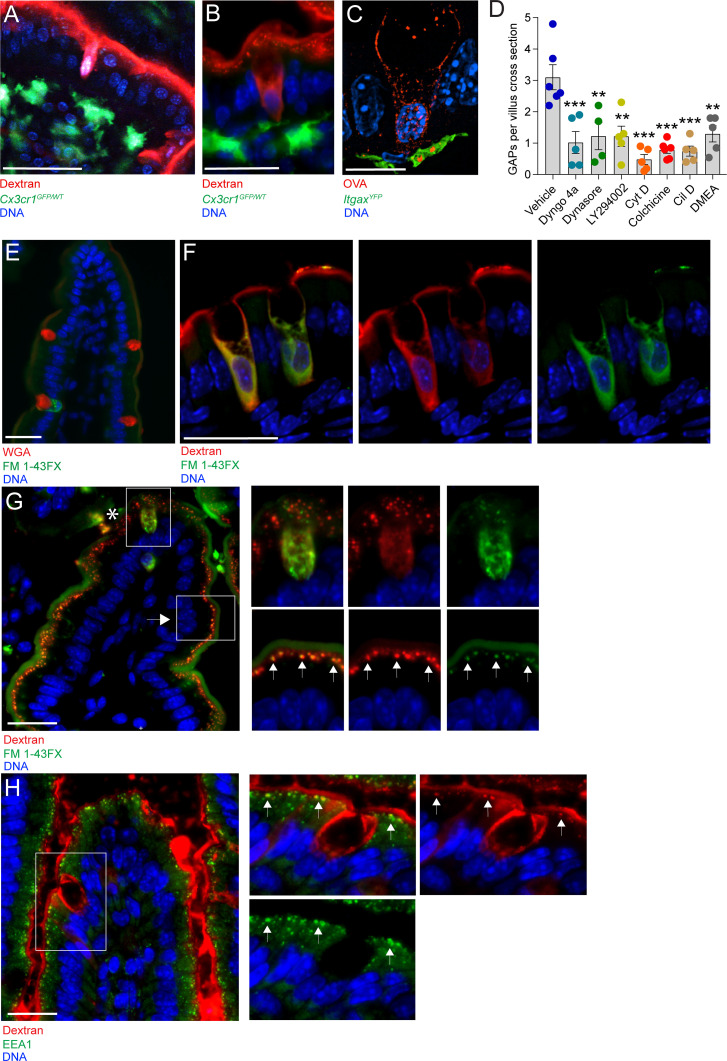
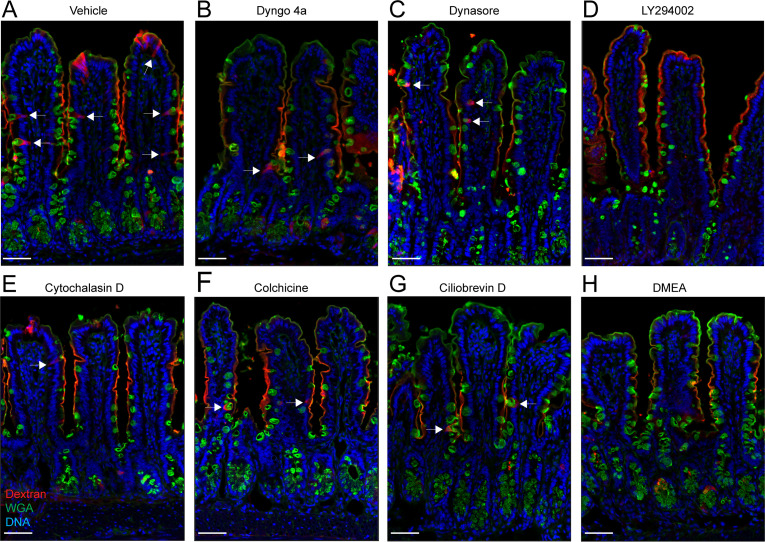
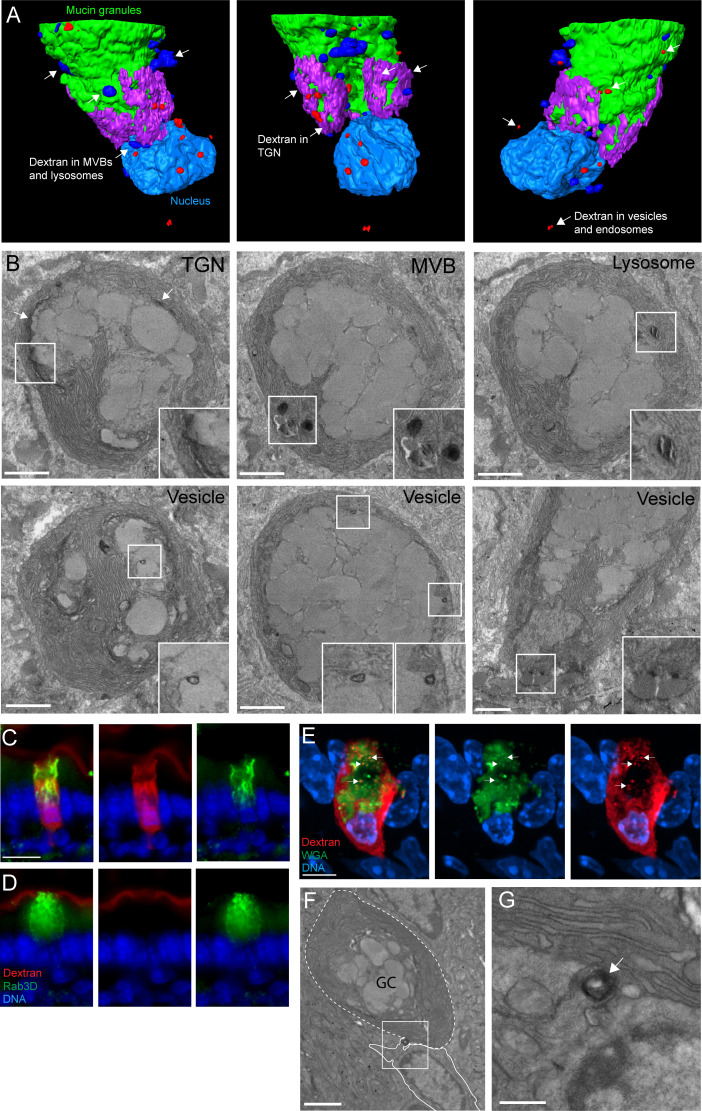
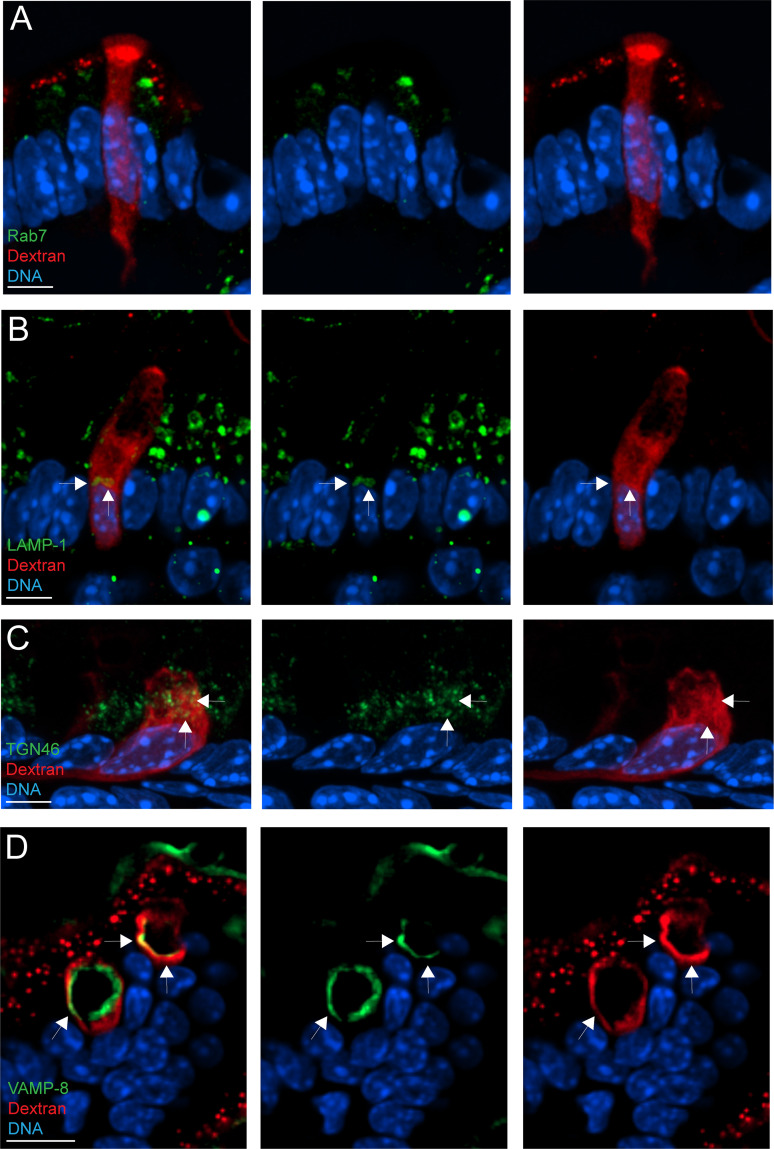
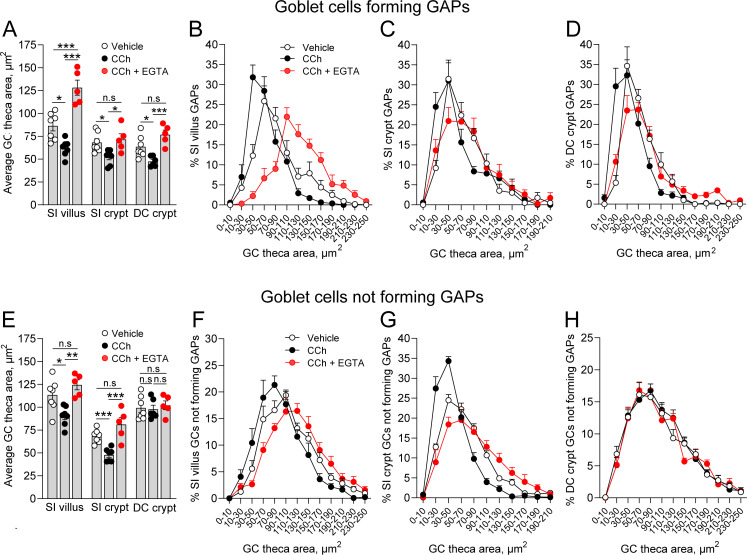
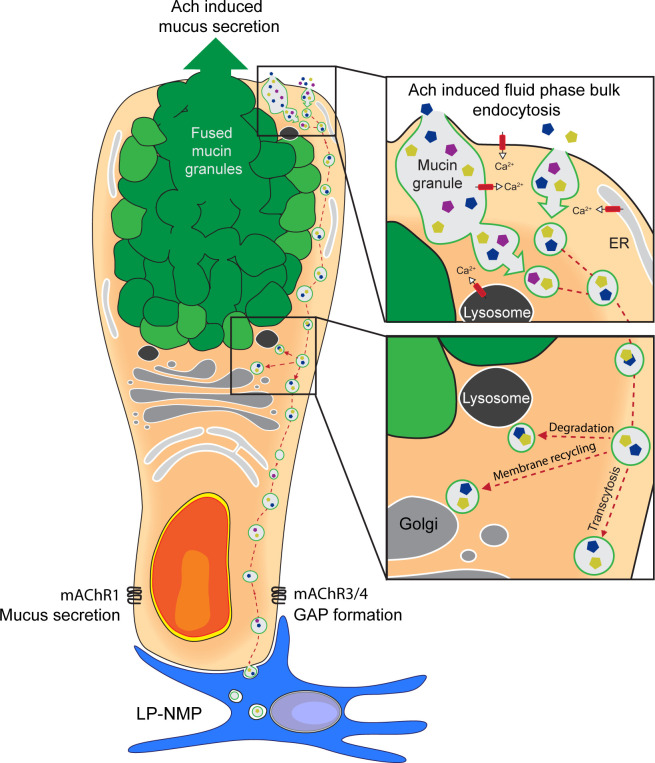
Intestinal goblet cells maintain the protective epithelial barrier through mucus secretion and yet sample lumenal substances for immune processing through formation of goblet cell associated antigen passages (GAPs). The cellular biology of GAPs and how these divergent processes are balanced and regulated by goblet cells remains unknown. Using high-resolution light and electron microscopy, we found that in mice, GAPs were formed by an acetylcholine (ACh)-dependent endocytic event remarkable for delivery of fluid-phase cargo retrograde into the trans-golgi network and across the cell by transcytosis - in addition to the expected transport of fluid-phase cargo by endosomes to multi-vesicular bodies and lysosomes. While ACh also induced goblet cells to secrete mucins, ACh-induced GAP formation and mucin secretion were functionally independent and mediated by different receptors and signaling pathways, enabling goblet cells to differentially regulate these processes to accommodate the dynamically changing demands of the mucosal environment for barrier maintenance and sampling of lumenal substances.

Keywords: antigen sampling; cell biology; goblet cells; immunology; inflammation; intestine; mouse.

Plain language summary

Cells in the gut need to be protected against the many harmful microbes which inhabit this environment. Yet the immune system also needs to ‘keep an eye’ on intestinal contents to maintain tolerance to innocuous substances, such as those from the diet. The ‘goblet cells’ that are part of the gut lining do both: they create a mucus barrier that stops germs from invading the body, but they also can pass on molecules from the intestine to immune cells deep in the tissue to promote tolerance. This is achieved through a ‘GAP’ mechanism. A chemical messenger called acetylcholine can trigger both mucus release and the GAP process in goblet cells. Gustafsson et al. investigated how the cells could take on these two seemingly opposing roles in response to the same signal. A fluorescent molecule was introduced into the intestines of mice, and monitored as it pass through the goblet cells. This revealed how the GAP process took place: the cells were able to capture molecules from the intestines, wrap them in internal sack-like vesicles and then transport them across the entire cell. To explore the role of acetylcholine, Gustafsson et al. blocked the receptors that detect the messenger at the surface of goblet cells. Different receptors and therefore different cascades of molecular events were found to control mucus secretion and GAP formation; this explains how the two processes can be performed in parallel and independently from each other. Understanding how cells relay molecules to the immune system is relevant to other tissues in contact with the environment, such as the eyes, the airways, or the inside of the genital and urinary tracts. Understanding, and then ultimately harnessing this mechanism could help design of new ways to deliver drugs to the immune system and alter immune outcomes.


Conflict of interest statement

JG, JD, TR, KM, DK, KK, SH, JF, WL, RN No competing interests declared

Figures

Figure 1.
Figure 1.. Goblet cell associated antigen passage (GAP) formation is an active endocytic process dependent on actin polymerization, microtubule transport, and phosphoinositide three kinase (PI3K).
(A) Intravital two-photon imaging, (B) wide-field fluorescent imaging, and (C) super-resolution structured illumination microscopy (SIM) imaging of the small intestine (SI) of CX3CR1GFP (green) or ItgaxYFP (green) reporter mice following luminal administration of 10 kDa tetramethylrodamine (TRITC)-dextran (red) or Texas Red-Ovalbumin (OVA; red). (D) Quantification of GAPs per SI villus cross section in mice treated with vehicle (n = 6), Dyngo 4a (n = 5), dynasore (n = 4), LY294002 (n = 5), cytochalasin D (Cyt D, n = 5), colchicine (n = 6), ciliobrevin D (Cil D, n = 5), or dimethylenastron (DMEA, n = 5) followed by intraluminal administration of 10 kDa TRITC-dextran. (E) Wide-field fluorescent imaging of the SI following intraluminal administration of FM 1–43FX (green) for 1 hr. Goblet cells are visualized by wheat germ agglutinin (WGA-Texas Red) (red). (F) Confocal fluorescent imaging of the SI following intraluminal administration of FM 1–43FX (green) and dextran-Alexa647 (red). (G) Wide-field fluorescent imaging of the SI following intraluminal administration of FM 1–43FX (green) and dextran-Alexa647 (red). Asterisk denotes goblet cell, arrow denotes enterocyte, arrows in zoomed in pictures denotes endosomal structures double positive for FM 1–43FX and dextran-Alexa647 in enterocytes. (H) Wide-field fluorescent imaging of the SI following intraluminal administration of TRITC-dextran (red) stained for early endosome protein 1 (EEA1) (green). Arrows denote endosomal structures double positive for TRITC-dextran and EEA1 in enterocytes. Data are presented as mean ± SEM. **p < 0.01, ***p < 0.001 as compared to vehicle treated mice. Scale bar: (A) 50 µm, (B) 25 µm, (C) 10 µm, (E–H) 25 µm. (C and F) represent 3D projections of obtained z-stacks. Statistical analysis was performed using a one-way ANOVA followed by Dunnet’s post-hoc test. A–B, E, G–H n = 6, C, F n = 4. Each point in panel D represents the average number of GAPs from 25 villi in one mouse.
Figure 1—figure supplement 1.
Figure 1—figure supplement 1.. Effect of goblet cell-associated antigen passage (GAP) inhibition on tissue integrity.
Wide-field fluorescent imaging of small intestine tissues treated with (A) vehicle, (B) Dyngo 4a, (C) dynasore, (D) LY294002, (E) cytochalasin D, (F) colchicine, (G) ciliobrevin D, (H) dimethylenastron (DMEA) followed by intraluminal injection of 10 kDa tetramethylrodamine (TRITC)-dextran. Scale bar 50 µm. n = 6 in A and F, n = 5 in B, D, E, G, n = 4 in C. Arrows denote GAPs.
Figure 2.
Figure 2.. An ultrastructural model of goblet cell (GC)-associated antigen passage (GAP) formation.
(A) 3D model of the compiled focused ion beam scanning electron microscopy (FIB-SEM) data demonstrating the fates of luminal cargo in a GAP. Green: mucin granules, purple: dextran in the trans-Golgi network (TGN), dark blue: dextran in multi-vesicular bodies (MVBs) and lysosomes, red: dextran in vesicles/endosomes, light blue: nucleus. (B) Representative FIB-SEM images showing dextran localizing to TGN, MVBs, lysosomes, and endosomes/vesicles. (C and D) Wide-field fluorescent imaging of the small intestine (SI) following intraluminal administration of tetramethylrodamine (TRITC)-dextran (red) and stained for Rab3D (green), and 4',6-diamidino-2-phenylindole (DAPI) blue (DNA). (C) Goblet cells (GCs) forming GAPs show redistribution of Rab3D (green) with uptake of lumenal dextran. (D) GCs not forming GAPs show Rab3D localized to secretory granules in the theca. (E) Confocal fluorescent imaging of SI following intraluminal injection of TRITC-dextran (red) stained with wheat germ agglutinin (WGA) (green) and DAPI (blue). Arrows denote vesicular structures double positive for dextran and WGA. (F and G) Transmission electron micrographs of the basolateral area of a GC following administration of intraluminal dextran. The dashed line outlines a GC and the solid outlines an adjacent underlying cell. Arrow denote a dextran-containing structure located at the fusion point of the GC and the adjacent cell. Scale bar: (B and F) 2 µm, (C–D) 10 µm, (E) 5 µm, (G) 500 nm. n = 4 in panel B, n = 5 in panel C, D, E, n = 3 in panel E, F.
Figure 2—figure supplement 1.
Figure 2—figure supplement 1.. Goblet cell-associated antigen passage (GAP) formation is associated with transport of cargo to the lysosome and the trans-Golgi network (TGN).
Confocal fluorescent imaging of intestinal tissue specimens following intraluminal injection of tetramethylrodamine (TRITC)-dextran (red) stained for 4',6-diamidino-2-phenylindole (DAPI) (blue) and (A) the late endosome marker Rab7 (green), (B) the lysosome marker LAMP-1 (green), (C) the TGN marker TGN46 (green) and in (D) the secretory granule marker VAMP-8. Scale bar: A–C = 5 µm, D = 10 µm. Arrows denote areas with overlapping staining patterns of dextran and the respective organelle markers.
Figure 3.
Figure 3.. Role of muscarinic acetylcholine receptors (mAChRs) in steady-state goblet cell-associated antigen passage (GAP) formation and mucus secretion in the small intestine (SI) and distal colon.
GAP numbers per (A) SI villus and (B) SI crypt in mice treated with vehicle or the mAChR4 antagonist tropicamide. Mucus content of the (C) SI villus and (D) SI crypt quantified as percentage of wheat germ agglutinin-positive (WGA+) area per villus/crypt area in mice treated with vehicle or tropicamide. (E) Representative wide-field fluorescent image of the SI of mice treated with vehicle or tropicamide following intraluminal administration of tetramethylrodamine (TRITC)-dextran (red) and WGA staining of mucus (green). (F) GAP numbers per distal colon (DC) crypt in mice treated with vehicle, pan muscarinic receptor antagonist atropine, mAChR3 antagonist 1,1-dimethyl-4-diphenylacetoxypiperidinium iodide (4-DAMP), or mAChR1 antagonist telenzepine. (G) Representative wide-field fluorescent imaging of distal colon crypts of mice treated with vehicle, atropine, 4-DAMP, or telenzepine following intraluminal administration of TRITC-dextran (red) and Ulex europaeus agglutinin 1 (UEA1) staining of mucus. (H) Mucus content of the distal colon crypt of mice treated with vehicle or 4-DAMP, quantified as percentage of UEA1+ area per distal colon crypt area. Data are presented as mean ± SEM. *p<0.05, **p<0.01, ***p<0.001 as compared to vehicle. n.s. = non-significant as compared to vehicle. n = 5 in panels A–D, n = 6 in panel F (telenzepine n = 5). Each data point in A–D, F, H represents the average of 25 villi or 40 crypts from one mouse. Statistical analysis was performed using an unpaired two-sided Student’s t-test in panel A–D, H. A one-way ANOVA followed by Dunnet’s post hoc test was performed in panel F.
Figure 4.
Figure 4.. Carbamylcholine (CCh)-induced goblet cell (GC)-associated antigen passage (GAP) formation and mucus secretion in the small intestine (SI) and distal colon.
(A) GAP numbers, (B) total wheat germ agglutinin-positive (WGA+) (SI) or Ulex europaeus agglutinin 1 (UEA1+) (distal colon) mucus area per villus/crypt area, (C) representative wide-field fluorescent image of SI villus, (D) quantification of the number of WGA+ (SI) or UEA1+ (distal colon) GCs per villus or crypt cross section, (E) quantification of GC theca area, (F) representative wide-field fluorescent image of SI crypts in vehicle and CCh treated tissue. (G) Representative wide-field fluorescent image of distal colon crypts and (H) representative wide-field fluorescent image of an SI crypt following intraluminal tetramethylrodamine (TRITC)-dextran (red) administration stained for Lysozyme (white). Arrows denote a Paneth cell containing TRITC-dextran. Scale bar: (C) 100 µm, (F, J, K) 50 µm. Data are presented as mean ± SEM, *p < 0.05, **p < 0.01, ***p < 0.001, n.s = non-significant, n = 9 in all groups. Statistical analysis was performed using an unpaired two-sided Student’s t-test. Each data point in A–B, D–E represents the average of 25 villi or 40 crypts from one mouse.
Figure 5.
Figure 5.. Carbamylcholine (CCh)-induced goblet cell-associated antigen passage (GAP) formation and mucus secretion use different muscarinic acetylcholine (ACh) receptors.
Effect of the muscarinic ACh receptor 4 (mAChR4) antagonist tropicamide (Trop.), the mAChR1 antagonist telenzepine (Telenz.), or the preferential mAChR3 antagonist 1,1-dimethyl-4-diphenylacetoxypiperidinium iodide (4-DAMP) on CCh-induced mucus secretion and GAP formation in the small intestine (SI) villus (A–B), the SI crypt (C–D), and the distal colon crypt (E–F). Data are presented as mean ± SEM. **p < 0.01, ***p < 0.001, n.s = non-significant, as compared to CCh. A–B, D–E, n = 6 in all groups. (C and F) Vehicle and CCh n = 7, CCh + 4 DAMP and CCh + Telenz. n = 5. Statistical analysis was performed using a one-way ANOVA followed by Dunnet’s post hoc test. Each data point represents the average of 25 villi or 40 crypts from one mouse.
Figure 5—figure supplement 1.
Figure 5—figure supplement 1.. Small intestine expression of muscarinic ACh receptor 4 (mAChR4) and mAchR1.
Confocal fluorescent imaging of (A) mAChR4 and (B) mAChR1 expression in the small intestine using RNAscope. Arrows denote goblet cells staining positive for the mAChR1/4 probes. Scale bar 50 µm. n = 5.
Figure 5—figure supplement 2.
Figure 5—figure supplement 2.. Distal colon expression of muscarinic ACh receptor 3 (mAChR3) and mAChR1.
Confocal fluorescent imaging of (A) mAChR3 and (B) mAChR1 expression in the distal colon using RNAscope. Arrows denote goblet cells staining positive for the mAChR1/3 probes. Scale bar 50 µm. n = 5.
Figure 6.
Figure 6.. In the small intestine (SI), carbamylcholine (CCh)-induced goblet cell-associated antigen passage (GAP) formation and mucus secretion use different calcium pools and signaling pathways.
Effect of the extracellular Ca2+ chelator EGTA, intracellular Ca2+ chelator BAPTA-AM, IP3R inhibitor Xestospongin C (Xesto C), cADPr inhibitor 8-Br-cADPr, and NAADP inhibitor Trans-Ned-19 (T Ned-19) on CCh-induced mucus secretion in (A) the SI villus, (B) the SI crypt. Effect of Ca2+ signaling inhibitors on CCh-induced GAP formation in (C) the SI villus, (D) the SI crypt. (E–K) Representative images of the effect of the respective treatments on CCh-induced mucus secretion and GAP formation. Scale bar: E–K = 50 µm. Data are presented as mean ± SEM. *p < 0.05, **p < 0.01, ***p < 0.001, n.s = non-significant as compared to CCh. Vehicle and CCh, n = 7, EGTA and BAPTA-AM n = 5, Xesto C, T-Ned-19, and 8-Br-cADPr n = 6. Statistical analysis was performed using a one-way ANOVA followed by Dunnet’s post hoc test. Each data point in (A–D) represents the average of 25 villi or 40 crypts from one mouse.
Figure 6—figure supplement 1.
Figure 6—figure supplement 1.. Endoplasmatic reticulum (ER) staining in intestinal goblet cell-associated antigen passage (GAPs).
Confocal fluorescent imaging of intestinal tissues following intraluminal injection of tetramethylrodamine (TRITC)-dextran (red) stained with the ER marker calnexin (green). Scale bar 5 µm.
Figure 7.
Figure 7.. In the distal colon, carbamylcholine (CCh)-induced goblet cell-associated antigen passage (GAP) formation and mucus secretion use different calcium pools and signaling pathways.
Effect of the extracellular Ca2+ chelator EGTA, intracellular Ca2+ chelator BAPTA-AM, IP3R inhibitor Xestospongin C (Xesto C), cADPr inhibitor 8-Br-cADPr, and NAADP inhibitor Trans-Ned-19 (T Ned-19) on (A) CCh-induced mucus secretion and (B) GAP formation in the distal colon. (C–I) Representative images of the effect of the respective treatments on CCh-induced mucus secretion and GAP formation. Data are presented as mean ± SEM. *p < 0.05, **p < 0.01, ***p < 0.001, n.s = non-significant as compared to CCh. Vehicle and CCh, n = 7, EGTA and 8-Br-cADPr n = 5, BAPTA-AM, Xesto C, and T-Ned-19 n = 6. Scale bar: C–I = 50 µm Statistical analysis was performed using a one-way ANOVA followed by Dunnet’s post hoc test. Each data point in (A–B) represents the average of 40 crypts from one mouse.
Figure 8.
Figure 8.. Carbamylcholine (CCh) induced mucus secretion and goblet cell (GC)-associated antigen passage (GAP) formation can occur in parallel within the same GC.
(A) Average theca area of GCs forming GAPs in vehicle, CCh, and CCh + EGTA treated mice. Size distribution of the theca area of GCs forming GAPs in vehicle, CCh, and CCh + EGTA treated mice in (B) small intestine (SI) villus, (C) SI crypt, and (D) DC crypt. (E) Average theca area of GCs not forming GAPs in vehicle, CCh, and CCh + EGTA treated mice. Size distribution of GCs not forming GAPs in vehicle, CCh, and CCh + EGTA treated mice in (F) SI villus, (G) SI crypt, and (H) DC crypt. Data are presented as mean ± SEM. Vehicle n = 7, CCh n = 7, CCh + EGTA n = 5. Statistical analysis was performed using a one-way ANOVA with Tukey’s post hoc test for multiple comparisons. In panels B–D and F–H, the data represent the percentage of GCs within the respective area bins as part of the total population of GCs forming GAPs, or the total population of GCs not forming GAPs (100%).
Figure 9.
Figure 9.. Schematic representation of acetylcholine (ACh)-induced mucus secretion and goblet cell-associated antigen passage (GAP) formation in intestinal goblet cells.
In response to exogenous ACh, intestinal goblet cells respond with an accelerated mucus secretory response mediated by muscarinic ACh receptor 1 (mAChR1), and/or induction of fluid-phase bulk endocytosis of secretory granule membrane (GAP formation) mediated by mAChR4 in the small intestine (SI) and mAChR3 in the distal colon. The endocytic vesicles containing luminal fluid-phase cargo are shuttled through the cell for degradation, membrane recycling, and transcytosis to be acquired by lamina proporia mononuclear phagocytes (LP-MNPs). Using separate mAChRs, Ca2+ pools and signaling pathways for the processes of ACh-induced GAP formation and ACh-induced mucus secretion allow these processes to occur independently or in parallel within the same goblet cell forming the basis of how goblet cells can differentially regulate when to maintain the mucus barrier and when to deliver luminal substances to the immune system.

Similar articles

Cited by

References

    1. Barbieri EJ, Bobyock E, Chernick WS, McMichael RF. The calcium dependency of mucus glycoconjugate secretion by canine tracheal explants. British Journal of Pharmacology. 1984;82:199–206. doi: 10.1111/j.1476-5381.1984.tb16459.x. - DOI - PMC - PubMed
    1. Bozkurt TE, Sahin-Erdemli I. M(1) and M(3) muscarinic receptors are involved in the release of urinary bladder-derived relaxant factor. Pharmacological Research. 2009;59:300–305. doi: 10.1016/j.phrs.2009.01.013. - DOI - PubMed
    1. Calcraft PJ, Ruas M, Pan Z, Cheng X, Arredouani A, Hao X, Tang J, Rietdorf K, Teboul L, Chuang K-T, Lin P, Xiao R, Wang C, Zhu Y, Lin Y, Wyatt CN, Parrington J, Ma J, Evans AM, Galione A, Zhu MX. NAADP mobilizes calcium from acidic organelles through two-pore channels. Nature. 2009;459:596–600. doi: 10.1038/nature08030. - DOI - PMC - PubMed
    1. Clague MJ, Thorpe C, Jones AT. Phosphatidylinositol 3-kinase regulation of fluid phase endocytosis. FEBS Letters. 1995;367:272–274. doi: 10.1016/0014-5793(95)00576-u. - DOI - PubMed
    1. Deshpande DA, Dogan S, Walseth TF, Miller SM, Amrani Y, Panettieri RA, Kannan MS. Modulation of calcium signaling by interleukin-13 in human airway smooth muscle: role of CD38/cyclic adenosine diphosphate ribose pathway. American Journal of Respiratory Cell and Molecular Biology. 2004;31:36–42. doi: 10.1165/rcmb.2003-0313OC. - DOI - PubMed

Publication types