. 2021 Oct 7;11(10):689.
doi: 10.3390/metabo11100689.

A Metabolomics Investigation of the Metabolic Changes of Raji B Lymphoma Cells Undergoing Apoptosis Induced by Zinc Ions

Affiliations

A Metabolomics Investigation of the Metabolic Changes of Raji B Lymphoma Cells Undergoing Apoptosis Induced by Zinc Ions

Naeun Yoon et al. Metabolites. .

Abstract

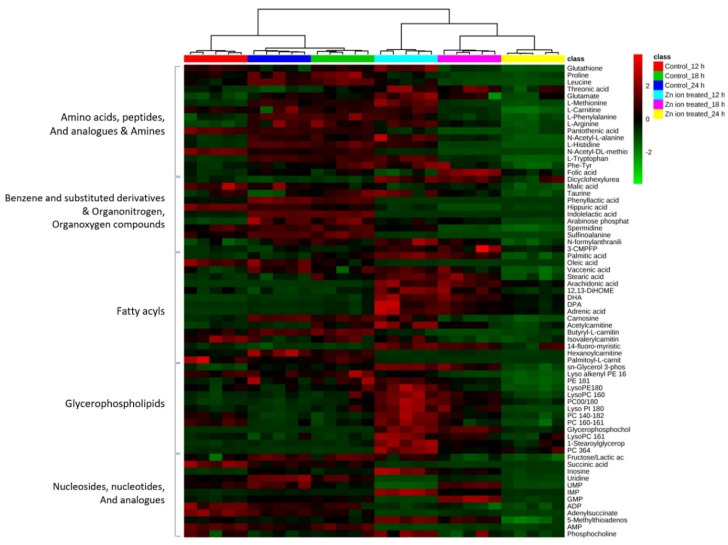
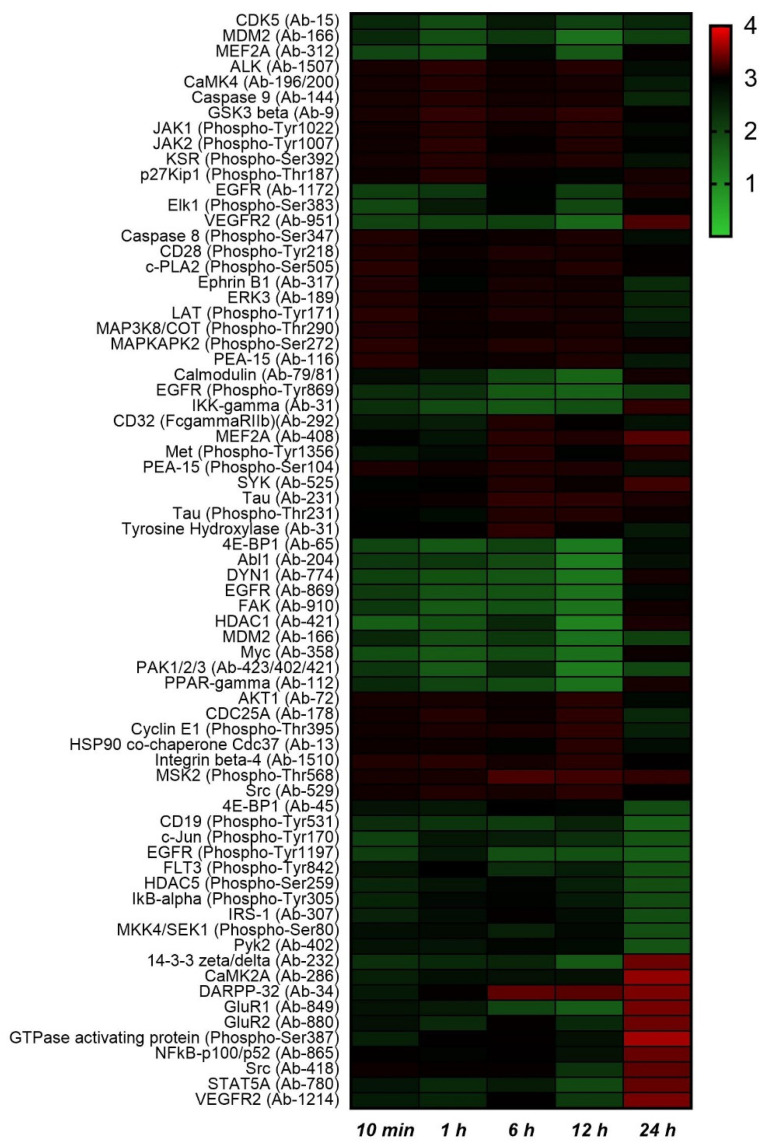
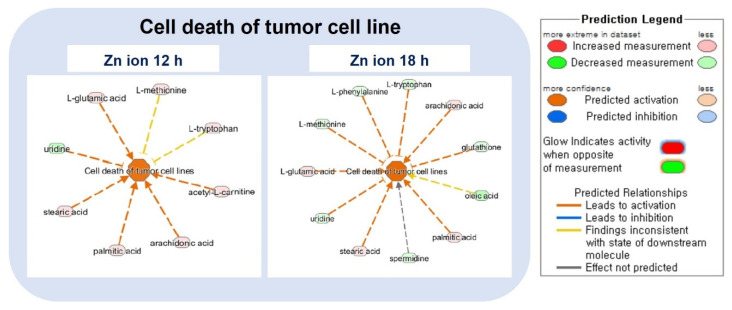
Zinc plays a pivotal role in the function of cells and can induce apoptosis in various cancer cells, including Raji B lymphoma. However, the metabolic mechanism of Zn-induced apoptosis in Raji cells has not been explored. In this study, we performed global metabolic profiling using UPLC-Orbitrap-MS to assess the apoptosis of Raji cells induced by Zn ions released from ZnO nanorods. Multivariate analysis and database searches identified altered metabolites. Furthermore, the differences in the phosphorylation of 1380 proteins were also evaluated by Full Moon kinase array to discover the protein associated Zn-induced apoptosis. From the results, a prominent increase in glycerophosphocholine and fatty acids was observed after Zn ion treatment, but only arachidonic acid was shown to induce apoptosis. The kinase array revealed that the phosphorylation of p53, GTPase activation protein, CaMK2a, PPAR-γ, and PLA-2 was changed. From the pathway analysis, metabolic changes showed earlier onset than protein signaling, which were related to choline metabolism. LC-MS analysis was used to quantify the intracellular choline concentration, which decreased after Zn treatment, which may be related to the choline consumption required to produce choline-containing metabolites. Overall, we found that choline metabolism plays an important role in Zn-induced Raji cell apoptosis.

Keywords: apoptosis; cancer; cell metabolomics; metabolomics; zinc ion.


Conflict of interest statement

All the authors have read and agreed to the content of this submission. We also have no conflicts of interest to disclose.

Figures

Figure 1
Figure 1
Apoptotic cell population evaluated by flow cytometry analysis following double staining with Annexin−V and propidium iodide (PI). (A) Raji cells without treatment; (B) Raji cells treated with Zn ion (10 mg/L) for 12 h, (C)18 h, and (D) 24 h.
Figure 2
Figure 2
Multivariate statistical analysis based on the time−dependent metabolic profiling of Zn ion−treated Raji cells. (A) PCA score plot of the positive mode (R2X [1] = 0.691, R2X [2] = 0.767); (B) PCA score plot of negative mode (R2X [1] = 0.438, R2X [2] = 0.612). Green, control Raji cells incubated for 12 h; black, control Raji cells incubated for 18 h; red, control Raji cells incubated for 24 h; blue, Raji cells incubated with Zn ions for 12 h; yellow, Raji cells incubated with Zn ions for 18 h; pink, Raji cells incubated with Zn ions for 24 h (n = 5 in each group). All of the dots in the circle are controls.
Figure 3
Figure 3
Heat map and cluster analysis of the metabolites discriminated after Zn ion treatment in the Raji cell lines. The distance measure was calculated by Euclidean distance, and the metabolites were verified by Student’s t−test. Significantly decreased metabolites are displayed in green, and increased metabolites are shown in red. Each group is indicated at the top of the figure. Red, control 12 h; green, control 18 h; blue, control 24 h; cyan, Zn ion treatment 12 h; pink: Zn ion treatment 18 h; yellow, Zn ion treatment 24 h (each n = 5).
Figure 4
Figure 4
The top 10 highest and lowest changes in the phosphorylated/nonphosphorylated protein ratios induced by Zn ion treatment. The heat map value is the intensity ratio (intensity of phosphorylated protein/intensity of nonphosphorylated protein). The bottom line shows the time of Zn ion treatment. The red and green colors indicate increases and decreases, respectively.
Figure 5
Figure 5
Top enriched diseases and functions by IPA analysis. Description of the cell death of the tumor cell line pathway in detail. The prediction legend is described in the box on the right.
Figure 6
Figure 6
(A) Proposed choline metabolic pathway after Zn ion treatment. The number in the circle indicates the ratio of each metabolite between the control and Zn ion−treated groups (normalized intensity of Zn ion−treated sample/normalized intensity of control sample). The number in the box indicates the phosphorylated ratio of kinase (phosphorylated-form kinase intensity/unphosphorylated-form kinase intensity) between the Zn ion−treated groups divided by the control. The color of the red series indicates an increase in the ratio, and the blue series indicates a decrease in the ratio. Circles represent the metabolome; boxes represent kinases; ⓟ denotes phosphorylated kinase. Statistically significant: * p ≤ 0.05, ** p ≤ 0.01, *** p ≤ 0.001, and **** p ≤ 0.0001. (B) Choline concentration in Zn ion-treated Raji cells. The integrated peak intensities of choline were normalized by the concentration of DNA in each cell pellet. Cells were incubated in Zn ion−containing media (10 mg/L) for 6, 12, and 24 h (n = 3). * p < 0.05.
Figure 6
Figure 6
(A) Proposed choline metabolic pathway after Zn ion treatment. The number in the circle indicates the ratio of each metabolite between the control and Zn ion−treated groups (normalized intensity of Zn ion−treated sample/normalized intensity of control sample). The number in the box indicates the phosphorylated ratio of kinase (phosphorylated-form kinase intensity/unphosphorylated-form kinase intensity) between the Zn ion−treated groups divided by the control. The color of the red series indicates an increase in the ratio, and the blue series indicates a decrease in the ratio. Circles represent the metabolome; boxes represent kinases; ⓟ denotes phosphorylated kinase. Statistically significant: * p ≤ 0.05, ** p ≤ 0.01, *** p ≤ 0.001, and **** p ≤ 0.0001. (B) Choline concentration in Zn ion-treated Raji cells. The integrated peak intensities of choline were normalized by the concentration of DNA in each cell pellet. Cells were incubated in Zn ion−containing media (10 mg/L) for 6, 12, and 24 h (n = 3). * p < 0.05.
Figure 7
Figure 7
(A) Cell viability test after treatment of Raji cells with AA. AA, arachidonic acid (20 µM); GPC, glycerophosphocholine (20 µM); DPA, docosapentaenoic acid (10 µM). (B) Concentration-dependent AA treatment of Raji cells. The black bar represents the 12 h treatment, and the gray bar represents the 24 h treatment. (C) Western blot assays were performed on Raji cells to confirm that AA caused caspase-dependent cell death. Cells were treated with 10 µM of AA for 1, 6, 12, and 24 h. (D) Bar graphs show the quantification of cleaved PARP at 6 h after AA treatment. Cleaved PARP was significantly increased (each n = 3). Statistically significant: * p ≤ 0.05, *** p ≤ 0.001.

References

    1. Chimienti F., Aouffen M., Favier A., Seve M. Zinc homeostasis-regulating proteins: New drug targets for triggering cell fate. Curr. Drug Targets. 2003;4:323–338. doi: 10.2174/1389450033491082. - DOI - PubMed
    1. Franklin R.B., Costello L.C. The important role of the apoptotic effects of zinc in the development of cancers. J. Cell. Biochem. 2009;106:750–757. doi: 10.1002/jcb.22049. - DOI - PMC - PubMed
    1. Kocdor H., Ates H., Aydin S., Cehreli R., Soyarat F., Kemanli P., Harmanci D., Cengiz H., Kocdor M.A. Zinc supplementation induces apoptosis and enhances antitumor efficacy of docetaxel in non-small-cell lung cancer. Drug Des. Dev. Ther. 2015;9:3899–3909. doi: 10.2147/DDDT.S87662. - DOI - PMC - PubMed
    1. Feng P., Li T., Guan Z., Franklin R.B., Costello L.C. The involvement of bax in zinc-induced mitochondrial apoptogenesis in malignant prostate cells. Mol. Cancer. 2008;7:25. doi: 10.1186/1476-4598-7-25. - DOI - PMC - PubMed
    1. Schrantz N., Auffredou M.T., Bourgeade M.F., Besnault L., Leca G., Vazquez A. Zinc-mediated regulation of caspases activity: Dose-dependent inhibition or activation of caspase-3 in the human Burkitt lymphoma B cells (Ramos) Cell Death Differ. 2001;8:152–161. doi: 10.1038/sj.cdd.4400772. - DOI - PubMed