. 2021 Oct 13;11(10):701.
doi: 10.3390/metabo11100701.

Multi-Omics Analysis to Generate Hypotheses for Mild Health Problems in Monkeys

Affiliations

Multi-Omics Analysis to Generate Hypotheses for Mild Health Problems in Monkeys

Fumie Hamano et al. Metabolites. .

Abstract

Certain symptoms associated with mild sickness and lethargy have not been categorized as definitive diseases. Confirming such symptoms in captive monkeys (Macaca fascicularis, known as cynomolgus monkeys) can be difficult; however, it is possible to observe and analyze their feces. In this study, we investigated the relationship between stool state and various omics data by considering objective and quantitative values of stool water content as a phenotype for analysis. By examining the food intake of the monkeys and assessing their stool, urine, and plasma, we attempted to obtain a comprehensive understanding of the health status of individual monkeys and correlate it with the stool condition. Our metabolomics data strongly suggested that many lipid-related metabolites were correlated with the stool water content. The lipidomic analysis revealed the involvement of saturated and oxidized fatty acids, metallomics revealed the contribution of selenium (a bio-essential trace element), and intestinal microbiota analysis revealed the association of several bacterial species with the stool water content. Based on our results, we hypothesize that the redox imbalance causes minor health problems. However, it is not possible to make a definite conclusion using multi-omics alone, and other hypotheses could be proposed.

Keywords: lipid mediators; lipidomics; metabolomics; metallomics; microbiota; multi-omics; multiple sample sources; redox; saturated fatty acids; selenium.


Conflict of interest statement

The authors declare no conflict of interest. The funders had no role in the interpretation of data or in the writing of the manuscript.

Figures

Figure 1
Figure 1
Classification of fecal metabolites that strongly correlate with stool water content.
Figure 2
Figure 2
Comparison of fatty acid species in food and feces. The orange bars represent the fatty acids in the food (repeatedly twice), the blue bars the fatty acids in the feces (average of 20 animals, and each sample was measured repeatedly three times), the vertical axis shows the percentage when the total fatty acid content is 100%, and the horizontal axis shows the fatty acid species; the number following “C” indicates the length of the carbon chain, the number following the colon indicates the number of unsaturated bonds, and the number following “n-” indicates the position of the first unsaturated bond counting from the position of the carbon atom of the terminal methyl group. The graph embedded in Figure 2 is a magnified view of fatty acids with chains of more than 20 carbons. The error bars indicate the standard error.
Figure 3
Figure 3
Correlation between water content and fatty acid content in feces. The correlation coefficient was calculated based on Pearson’s correlation coefficient and is shown on the vertical axis. The horizontal axis shows the type of fatty acid; the number following “C” indicates the length of the carbon chain, the number following the colon indicates the number of unsaturated bonds, and the number following “n-” indicates the position of the first unsaturated bond counting from the position of the carbon atom of the terminal methyl group. The fatty acids were measured by GC after derivatization. The numbers next to the bar graph are the p-values.
Figure 4
Figure 4
Lipidomics of monkey food. The numbers represent the number of lipids identified. PE-related lipids are LdMePE (5 lipids) and dMePE (14 lipids). PC, phosphatidylcholine; LPC, lysophosphatidylcholine; PE, phosphatidylethanolamine; LPE, lysophosphatidylethanolamine; TG, triglyceride; Hex1Cer, hexosylceramide.
Figure 5
Figure 5
Fecal lipidomics. (a) Distribution (the number of lipid-species within one lipid class) of lipid components in the stool. (b) Lipids in stool with a significant positive correlation with the stool water content. (c) Lipids in stool with significant negative correlation with the stool water content. PC; phosphatidylcholine, LPC: lysophosphatidylcholine, PE, phosphatidylethanolamine; LPE, lysophosphatidylethanolamine; PG, phosphatidylglycerol; LPG, lysophosphatidylglycerol; TG, triglyceride; HexCer, hexosylceramide; PA, phosphatidic acid; Pet, phosphatidylethanol; PMe, phosphatidylmethanol.
Figure 6
Figure 6
Plasma lipidomics. (a) Distribution (the number of lipid-species within one lipid class) of lipid components in the plasma. (b) Lipids in plasma with significant negative correlation with the stool water content. PC, phosphatidylcholine; LPC lysophosphatidylcholine; PE, phosphatidylethanolamine; LPE, lysophosphatidylethanolamine; TG, triglyceride; HexCer, hexosylceramide.
Figure 7
Figure 7
Urinary lipidomics. (a) Distribution (the number of lipid-species within one lipid class) of lipid components in the urine. (b) Lipids in urine with a significant positive correlation with the stool water content. PC, phosphatidylcholine; LPC: lysophosphatidylcholine; PE, phosphatidylethanolamine; LPE, lysophosphatidylethanolamine; TG, triglyceride; HexCer, hexosylceramide; DG, diglyceride.
Figure 8
Figure 8
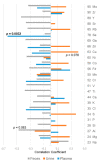
Correlation coefficients between trace elements in plasma, urine, or feces, and stool water content. The numbers next to the bar graph are the p-values. There were no significant differences (p > 0.05) except for the two mentioned on the graphs. Gray bars: feces samples; orange bars: urine samples; and blue bars: plasma samples.
Figure 9
Figure 9
Fecal microbial diversity and their relationship with fecal water content. (a) Summary of Spearman’s correlation coefficients reflecting the relationship between ASV abundance and water content. Violin plots show the distribution of correlation coefficients for all ASVs analyzed and grouped according to taxonomic affiliation (y-axis). Non-significant correlation coefficients (adjusted p-value threshold of 0.1) are shown as dark gray circles, and significant negative and positive correlations are plotted as blue and red circles, respectively. (b) Scatter plots of ASV abundance and water content for ASVs with the most significant positive (top) and negative (bottom) correlations (*** adjusted p-value of <0.01 and ** adjusted p-value of < 0.05). Graphics for all ASVs with significant correlations are shown in Supplementary Figures S1 and S2. Note that ASVs with zero abundances in the rarified ASV tables are shown as light gray symbols, plotted at a pseudo-abundance of 0.001%.

Similar articles

References

    1. Phillips K.A., Bales K.L., Capitanio J.P., Conley A., Czoty P.W., ’t Hart B.A., Hopkins W.D., Hu S.-L., Miller L.A., Nader M.A., et al. Why primate models matter. Am. J. Primatol. 2014;76:801–827. doi: 10.1002/ajp.22281. - DOI - PMC - PubMed
    1. Colman R.J. Non-human primates as a model for aging. Biochim. Biophys. Acta Mol. Basis Dis. 2018;1864:2733–2741. doi: 10.1016/j.bbadis.2017.07.008. - DOI - PMC - PubMed
    1. Misra B.B., Bassey E., Bishop A.C., Kusel D.T., Cox L.A., Olivier M. High-resolution gas chromatography/mass spectrometry metabolomics of non-human primate serum. Rapid Commun. Mass Spectrom. 2018;32:1497–1506. doi: 10.1002/rcm.8197. - DOI - PMC - PubMed
    1. Hird D.W., Anderson J.H., Bielitzki J.T. Diarrhea in nonhuman primates: A survey of primate colonies for incidence rates and clinical opinion. Lab. Anim. Sci. 1984;34:465–470. - PubMed
    1. Gottlieb D.H., Del Rosso L., Sheikhi F., Gottlieb A., McCowan B., Capitanio J.P. Personality, environmental stressors, and diarrhea in Rhesus macaques: An interactionist perspective. Am. J. Primatol. 2018;80:e22908. doi: 10.1002/ajp.22908. - DOI - PMC - PubMed

LinkOut - more resources