. 2021 Sep 28;19(10):546.
doi: 10.3390/md19100546.

A Marine λ-Oligocarrageenan Inhibits Migratory and Invasive Ability of MDA-MB-231 Human Breast Cancer Cells through Actions on Heparanase Metabolism and MMP-14/MMP-2 Axis

Affiliations

A Marine λ-Oligocarrageenan Inhibits Migratory and Invasive Ability of MDA-MB-231 Human Breast Cancer Cells through Actions on Heparanase Metabolism and MMP-14/MMP-2 Axis

Rémi Cousin et al. Mar Drugs. .

Abstract

Sugar-based molecules such as heparins or natural heparan sulfate polysaccharides have been developed and widely studied for controlling heparanase (HPSE) enzymatic activity, a key player in extracellular matrix remodelling during cancer pathogenesis. However, non-enzymatic functions of HPSE have also been described in tumour mechanisms. Given their versatile properties, we hypothesized that sugar-based inhibitors may interfere with enzymatic but also non-enzymatic HPSE activities. In this work, we assessed the effects of an original marine λ-carrageenan derived oligosaccharide (λ-CO) we previously described, along with those of its native counterpart and heparins, on cell viability, proliferation, migration, and invasion of MDA-MB-231 breast cancer cells but also of sh-MDA-MB-231 cells, in which the expression of HPSE was selectively downregulated. We observed no cytotoxic and no anti-proliferative effects of our compounds but surprisingly λ-CO was the most efficient to reduce cell migration and invasion compared with heparins, and in a HPSE-dependent manner. We provided evidence that λ-CO tightly controlled a HPSE/MMP-14/MMP-2 axis, leading to reduced MMP-2 activity. Altogether, this study highlights λ-CO as a potent HPSE "modulator" capable of reducing not only the enzymatic activity of HPSE but also the functions controlled by the HPSE levels.

Keywords: MDA-MB-231; MMP-14; breast cancer; heparanase; heparin; metalloproteinase; oligosaccharide; polysaccharide; shRNA; λ-carrageenan.


Conflict of interest statement

The authors declare no conflict of interest.

Figures

Figure 1
Figure 1
Effects of the four sugars, Unfractionated Heparin (UFH), Low Molecular Weight Heparin (LMWH), native λ-Carrageenan (λ-CAR), and depolymerized λ-CAR (λ-CO) on parental MDA-MB-231 cell viability and proliferation rate. (A) MTT assay was used to analyse cell viability of cells treated with vehicle (control) or compounds at 100 µg/mL for 24 h. (B) Cells were counted after 24 h treatment with either vehicle (control) or compounds at 100 µg/mL. Values are the mean ± SEM of three independent experiments. ANOVA followed by post hoc Fisher’s LSD test. ns: non-significant. Control: parental MDA-MB-231 cell line.
Figure 2
Figure 2
Inhibitory effects of the four sugars on MDA cell migration and invasion. (A) Representative microphotographs and (B) Quantification of MDA cell migration upon vehicle (control), compounds (100 µg/mL) or OGT 2115 (5 µM) treatment for 24 h. Scale bar in A: 100 μm. (C) Representative microphotographs and (D) quantification of MDA cell invasion upon vehicle (control) or compounds (100 µg/mL) treatment for 24 h. Scale bar in C: 100 μm. Values are the mean ± SEM of four (A,B) or three (D) independent experiments. * p < 0.05; ** p < 0.01; *** p < 0.005; **** p < 0.001; ANOVA followed by post hoc Fisher’s LSD (for B,D). # p < 0.05; ## p < 0.01; ns: non-significant for (B,D); ANOVA followed by post hoc Fisher’s LSD between λ-CAR and λ-CO.
Figure 3
Figure 3
Effects of the four sugars on sh-MDA cells. (A) Analysis by RT-qPCR of HPSE gene expression 48 h after transfection of MDA-MB-231 (parental cells); MDA: transfected with a scramble shRNA; sh-MDA: transfected with sh-RNA against HPSE. (B) WB analysis of HPSE levels on MDA and sh-MDA cells and the corresponding quantifications normalised with β-actin. wcl: whole cell lysates. (C) Effects of the compounds on proliferation rate. sh-MDA cells were counted after treatment with either vehicle (control) or compounds at 100 µg/mL for 24 h. (D) MTT assay was used to analyse cell viability of sh-MDA cells treated with vehicle (control) or treated with compounds at 100 µg/mL for 24 h. (E) WB analysis of LC3 levels in MDA compared with sh-MDA and the corresponding quantifications normalised with β-actin. Ponceau S staining is shown as loading control. Values are the mean ± SEM of three independent experiments. *: p < 0.05; **: p < 0.01; ***: p < 0.005; ns: non-significant. ANOVA followed by post hoc Fisher’s LSD for (A,C,E); Student t test for (B). IB: immunoblot.
Figure 4
Figure 4
Inhibitory effects of the four sugars on sh-MDA cell migration and invasion. (A) Representative microphotographs and (B) Quantification of sh-MDA cell migration upon vehicle (control), compounds (100 μg/mL) or OGT 2115 (5 µM) treatment for 24 h. Scale bar in A: 100 μm. (C) Representative microphotographs and (D) quantification of sh-MDA cell invasion upon vehicle (control) or compounds (100 μg/mL) treatment for 24 h. Scale bar in (D): 100 μm. Values are the mean ± SEM of four (A,B) or three (D) independent experiments. * p < 0.05; ** p < 0.01; ns: non-significant; for (B,D); ANOVA followed by post hoc Fisher’s LSD (for B,D).
Figure 5
Figure 5
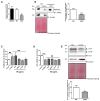
(A) Analysis by Western blot of HPSE levels in MDA and MCF-7 cells and the corresponding quantifications normalised with β-actin. Ponceau S staining is showed as loading control. (B) Quantification of MCF-7 migration upon vehicle (control), compounds (100 µg/mL), or OGT 2115 (5 µM) treatment for 24 h. Data are shown as the mean ± SEM of three independent experiments. Values are the mean ± SEM of three independent experiments. ns: non-significant, for (B), ANOVA followed by post hoc Fisher’s LSD. * p < 0.05; ns: non-significant Student t test for (A). IB: immunoblot.
Figure 6
Figure 6
Analyses of the expression of HPSE (A) and cathepsin L (B) by RT-qPCR after 24 h treatment of MDA cells with UFH and λ-CO at 100 µg/mL. (C) Western blot analyses of HPSE after 24 h treatment of UFH and λ-CO at 100 µg/mL and the corresponding quantifications normalised with β-actin of active HPSE (D) and pro-HPSE (E) in whole cell lysates (wcl) and cell supernatants (sup) after 24 h treatment of UFH and λ-CO at 100 µg/mL. The red dotted line indicates splicing of non-adjacent lanes in the same WB. Ponceau S staining is showed as the loading control. (F) Ratio of pro-HPSE sup/HPSE wcl. Values are the mean ± SEM of three independent experiments. * p < 0.05, *** p < 0.005; ns: non-significant, ANOVA followed by post hoc Fisher’s LSD. Control: MDA cells untreated. IB: immunoblot.
Figure 7
Figure 7
Analyses of the expression of MMP2 (A) and MMP9 (B) by RT-qPCR after 24 h treatment of MDA cells by UFH and λ-CO at 100 µg/mL. (C) Gelatin gel zymography images. Analyses of the activity of pro-MMP-9 (D), pro-MMP-2 (E), and MMP-2 (F) after 24 h treatment of UFH and λ-CO at 100 µg/mL. The white dotted line in C indicates splicing of non-adjacent lanes in the same zymogel. Data are shown as the mean ± SEM of three independent experiments. Values are the mean ± SEM of three independent experiments. * p < 0.05; **** p < 0.001; ns: non-significant, ANOVA followed by post hoc Fisher’s LSD. Ctl: Control: MDA cells untreated. ns: non-significant.
Figure 8
Figure 8
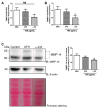
Analysis of the expression of TIMP2 (A) and MMP14 (B) encoding genes by RT-qPCR after treatment of MDA cells by UFH and λ-CO at 100 µg/mL for 24 h. (C) Analysis of MMP-14 levels in whole cell lysates after treatment of UFH and λ-CO at 100 µg/mL and the corresponding quantifications normalised with β-actin. The red dotted line indicates splicing of non-adjacent lanes in the same WB. Ponceau S staining is showed as the loading control. Data are shown as the mean ± SEM of three independent experiments. Values are the mean ± SEM of three independent experiments. * p < 0.05; ns: non-significant ANOVA followed by post hoc Fisher’s LSD. Ctl: Control: MDA cells untreated. IB: immunoblot.
Figure 9
Figure 9
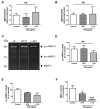
(A) Analysis of the expression of MMP-14 encoding gene by RT-qPCR on sh-MDA cells. (B) Gelatin gel zymography images and (C) Quantification of MMP-2 activity on MDA cells (control) compared to sh-MDA cells. (D) Gelatin gel zymography images showing level of MMP-2 in MDA cells compared to MCF-7 cells. (E) Quantification of MMP-2 activity on MDA cells (control) compared to MCF-7 cells. (F) Quantification of pro-MMP-9 levels in MDA cells (control) compared to sh-MDA and MCF-7 cells. Data are shown as the mean ± SEM of three independent experiments. Values are the mean ± SEM of three independent experiments. *: p < 0.05; **: p < 0.01. Student t test for (A,C). Control: MDA cells untreated. ns: non-significant. ANOVA followed by post hoc Fisher’s LSD for (F).

Similar articles

Cited by

References

    1. Mahtani R., Kittaneh M., Kalinsky K., Mamounas E., Badve S., Vogel C., Lower E., Schwartzberg L., Pegram M. Advances in therapeutic approaches for triple-negative breast cancer. Clin. Breast Cancer. 2020 doi: 10.1016/j.clbc.2020.12.011. - DOI - PubMed
    1. Hanahan D., Weinberg R.A. Hallmarks of cancer: The next generation. Cell. 2011;144:646–674. doi: 10.1016/j.cell.2011.02.013. - DOI - PubMed
    1. Sleeman J., Steeg P.S. Cancer metastasis as a therapeutic target. Eur. J. Cancer. 2010;46:1177–1180. doi: 10.1016/j.ejca.2010.02.039. - DOI - PMC - PubMed
    1. Gandalovičová A., Rosel D., Fernandes M., Veselý P., Heneberg P., Čermák V., Petruželka L., Kumar S., Sanz-Moreno V., Brábek J. Migrastatics—Anti-metastatic and anti-invasion drugs: Promises and challenges. Trends Cancer. 2017;3:391–406. doi: 10.1016/j.trecan.2017.04.008. - DOI - PMC - PubMed
    1. Schmid P., Cortes J., Pusztai L., McArthur H., Kümmel S., Bergh J., Denkert C., Park Y.H., Hui R., Harbeck N., et al. Pembrolizumab for early triple-negative breast cancer. N. Engl. J. Med. 2020;382:810–821. doi: 10.1056/NEJMoa1910549. - DOI - PubMed

LinkOut - more resources