. 2021 Oct 12;11(10):779.
doi: 10.3390/membranes11100779.

Characterization of Extracellular Vesicles Labelled with a Lipophilic Dye Using Fluorescence Nanoparticle Tracking Analysis

Affiliations

Characterization of Extracellular Vesicles Labelled with a Lipophilic Dye Using Fluorescence Nanoparticle Tracking Analysis

Getnet Midekessa et al. Membranes (Basel). .

Abstract

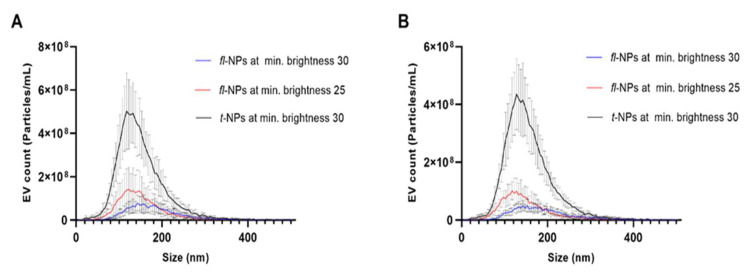
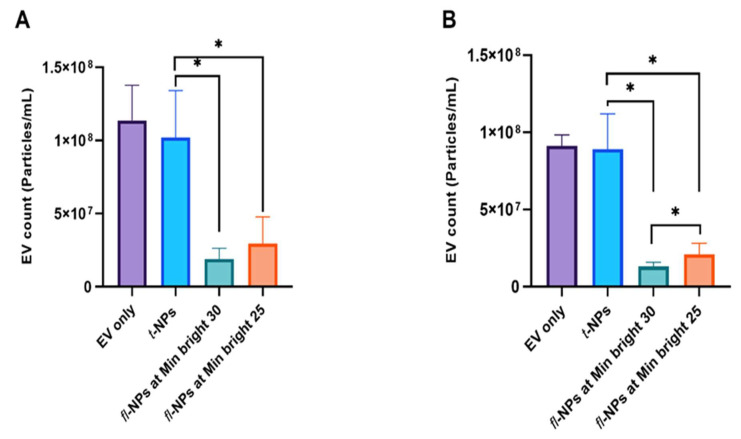
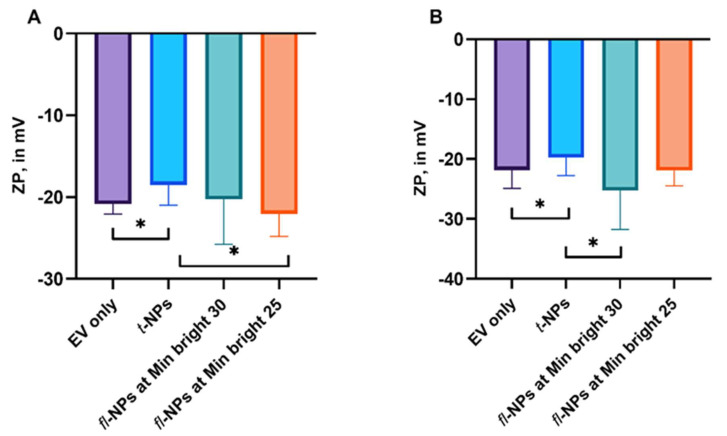
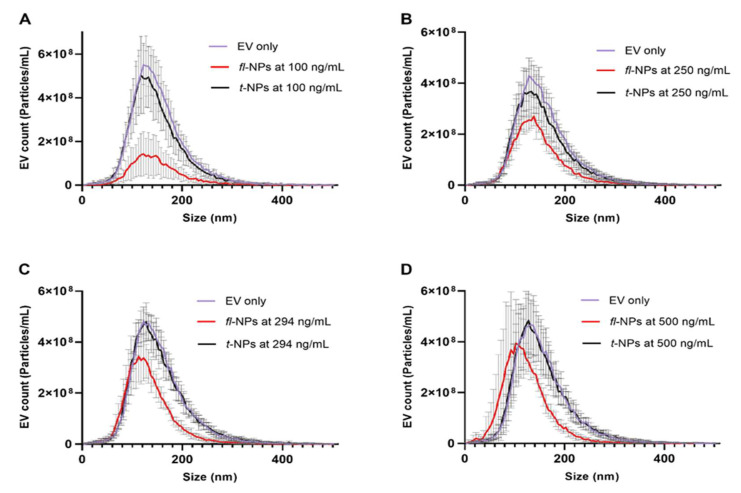
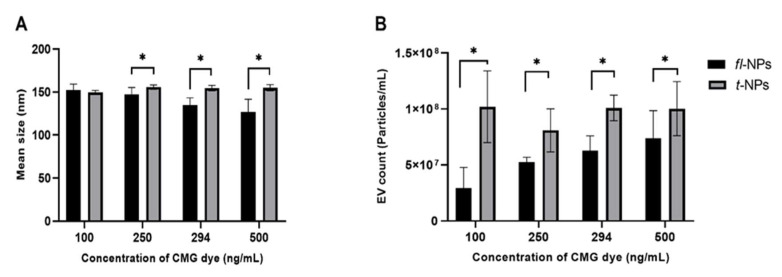
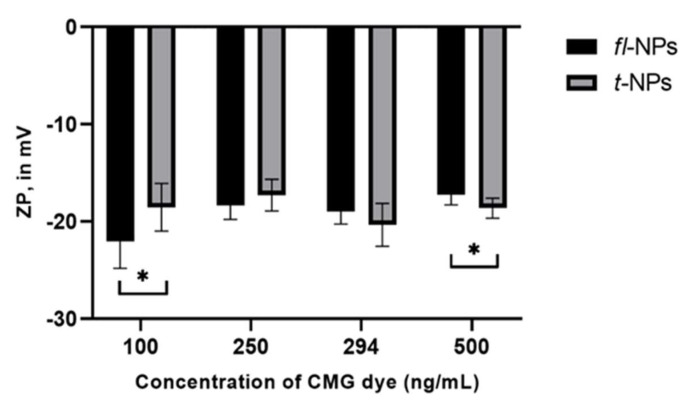
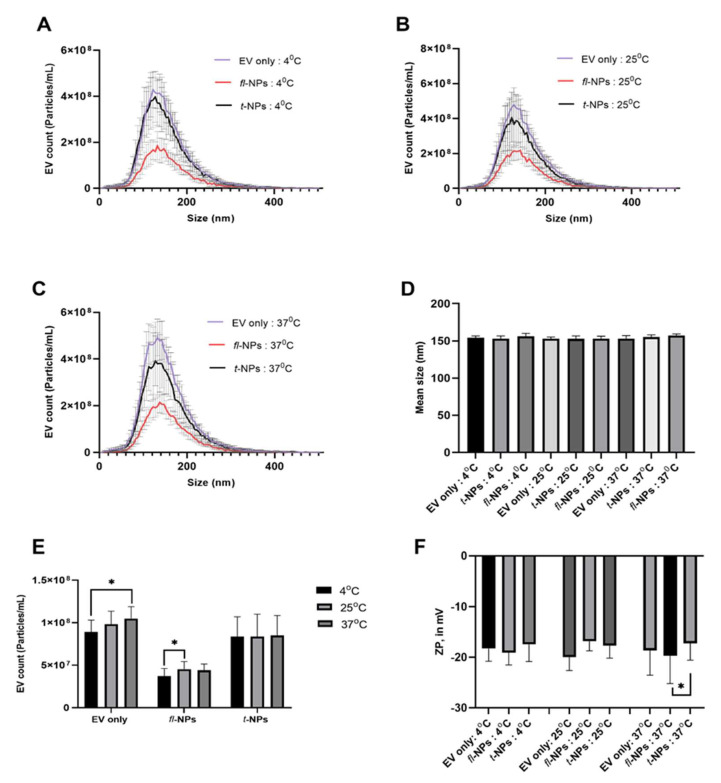
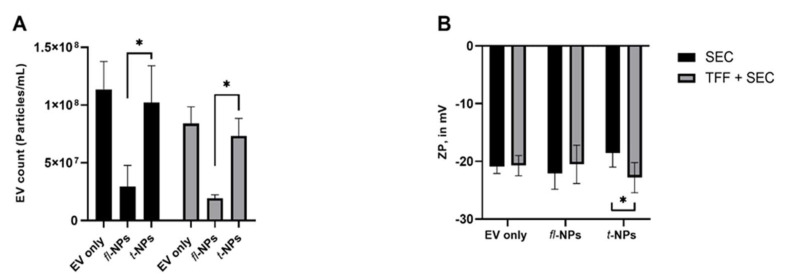
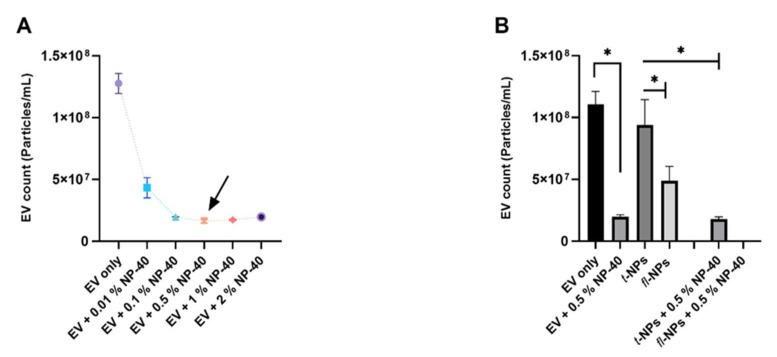
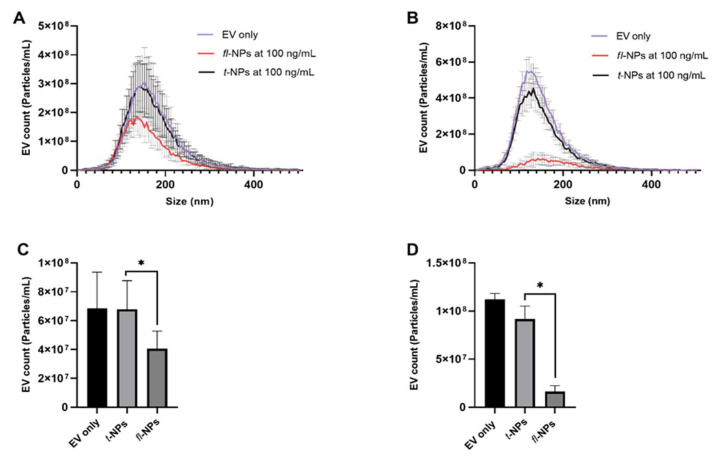
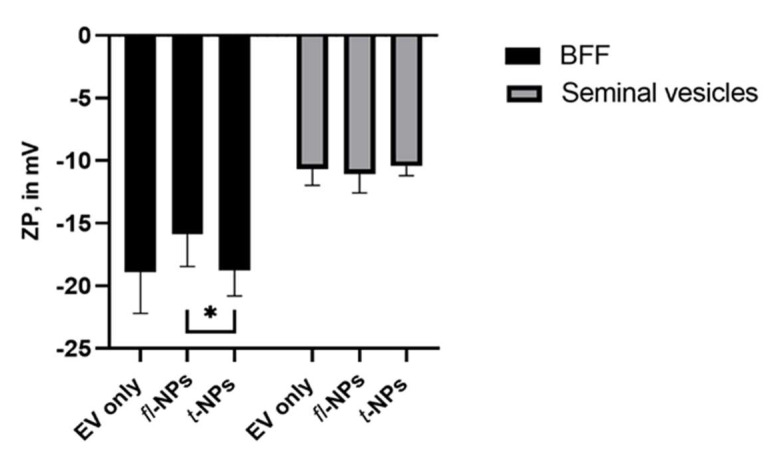
Research on extracellular vesicles (EVs) has intensified over the past decade, including fluorescent membrane labeling of EVs. An optimal fluorescent method requires the size of EVs to be preserved after labeling. Lipophilic fluorescent dyes, such as CellMask™ Green (CMG), have been widely used for this purpose. Here, we investigated conditions affecting the optimum CMG labeling of EVs derived from human choriocarcinoma cells (JAr) and different biological fluids using fluorescence NTA (fl-NTA). The effect of CMG labeling on the size, concentration and zeta potential (ZP) on JAr EVs purified with different methods were measured along with biological fluid-derived EVs. With the increase of CMG dye concentration, a significant decrease in the mean size of fluorescent nanoparticles (fl-NPs) was observed. The ZP of fl-NPs originating from JAr cells with the lowest and highest dye concentrations showed a significant shift towards more and less negative ZP values, respectively. Differences in the concentration of fl-NPs were observed for JAr EVs purified using size-exclusion chromatography (SEC) alone and SEC in combination with tangential flow filtration. The proportion of CMG labeling of NPs varied across different biological sources. CMG labeling may be a reliable technique for the detection of EVs using fl-NTA.

Keywords: NTA; detergent; extracellular vesicles; fluorescence; lipophilic dyes; zeta potential.


Conflict of interest statement

The funders had no role in the design of the study; in the collection, analyses, or interpretation of data; in the writing of the manuscript, or in the decision to publish the results.

Figures

Figure 1
Figure 1
Size profiles of CMG labeled fluorescent and total NPs originated from JAr and HCT116 cells measured at 30 and 25 minimum brightness threshold values using Zetaview®-NTA. Size profile distribution for CMG-labeled fl-NPs and t-NPs of JAr (A) and HCT 116 (B) EVs diluted in 1 × PBS at scattering and fluorescent NTA measurements. (Mean ± SD, n = 9).
Figure 2
Figure 2
Concentration of total and fluorescent NPs originated from JAr and HCT 116 cells. The concentrations for EVs only control (light purple boxes), CMG-labeled fluorescent (cyanish-green and orange boxes), and total NPs (light blue boxes) of JAr (A) and HCT 116 EVs (B), measured in fluorescent and scatter modes of ZetaView® NTA at two different minimum brightness threshold levels. The data points for fl-NPs measured at two different minimum brightness threshold levels were significantly different (p ≤ 0.05) than t-NPs measured at the highest brightness threshold, that is, 30 and thus were marked with an asterisk (*) symbol (mean ± SD, n = 9).
Figure 3
Figure 3
ZP measurement of total and fluorescent NPs for JAr and HCT 116 EVs labeled with CMG dye. The ZP for EVs only control (light purple boxes), CMG-labeled fluorescent (cyanish-green and orange boxes) and total NPs (light blue boxes) of JAr (A) and HCT 116 EVs (B) measured in the fluorescent and scattered mode of NTA at two different minimum brightness threshold levels. The ZP values of fl-NPs originating from JAr and HCT116 cells measured at minimum brightness threshold of 25 and 30 were significantly different (p ≤ 0.05) than the respective t-NPs originating from JAr and HCT116 cells, thus were marked with an asterisk (*) symbol. EVs were diluted in 1x PBS, and the ZP measurement was done at a neutral pH of 7.2 (mean ± SD, n = 9).
Figure 4
Figure 4
Effect of CMG concentration on the size profile distribution of fluorescent and total NPs of EVs measured using Zetaview®- NTA. (AD) Size profile distribution for fl-NPs originating from JAr cells measured at a minimum brightness threshold value of 25 with different CMG concentrations of 100, 250, 294 and 500 ng/mL respectively. EVs only as a control, fl and t-NPs of EVs diluted in 1× PBS and measured in fluorescent and scatter modes of NTA (mean ± SD, n = 9).
Figure 5
Figure 5
The mean size distribution and concentration for JAr EVs labeled with CellMask™ Green (CMG). All EV types were labeled with different concentrations of CMG (100, 250, 294 and 500 ng/mL respectively). Particle means size (A) and concentration (B) for respective fl and t-NPs originating from JAr cells measured in fluorescent and scatter modes. The mean particle size and concentration of fl-NPs were significantly different (p ≤ 0.05) than t-NPs at all concentrations of CMG, except the mean particle size comparison between fl-NPs and t-NPs at the lowest concentration of CMG. Thus, were marked with an asterisk (*) symbol (mean ± SD, n = 9).
Figure 6
Figure 6
ZP measurement of fluorescent and total NPs originating from JAr cells labeled with different concentrations of CMG dye (100, 250, 294 and 500 ng/mL respectively). The ZP values for fl and t-NPs at the lowest and highest concentrations of CMG were significantly different (p ≤ 0.05) than the corresponding t-NPs at 100 and 500 ng/mL of CMG dye. Thus, were marked with an asterisk (*) symbol. JAr EVs measured in fluorescent and scatter modes of NTA. EVs were diluted in 1× PBS, and the ZP measurement was done at a neutral pH of 7.2 (mean ± SD, n = 9).
Figure 7
Figure 7
The size distribution, concentration, and zeta potential of fluorescent and total NPs originating from JAr cells incubated at three different temperatures. Size distribution (AC), means particle size (D), particle concentration (E), and zeta potential (F) of EVs incubated at 4, 25, and 37 °C. EV only controls, fl-, and t-NPs of JAr EVs were measured in fluorescent and scatter modes of NTA. EVs were labeled with 100 ng/mL of CMG and fl-NPs were measured at a minimum brightness threshold value of 25. The concentration of fl-NPs of JAr EVs incubated at 4 °C was significantly different (p ≤ 0.05) than the fl-NPs of JAr EVs incubated at 25 °C. Thus, were marked with an asterisk (*) symbol. EVs were diluted in 1× PBS, and the ZP measurement was done at a neutral pH of 7.2 (mean ± SD, n = 9).
Figure 8
Figure 8
Size profile distribution for fluorescent and total NPs originating from JAr cells measured using Zetaview®- NTA. Size profile distribution (A,B) and particle mean size (C) for JAr EVs purified in SEC alone and combination of TFF. EVs were labeled with 100 ng/mL of CMG and fl-NPs were measured at a minimum brightness threshold value of 25. The mean particle size of fl-NPs of JAr EVs purified with TFF and SEC was significantly different (p ≤ 0.05) than the corresponding t-NPs of JAr EVs purified with TFF and SEC. Thus, were marked with an asterisk (*) symbol. EVs only as a control, fl-, and t-NPs of EVs were diluted in 1x PBS before being measured in fluorescent and scatter modes of NTA (mean ± SD, n = 9).
Figure 9
Figure 9
Concentration and zeta potential of fluorescent and total NPs for JAr EVs purified in SEC alone and combination of TFF. Particle concentration (A) and zeta potential (B) for respective EV only controls, fl-, and t-NPs of JAr EVs measured in fluorescent and scatter modes of NTA. All EV types were labeled with 100 ng/mL of CMG and fl-NPs were measured at a minimum brightness threshold value of 25. The concentration of fl-NPs of JAr EVs purified in SEC and in combination with TFF was significantly different (p ≤ 0.05) than the corresponding t-NPs of JAr EVs purified with SEC alone and in combination with TFF. Thus, were marked with an asterisk (*) symbol. EVs were diluted in 1× PBS, and the ZP measurement was done at a neutral pH of 7.2 (mean ± SD, n = 9).
Figure 10
Figure 10
Concentration of fluorescent and total particles originating from JAr cells after NP-40 detergent treatment. EVs were labeled with 100 ng/mL of CMG and fl-NPs were measured at a minimum brightness threshold value of 25. (A) EVs were treated with different concentrations (0.01%, 0.1%, 0.5%, 1%, and 2%) of NP-40. EVs membrane was disrupted and saturation was reached at 0.5% concentration of NP-40. (B) EVs with or without CMG dye were treated with 0.5% of NP-40 and their respective particle concentration. The concentration of t-NPs of JAr EVs before 0.5% of NP-40 treatment was significantly different (p ≤ 0.05) than the t-NPs of JAr EVs after NP-40 treatment. Thus, were marked with an asterisk (*) symbol. EV only controls, fl-, and t-NPs JAr EVs were diluted in 1x PBS and particle concentration was measured in fluorescent and scatter modes of NTA. (Mean ± SD, n = 9).
Figure 11
Figure 11
The size distribution and concentration of fluorescent and total NPs for BFF and seminal plasma-derived EVs purified with SEC columns. EVs were labeled with 100 ng/mL of CMG and fl-NPs were measured at a minimum brightness threshold value of 25. Size distribution (A,B), and particle concentration (C,D) of BFF and seminal plasma-derived EVs incubated at 25 °C respectively. The concentration of fl-NPs of BFF and seminal plasma-derived EVs were significantly different (p ≤ 0.05) than the corresponding t-NPs of BFF and seminal plasma-derived EVs. Thus, were marked with an asterisk (*) symbol. EV only controls, fl-, and t-NPs of BFF and seminal plasma-derived EVs were measured at fluorescent and scatter mode of NTA. EVs were diluted in 1× PBS, and the particle concentration measurement was done at a neutral pH of 7.2 (mean ± SD, n = 9).
Figure 12
Figure 12
Zeta potential of fluorescent and total NPs for BFF and seminal plasma-derived EVs purified in SEC. All EV types were labeled with 100 ng/mL of CMG and fl-NPs were measured at a minimum brightness threshold value of 25. The ZP value for fl-NPs of BFF EVs was significantly different (p ≤ 0.05) than the corresponding t-NPs of BFF. Thus, were marked with an asterisk (*) symbol. The zeta potential for respective EV only controls, fl-, and t-NPs of BFF and seminal plasma-derived EVs measured in fluorescent and scatter modes of NTA. EVs were diluted in 1× PBS, and the ZP measurement was done at a neutral pH of 7.2 (mean ± SD, n = 9).

Similar articles

Cited by

References

    1. Kalluri R., LeBleu V.S. The biology, function, and biomedical applications of exosomes. Science. 2020;367:eaau6977. doi: 10.1126/science.aau6977. - DOI - PMC - PubMed
    1. Théry C., Amigorena S., Raposo G., Clayton A. Isolation and Characterization of Exosomes from Cell Culture Supernatants and Biological Fluids. Curr. Protoc. Cell Biol. 2006;30:3–22. doi: 10.1002/0471143030.cb0322s30. - DOI - PubMed
    1. Tkach M., Théry C. Communication by Extracellular Vesicles: Where We Are and Where We Need to Go. Cell. 2016;164:1226–1232. doi: 10.1016/j.cell.2016.01.043. - DOI - PubMed
    1. Yáñez-Mó M., Siljander P.R.-M., Andreu Z., Zavec A.B., Borràs F.E., Buzas E.I., Buzas K., Casal E., Cappello F., Carvalho J., et al. Biological properties of extracellular vesicles and their physiological functions. J. Extracell. Vesicles. 2015;4:27066. doi: 10.3402/jev.v4.27066. - DOI - PMC - PubMed
    1. Van Niel G., D’Angelo G., Raposo G. Shedding light on the cell biology of extracellular vesicles. Nat. Rev. Mol. Cell Biol. 2018;19:213–228. doi: 10.1038/nrm.2017.125. - DOI - PubMed

LinkOut - more resources