. 2022 Apr;13(4):281-301.
doi: 10.1007/s13238-021-00885-0. Epub 2021 Oct 22.

Drug target inference by mining transcriptional data using a novel graph convolutional network framework

Affiliations

Drug target inference by mining transcriptional data using a novel graph convolutional network framework

Feisheng Zhong et al. Protein Cell. 2022 Apr.

Abstract

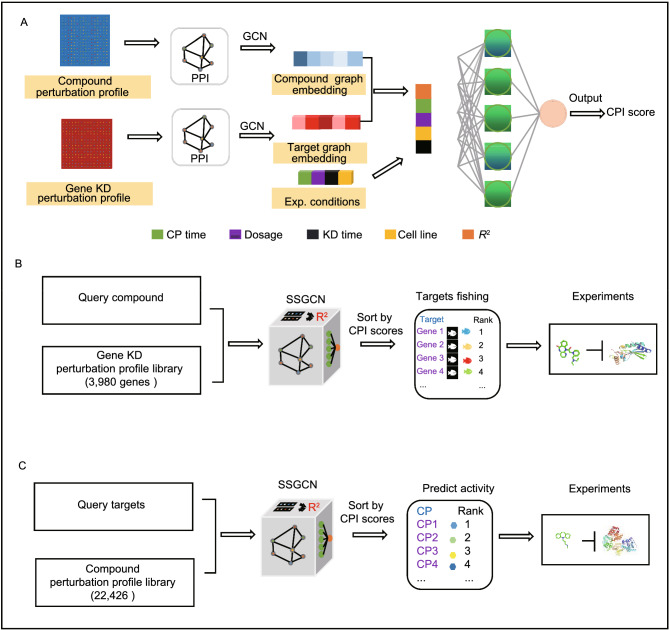
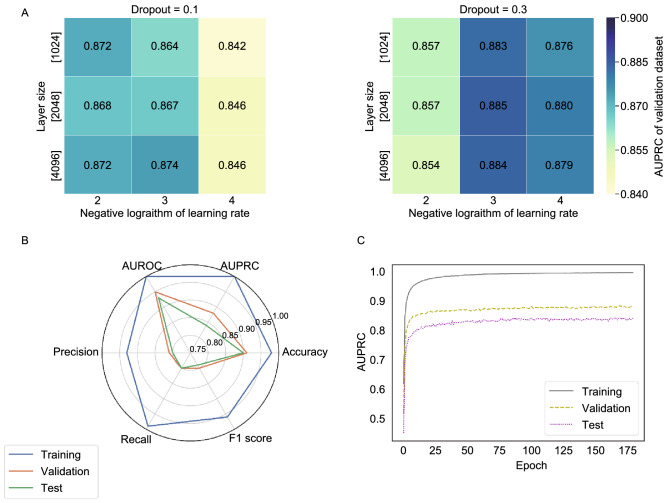
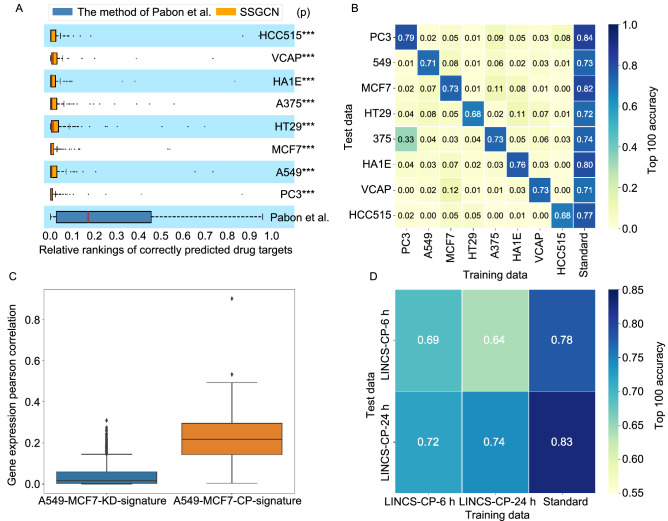
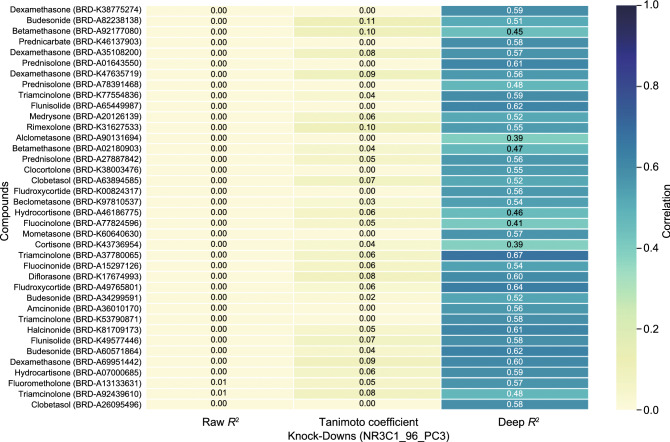
A fundamental challenge that arises in biomedicine is the need to characterize compounds in a relevant cellular context in order to reveal potential on-target or off-target effects. Recently, the fast accumulation of gene transcriptional profiling data provides us an unprecedented opportunity to explore the protein targets of chemical compounds from the perspective of cell transcriptomics and RNA biology. Here, we propose a novel Siamese spectral-based graph convolutional network (SSGCN) model for inferring the protein targets of chemical compounds from gene transcriptional profiles. Although the gene signature of a compound perturbation only provides indirect clues of the interacting targets, and the biological networks under different experiment conditions further complicate the situation, the SSGCN model was successfully trained to learn from known compound-target pairs by uncovering the hidden correlations between compound perturbation profiles and gene knockdown profiles. On a benchmark set and a large time-split validation dataset, the model achieved higher target inference accuracy as compared to previous methods such as Connectivity Map. Further experimental validations of prediction results highlight the practical usefulness of SSGCN in either inferring the interacting targets of compound, or reversely, in finding novel inhibitors of a given target of interest.

Keywords: deep learning; drug target inference; experimental verification; transcriptomics.


Figures

Figure 1
Figure 1
Target prediction using the SSGCN model. (A) Architecture of the SSGCN. Compound graph embedding is obtained by a spectral-based graph convolutional network (GCN) to integrate the protein-protein interaction (PPI) network topological structure information and compound perturbation profile. Target graph embedding is obtained by another GCN to integrate PPI and gene knockdown perturbation profile. The correlation coefficient Pearson R2 is calculated between the compound graph embedding and target graph embedding. The CP time is the duration of compound (CP) treatment and the KD time is the duration of gene knockdown (KD) perturbation. CPI score is the classification probability of whether the compound interacts with the protein. (B) Pipeline of the target inference using the SSGCN model. (C) Pipeline of identifying the novel active compound using the SSGCN model
Figure 2
Figure 2
Heat maps for hyperparameters search. (A) The colormap reflects the magnitude of AUPRC (the area under precision recall curve) value on the validation dataset. The detailed description of the model evaluation metric can be found in the METHODS section of the article (Table 3). (B) Model performance shown in radar chart with six evaluation metric and (C) AUPRC-epoch curves. The “epoch” means an entire dataset is passed through a neural network once
Figure 3
Figure 3
Model comparison and analysis. (A) Performance of the SSGCN models tested on different cell lines compared with that of the model developed by Pabon et al. (B) Effects of the cell lines on target prediction performance. The standard method is the SSGCN model trained on the KD profiles of all 8 cell lines. (C) The correlation between the KD signatures of A549 and MCF7 cells is significantly lower than that between the CP-signatures of these two cell lines. (D) Effects of the compound treatment time on target prediction performance
Figure 4
Figure 4
Correlation analysis of gene expression profiles. The raw R2, KEGG Tanimoto coefficient and deep R2 were used to represent the correlations of the raw gene expression values, KEGG pathway level features and graph embedding, respectively. NR3C1_96_PC3 means the gene NR3C1 knockdown profiles was selected with a duration of 96 h in the PC3 cell line
Figure 5
Figure 5
Examples of predicted targets (top 30) using the LINCS phase II data in PC3 cell lines. The following compounds were used for target prediction: (A) SB-939, (B) alpelisib, (C) PFI-1 and (D) VE-821. The nodes in rectangles represent compounds, and the nodes in circles represent the predicted targets. Predicted targets with a higher rank are indicated by a larger circle size. The corresponding true targets are indicated by red borders. The links between predicted targets denote protein-protein interactions that are curated from the STING database with a combined score greater than or equal to 800. Protein classification annotations come from ChEMBL database
Figure 6
Figure 6
Compound-centric prediction of CYPA as a novel target for NFV. (A–C) NFV inhibited the transcription and secretion of IL-2 in a dose-dependent manner. Jurkat T cells were treated with different concentration of NFV or CsA for 2 h, following stimulation with PMA (100 nmol/L) and Ionomycin (10 μmol/L) for 24 h. After treatment, cells and culture supernatant were collected and subjected to RT-qPCR and ELISA. IL2 mRNA levels were normalized to ACTB and fold induction was calculated relative to untreated cells, data showed pooled technical replicates from three independent experiments. (D) CYPA peptidyl-prolyl cis-trans isomerase (PPIase) activity was assessed using the α-chymotrypsin-coupled assay. Isomerization of the succinyl-AAPF-pNA peptide substrate was reflected by an increase in absorbance at 390 nm. The curves represent isomerization of this substrate at 4 °C over the course of 360 s in the absence of CYPA (Blank), or in the presence of 2 μmol/L CYPA, or in the presence of 2 μmol/L CYPA incubated with 10 μmol/L NFV or CsA. Data are representative of three independent experiments with similar results. (E) NFV bound to CYPA protein as shown by surface plasmon resonance measurements. Graphs of equilibrium response unit responses versus compound concentrations were plotted. (F–H) Thermostability of CYPA treated with 0, 50, 100, 200 μmol/L NFV. The thermal stability of CYPA was quantified by the ΔTm in pooled technical replicates from at least three independent experiments. Data are represented as mean ± SD (n = 6), ***, P < 0.001; by 2-tailed, unpaired t-test. (I) The putative binding mode of NFV (stick) to human CYPA (surface, 2X2C). Error bars represent SD around the mean (A–C, H)
Figure 7
Figure 7
Target-centric prediction of MTX as a novel ENPP1 inhibitor. (A and B) Inhibition of MTX and E1 on hydrolysis of p-Nph-5’-TMP (A) or ATP (B) by ENPP1 in vitro. (C) The in silico simulation analysis of the binding site of the ENPP1 (cyan, 4GTW) with MTX (violet). (D) Representative immunoblot for the effect of MTX on thermal stability of ENPP1 protein in cellular thermal shift assay. 293T cell lysates with or without MTX (50 μmol/L) treatment were incubated at different temperatures, then ENPP1 turnover was monitored by Western blot. (E and F) MTX and E1 increased the transcription (E) and secretion (F) of IFN-β in cGAMP treated THP-1-derived macrophages. THP-1-derived macrophages were treated with MTX (20 μmol/L) or E1 (20 μmol/L), following stimulation with cGAMP (500 nmol/L) for 24 h, then cells and culture supernatant were collected and subject to RT-qPCR and ELISA. Data are represented as mean ± SD (n = 3). *, P < 0.05; ***, P < 0.001; by 2-tailed, unpaired t-test. (G–J) MTX increased the transcription of IFNB1 (G), CXCL10 (I), IL6 (J) and secretion of IFN-β (H) in a dose-dependent manner in cGAMP treated THP-1-derived macrophages.THP-1-derived macrophages were treated with the indicated concentration of MTX, following stimulation with cGAMP (500 nmol/L) for 24 h, then cells and culture supernatant were collected and subjected to RT-qPCR and ELISA. (K–N) MTX increased the transcription of Ifnb1 (K), Cxcl10 (M), Il6 (N) and secretion of IFN-β (l) in a dose-dependent manner in cGAMP treated RAW 264.7 cells. RAW 264.7 cells were treated with the indicated concentration of MTX, following stimulation with cGAMP (5 μmol/L) for 24 h, then cells and culture supernatant were collected and subjected to RT-qPCR and ELISA. All above data showed pooled technical replicates from three independent experiments. mRNA levels were normalized to ACTB and fold induction was calculated relative to untreated cells. Error bars represent SD around the mean (A, B, E–N)
Figure 8
Figure 8
Pipeline of the data processing. (A) Processing pipeline for LINCS L1000 data. (B) Processing pipeline for STRING v11.0 PPI data. “trt_sh” and “trt_cp” are official tags that denote knock down treatment and compound treatment in LINCS dataset respectively. “cell type filter” filtered out other cell type data except those in eight cell lines (A375, A549, HA1E, HCC515, HT29, MCF7, PC3, and VCAP). “Landmark filter” filtered out other gene values in signatures except those in 978 “landmark” genes. The “combined score” is measure score offered by STRING database for the confidence of several types of evidence which support a protein-protein association

References

    1. Abbas AK, Trotta E, Simeonov DR, Marson A, Bluestone JA (2018) Revisiting IL-2: biology and therapeutic prospects. Sci Immunol 3:eaat1482. - PubMed
    1. André F, Ciruelos E, Rubovszky G, Campone M, Loibl S, Rugo HS, Iwata H, Conte P, Mayer IA, Kaufman B. Alpelisib for PIK3CA-mutated, hormone receptor-positive advanced breast cancer. New Engl J Med. 2019;380:1929–1940. - PubMed
    1. Anighoro A, Bajorath J, Rastelli G. Polypharmacology: challenges and opportunities in drug discovery. J Med Chem. 2014;57:7874–7887. - PubMed
    1. Arshad U, Pertinez H, Box H, Tatham L, Rajoli RKR, Curley P, Neary M, Sharp J, Liptrott NJ, Valentijn A, et al. Prioritization of anti-SARS-Cov-2 drug repurposing opportunities based on plasma and target site concentrations derived from their established human pharmacokinetics. Clin Pharmacol Ther. 2020 doi: 10.1002/cpt.1909. - DOI - PMC - PubMed
    1. Ashburn TT, Thor KB. Drug repositioning: Identifying and developing new uses for existing drugs. Nat Rev Drug Discov. 2004;3:673–683. - PubMed

Publication types