. 2021 Oct 22;7(43):eabj5056.
doi: 10.1126/sciadv.abj5056. Epub 2021 Oct 22.

Functions predict horizontal gene transfer and the emergence of antibiotic resistance

Affiliations

Functions predict horizontal gene transfer and the emergence of antibiotic resistance

Hao Zhou et al. Sci Adv. .

Abstract

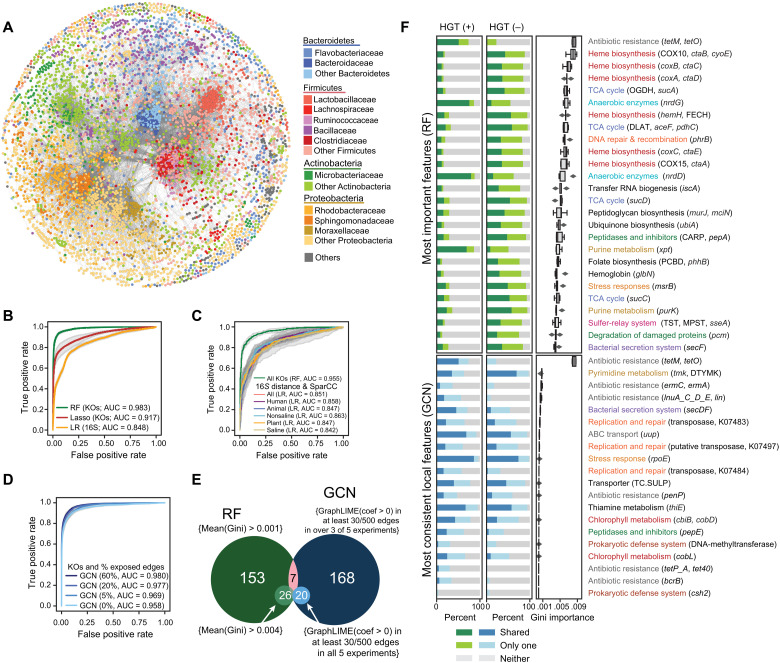
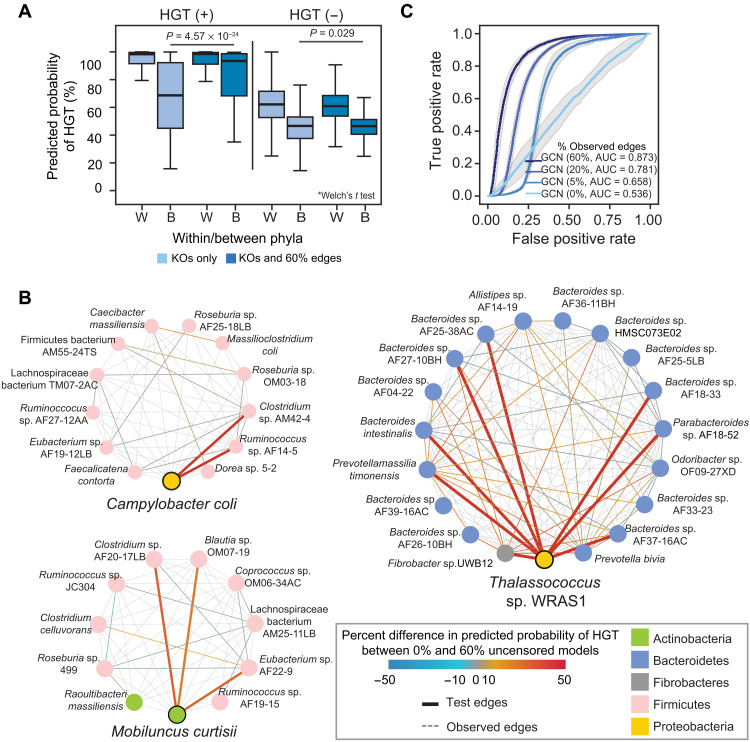
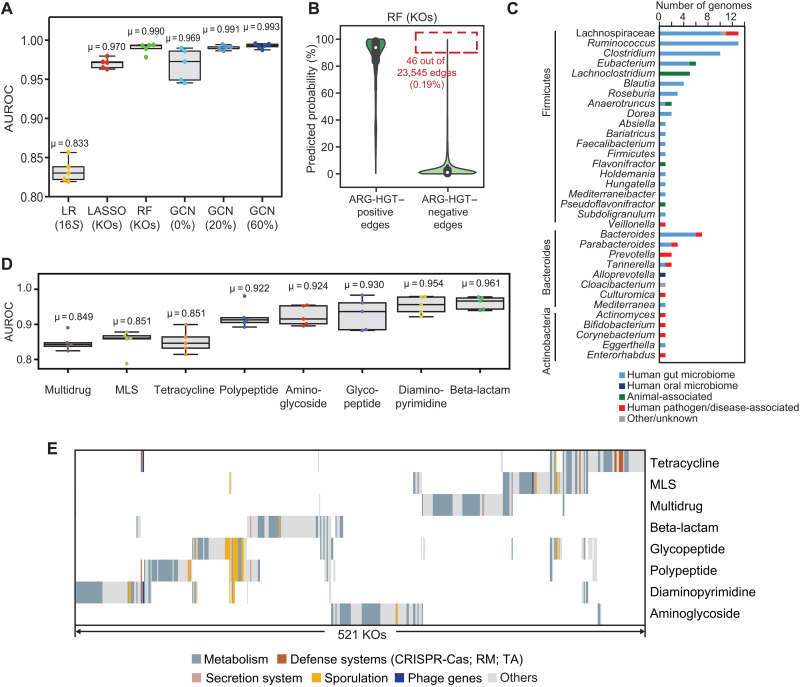
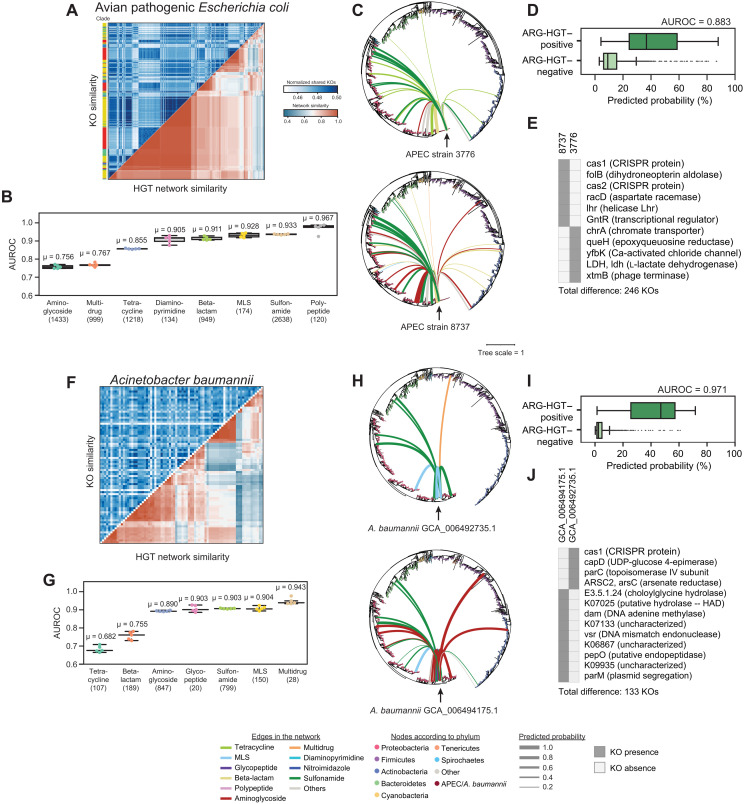
Phylogenetic distance, shared ecology, and genomic constraints are often cited as key drivers governing horizontal gene transfer (HGT), although their relative contributions are unclear. Here, we apply machine learning algorithms to a curated set of diverse bacterial genomes to tease apart the importance of specific functional traits on recent HGT events. We find that functional content accurately predicts the HGT network [area under the receiver operating characteristic curve (AUROC) = 0.983], and performance improves further (AUROC = 0.990) for transfers involving antibiotic resistance genes (ARGs), highlighting the importance of HGT machinery, niche-specific, and metabolic functions. We find that high-probability not-yet detected ARG transfer events are almost exclusive to human-associated bacteria. Our approach is robust at predicting the HGT networks of pathogens, including Acinetobacter baumannii and Escherichia coli, as well as within localized environments, such as an individual’s gut microbiome.


Figures

Fig. 1.
Fig. 1.. The functional content of genomes accurately predicts HGT rates.
(A) A network diagram showing organisms (nodes) connected by at least one observed HGT event (edges). Organisms are colored according to taxonomy. (B) Receiver operating characteristic (ROC) curves for an LR using only 16S rRNA sequence similarity (yellow), a Lasso model using functions (KOs) (red), and an RF model using KOs (green). Area under the curve (AUC) values are shown. Details are in the Supplemental Information. (C) ROC curves for LR using full-length 16S rRNA similarity and ecological correlations based on sequences with near-identical similarity with 16S V4 rRNA sequences from the Earth Microbiome Project (EMP) and for an RF model using the KOs of organisms identified in the EMP. Details are in the Supplementary Materials. (D) ROC curves for graphical convolutional neural net (GCN) models, using functions (KOs) for each genome, as well as an uncensored portion of the test set’s adjacency matrix for predictions. AUC values are shown. Details are in the Supplementary Materials. (E) A Venn diagram of the number of KOs deemed important by the RF model and the number of KOs with positive GraphLime coefficients, as stated in the diagram. (F) KOs are listed according to whether they were found important by the RF model [mean(Gini) > 0.004] (top) or consistently had positive GraphLime coefficients in at least 30 of 500 edges in all five experiments (bottom). The mean(Gini) from the RF is shown, in addition to the percentage of HGT-positive and HGT-negative edges for which a feature is shared, present in one or absent from both.
Fig. 2.
Fig. 2.. Network topology is sufficient for predicting HGT.
(A) Predicted values for the GCN used in Fig. 1D of HGT-positive and HGT-negative edges for those involving species from the same phylum (within) or different phylum (between) when predicting on a test set with fully censored or 60% uncensored edges. The middle of the boxplot is the median, and edges are quartiles. P values are provided for the differences between predicted values for interphyla HGT-positive and HGT-negative edges using a Welch’s t test. (B) Three examples of the HGT-positive connections between organisms in the test sets used in the GCNs shown in Fig. 1D. In each, a single organism (Campylobacter coli, Mobiluncus curtisii, or Thalassococcus sp. WRAS1) is depicted with all of HGT-positive connections within the network. Test edges corresponding to interphylum transfers involving these species are thickened. Edges are either colored according to the difference in the HGT prediction in the fully censored and 60% uncensored networks or are dotted, gray edges, representing positive HGT edges that were uncensored in the test data. Genomes (nodes) are colored according to phylum. (C) ROC curves for GCN models using only the adjacency matrix for predictions, with 0, 5, 20, or 60% of the edges uncensored in the test set. These iterations were performed on the same training and test sets as in Fig. 1D. AUC values are shown.
Fig. 3.
Fig. 3.. The transfer of ARGs genes is predictable.
(A) Area under the ROC curves for models predicting HGT involving ARGs is plotted for an LR model using only 16S rRNA sequence similarity, a Lasso model using the presence/absence of KOs for each genome, an RF model using KOs, and GCN models using KOs with decreasing censorship of the network (0 to 60% edges). Details are in the Supplementary Materials. Mean AUROC values (μ) are provided. (B) Prediction scores for ARG-HGT–positive and ARG-HGT–negative edges from the RF model using KOs [shown in (A)] are plotted. Of 23,545 total ARG-HGT-negative edges tested over five experiments, 46 HGT-negative edges (0.19%) had prediction scores over 0.9 (red dotted outline). (C) Genomes involved in the 46 ARG-HGT–negative edges that have predictions over 90%, depicted in the outlined box in (B), according to their phylum and origin of isolation, where available. For comparison, 46 HGT-negative edges chosen at random and depicted according to their origin of isolation in fig. S13. (D) Area under the ROC curves for multiclass RF models predicting HGT of genes conferring resistance to each specific class of antibiotics. Mean AUROC values (μ) are provided. (E) The top 1% of important KOs for each ARG class-specific model. Binary matrix was clustered on the basis of the presence and absence of important KOs by Pearson correlation. KOs were colored according to their annotation in the categories listed. KEGG pathway and BRITE functions of important KOs for each antibiotic class are in table S6.
Fig. 4.
Fig. 4.. HGT is predictable across pathogenic strains of the same species.
(A) A heatmap showing normalized shared KOs for 445 avian pathogenic E. coli (APEC) isolates (top left) and their ARG-specific HGT network Jaccard similarity. Isolates are clustered according to HGT network similarity. The phylogenetic clade for each isolate is plotted adjacent to the heatmap. (B) Area under the ROC curves are plotted for the ARG classes for the APEC isolates for five RF models using the same dataset as Fig. 1, excluding E. coli and/or any organisms with 97% similarity to the 16S rRNA of any genome in the test set. Mean AUCs are provided above the boxplots. Boxplots represent median and quartile values. The number of edges containing at least one class-specific ARG is noted below the ARG class names. (C) The ARG-specific HGT network of two APEC isolates. The phylogenetic tree of all isolates includes 12,518 genomes from the original network, and 445 APEC isolates is shown with edges corresponding to predicted HGT events involving ARGs. The color of each edge corresponds to the ARG class, whereas the thickness of each edge is relative to the probability of ARG-HGT. (D) The distribution of ARG-HGT probabilities from the ARG-HGT RF model for ARG-HGT–positive (top) and ARG-HGT–negative (bottom) edges is shown. The AUROC is provided. (E) Important KOs that distinguish the two APEC strains in (C) are shown. (F to J) Same as (A) to (E) but for 96 clinically relevant Acinetobacter baumannii isolates.
Fig. 5.
Fig. 5.. Predictions of HGT are accurate for small ecology–specific datasets.
(A) The number of genomes and species in each of four datasets: ocean surface sampling, soil microbial communities, rhizomes from three plant species, and human gut microbiomes from 11 individuals. (B) The number of KOs overlapping with the HGT model (shown in Fig. 1B) used for predictions. (C) Model performance, defined by AUROC, for HGT predictions within the ocean, soil, plant and human gut microbiome datasets, using either the LR model based on 16S rRNA distances, the GCN model using gene functions (KOs) with either none or 5% of the network exposed, or the RF model using gene functions (KOs).

References

    1. Smillie C. S., Smith M. B., Friedman J., Cordero O. X., David L. A., Alm E. J., Ecology drives a global network of gene exchange connecting the human microbiome. Nature 480, 241–244 (2011). - PubMed
    1. Azad R. K., Lawrence J. G., Towards more robust methods of alien gene detection. Nucleic Acids Res. 39, e56 (2011). - PMC - PubMed
    1. Beaulaurier J., Zhu S., Deikus G., Mogno I., Zhang X.-S., Davis-Richardson A., Canepa R., Triplett E. W., Faith J. J., Sebra R., Schadt E. E., Fang G., Metagenomic binning and association of plasmids with bacterial host genomes using DNA methylation. Nat. Biotechnol. 36, 61–69 (2018). - PMC - PubMed
    1. Acman M., van Dorp L., Santini J. M., Balloux F., Large-scale network analysis captures biological features of bacterial plasmids. Nat. Commun. 11, 2452 (2020). - PMC - PubMed
    1. Redondo-Salvo S., Fernández-López R., Ruiz R., Vielva L., de Toro M., Rocha E. P. C., Garcillán-Barcia M. P., de la Cruz F., Pathways for horizontal gene transfer in bacteria revealed by a global map of their plasmids. Nat. Commun. 11, 3602 (2020). - PMC - PubMed