. 2021 Oct 22;7(43):eabg4135.
doi: 10.1126/sciadv.abg4135. Epub 2021 Oct 22.

Computer vision reveals hidden variables underlying NF-κB activation in single cells

Affiliations

Computer vision reveals hidden variables underlying NF-κB activation in single cells

Parthiv Patel et al. Sci Adv. .

Abstract

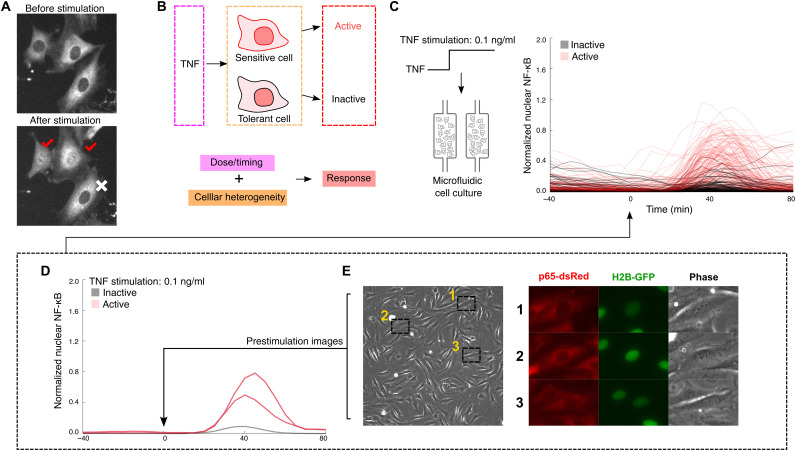
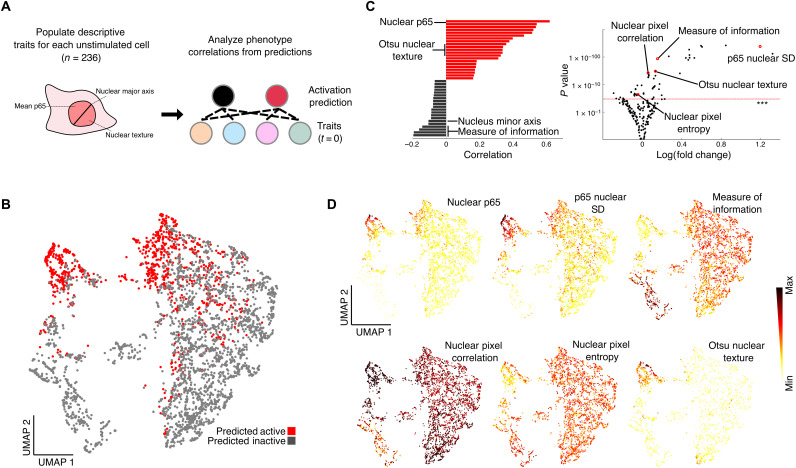
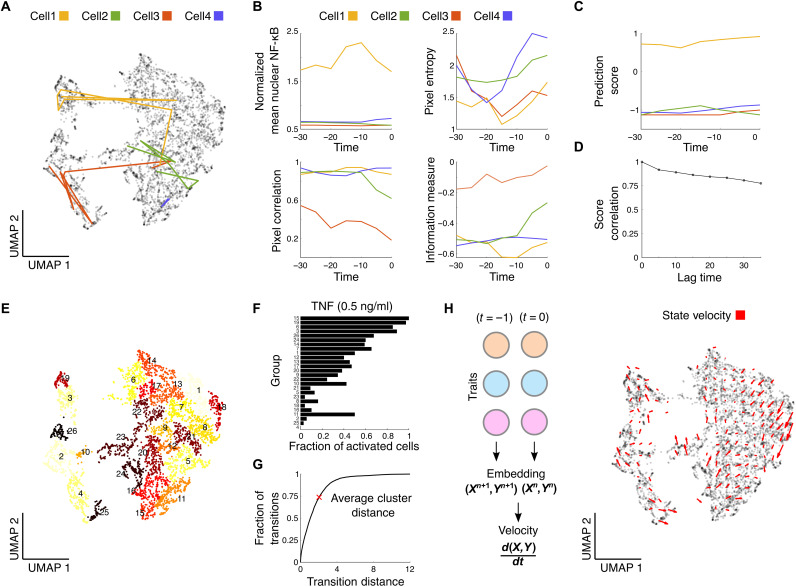
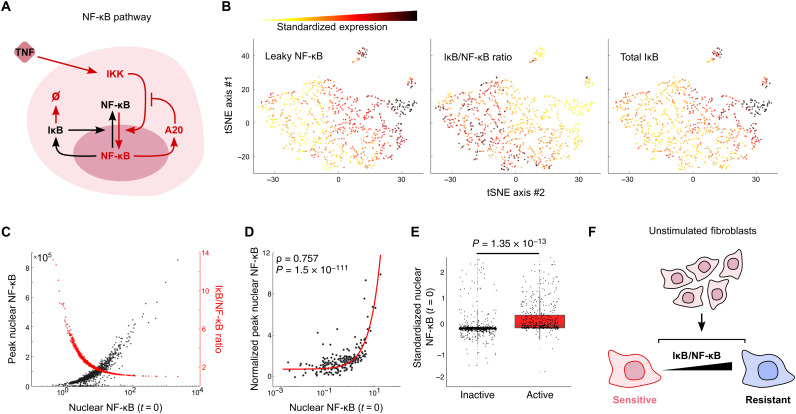
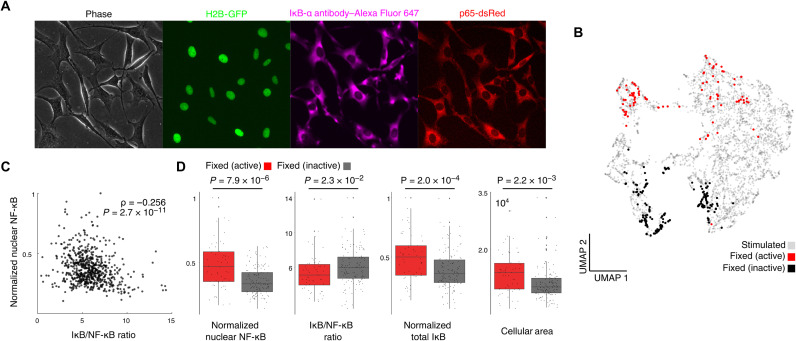
Individual cells are heterogeneous when responding to environmental cues. Under an external signal, certain cells activate gene regulatory pathways, while others completely ignore that signal. Mechanisms underlying cellular heterogeneity are often inaccessible because experiments needed to study molecular states destroy the very states that we need to examine. Here, we developed an image-based support vector machine learning model to uncover variables controlling activation of the immune pathway nuclear factor κB (NF-κB). Computer vision analysis predicts the identity of cells that will respond to cytokine stimulation and shows that activation is predetermined by minute amounts of “leaky” NF-κB (p65:p50) localization to the nucleus. Mechanistic modeling revealed that the ratio of NF-κB to inhibitor of NF-κB predetermines leakiness and activation probability of cells. While cells transition between molecular states, they maintain their overall probabilities for NF-κB activation. Our results demonstrate how computer vision can find mechanisms behind heterogeneous single-cell activation under proinflammatory stimuli.


Figures

Fig. 1.
Fig. 1.. Prestimulation cell images can be used to generate a predictive model for NF-κB activation.
(A) Under TNF stimulation, a fraction of individual cells persists in an unactivated state and do not show nuclear NF-κB localization, while others activate and NF-κB transcription factor p65 accumulates in the nucleus. Example images show activated cells, indicated with red check marks. (B) Analysis of single cells under constant dose of TNF shows variable single-cell activation in the population: A given cell may or may not respond to the TNF stimulus. It is unclear whether single-cell variability is due to purely stochastic processes (i.e., if a given cell can randomly achieve activated state) or whether it is deterministic where only sensitive cells activate under the TNF input. (C) We use microfluidic cell culture to stimulate cells with TNF signals and image the nuclear localization of NF-κB over time in single cells. Analysis of individual cells reveals NF-κB localization traces [TNF stimulation (0.1 ng/ml) shown on the right; stimulation starts at t = 0]. (D) Single-cell traces reveal heterogeneous activation and subpopulations of active and inactive cells. (E) We record prestimulation images of mouse 3T3 fibroblast cells that express p65-dsRed and histone 2B (H2B)–green fluorescent protein (GFP) reporters and feed them into our machine learning pipeline.
Fig. 2.
Fig. 2.. Machine learning predicts NF-κB activation in single cells from prestimulation images.
(A) We generate descriptive traits for each single-cell image and analyze correlations between prestimulation traits and NF-κB activation probability. (B) Using a subset of highly predictive features (n = 8), uniform manifold approximation and projection (UMAP) corroborates the clustering of a highly predictive fraction of cells that are TNF sensitive and TNF resistant. The cells indicated with red dots have high probability of activating NF-κB under TNF stimulation. (C) We determined the top feature of activation probability to be the mean nuclear fluorescence of the NF-κB (p65-dsRed) signal in the nucleus before any exposure to TNF. The plot shows the correlation of traits to single-cell activation probability, with log(fold change) of traits from predicted active cells to predicted inactive cells on the x axis and significance of difference on the y axis determined by t test. Other highly predictive features include the SD of nuclear p65, mean nuclear phase intensity, major axis length and a texture feature describing information measure of correlation in the nucleus, and aggregative image features such as Otsu dimension, and Segmentation-based Fractal Texture Analysis (SFTA) (***P = 0.001). (D) UMAP plots of several highly predictive features determining NF-κB activation in single cells.
Fig. 3.
Fig. 3.. Resting cells dynamically transition between different states but maintain their overall NF-κB activation probability.
Imaging of single cells before, during, and after stimulation enables analysis of single-cell state stability. (A) We use selected cellular features across multiple time points to analyze the trajectory of single cells across the latent UMAP space before stimulation. Colored lines show the temporal trajectories of four example cells on the UMAP plot before stimulation with TNF. Cells transition between various points before TNF stimulation. (B) Individual cells show coordinated changes in state features while transitioning. We show the dynamic changes in the level of various predictive features for these cells. Time is given in minutes before stimulation (stimulation starts at t = 0). (C) While cells transition between different points with different transition distances, their probability to activate NF-κB (given by the prediction score of our algorithm) remains the same. (D) Autocorrelation of the prediction score among single cells across prestimulation time points remains stable 35 min before stimulation (r = 0.78, n = 1109 cells, pairwise Pearson’s correlation). (E) Single cells are clustered in the UMAP space by local adjacency into communities to look for activation differences by state (color indicates group). (F) Analyzing end point data after TNF stimulation by individual state clusters shows different fractions of activated cells for different states. There is activation similarity in adjacent clusters, and (G) 73.73% of all cell transitions are within or to an adjacent cluster. Shown is the cumulative distribution function of state transitions by transition distance (red X indicates average distance between clusters). (H) Aggregated trajectories reveal a state velocity depicting activation score movement across the population.
Fig. 4.
Fig. 4.. Simulations suggest that leaky NF-κB localization and overall NF-κB response is predetermined by the ratio of IκB to NF-κB proteins in single cells.
(A) Simplified schematic of the NF-κB pathway used in simulations. IκB provides negative feedback to the pathway, preventing NF-κB nuclear localization in unstimulated cells. IKK, IκB kinase. (B) t-distributed stochastic neighbor embedding (tSNE) mapping of simulated single cells on NF-κB pathway protein levels shows anticorrelated nuclear NF-κB and IκB/NF-κB ratio in single cells. (C) Simulations predict a correlation between nuclear NF-κB at t = 0 and NF-κB peak height after stimulation and, consequently, an inverse correlation between NF-κB at t = 0 and the IκB/NF-κB ratio. (D) Activated live single cells confirm the prediction and show significant correlation between nuclear NF-κB at t = 0 and NF-κB peak height after stimulation. (E) Prestimulation NF-κB nuclear fluorescence accounts for a high degree of variance, and activated live single cells have a significantly higher level than inactive cells. (F) Simulations suggest that increasing IκB/NF-κB ratio makes cells more resistant to activation under TNF stimulation.
Fig. 5.
Fig. 5.. Single-cell activation is largely predetermined by the NF-κB/IκB ratio.
We validated our machine learning and modeling predictions in immunofluorescence staining experiments. (A) Image of unperturbed 3T3 cells stained with IκB-α with fluorescent p65 and H2B reporters. (B) High-scoring fixed cells are mapped onto UMAP. (C) There is a significant inverse correlation between leaky nuclear NF-κB localization and IκB/NF-κB ratio. (D) IκB/NF-κB ratio is significantly correlated with nuclear NF-κB state at t = 0 in predicted fixed cells, and there is a significant difference between IκB/NF-κB ratio, leaky nuclear NF-κB localization, total IκB, and cellular area.

Similar articles

Cited by

References

    1. Elowitz M. B., Levine A. J., Siggia E. D., Swain P. S., Stochastic gene expression in a single cell. Science 297, 1183–1186 (2002). - PubMed
    1. Ben-David U., Siranosian B., Ha G., Tang H., Oren Y., Hinohara K., Strathdee C. A., Dempster J., Lyons N. J., Burns R., Nag A., Kugener G., Cimini B., Tsvetkov P., Maruvka Y. E., O’Rourke R., Garrity A., Tubelli A. A., Bandopadhayay P., Tsherniak A., Vazquez F., Wong B., Birger C., Ghandi M., Thorner A. R., Bittker J. A., Meyerson M., Getz G., Beroukhim R., Golub T. R., Genetic and transcriptional evolution alters cancer cell line drug response. Nature 560, 325–330 (2018). - PMC - PubMed
    1. Kellogg R. A., Tian C., Etzrodt M., Tay S., Cellular decision making by non-integrative processing of TLR inputs. Cell Rep. 19, 125–135 (2017). - PMC - PubMed
    1. Chakraborty A. K., Das J., Zikherman J., Yang M., Govern C. C., Ho M., Weiss A., Roose J., Molecular origin and functional consequences of digital signaling and hysteresis during Ras activation in lymphocytes. Sci. Signal. 2, pt2 (2009). - PMC - PubMed
    1. Das J., Ho M., Zikherman J., Govern C., Yang M., Weiss A., Chakraborty A. K., Roose J. P., Digital signaling and hysteresis characterize ras activation in lymphoid cells. Cell 136, 337–351 (2009). - PMC - PubMed