. 2021 Oct 22;7(43):eabg3691.
doi: 10.1126/sciadv.abg3691. Epub 2021 Oct 22.

Safe traveling in public transport amid COVID-19

Affiliations

Safe traveling in public transport amid COVID-19

Donggyun Ku et al. Sci Adv. .

Abstract

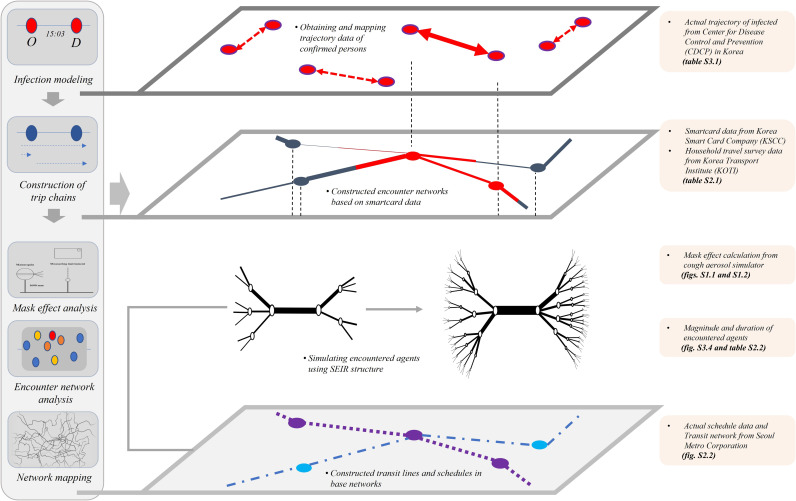
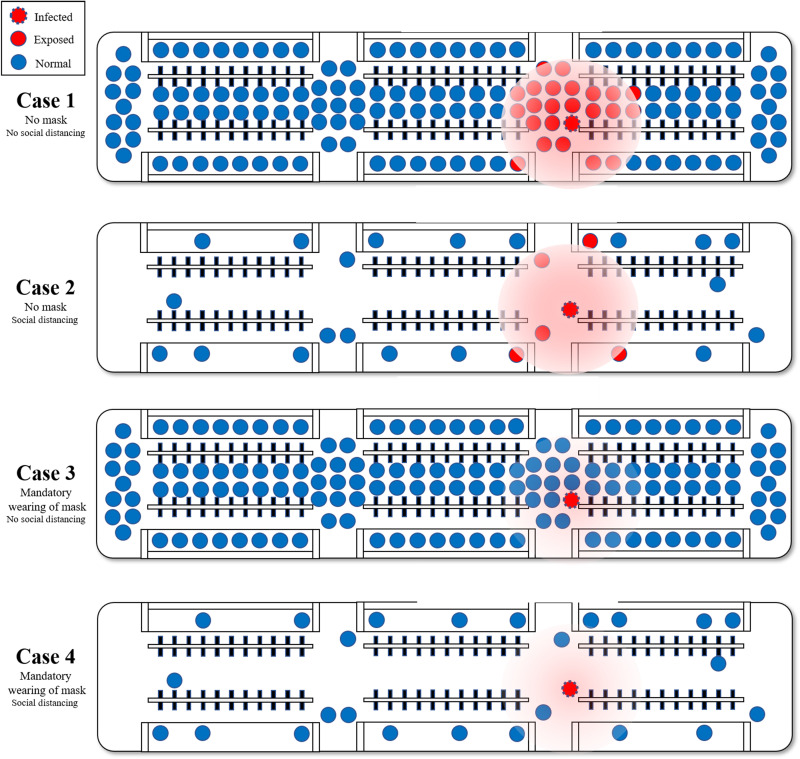
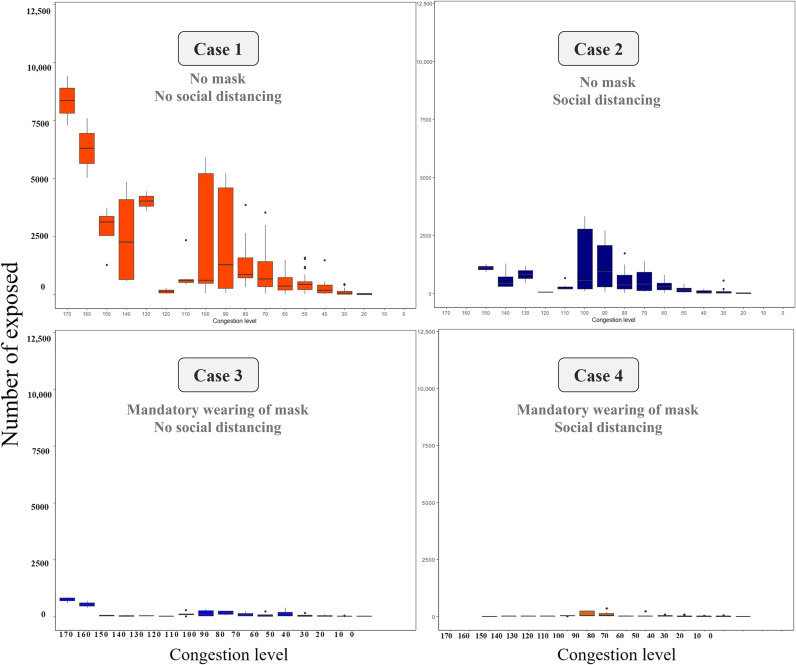
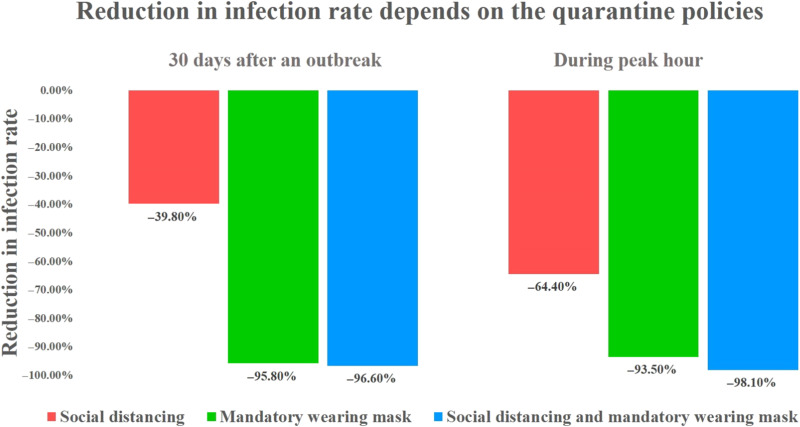
Several intensive policies, such as mandatorily wearing masks and practicing social distancing, have been implemented in South Korea to prevent the spread of the novel coronavirus disease (COVID-19). We analyzed and measured the impact of the aforementioned policies by calculating the degree of infection exposure in public transport. Specifically, we simulated how passengers encounter and infect each other during their journeys in public transport by tracking movements of passengers. The probabilities of exposure to infections in public transport via the aforementioned preventive measures were compared by using the Susceptible, Exposed, Infected, and Recovered model, a respiratory infectious disease diffusion model. We determined that the mandatory wearing of masks exhibits effects similar to maintaining 2-m social distancing in preventing COVID-19. Mandatory wearing of masks and practicing social distancing with masks during peak hours reduced infection rates by 93.5 and 98.1%, respectively.


Figures

Fig. 1.
Fig. 1.. Conceptual diagram of the encounter network based on actual data.
This figure shows the conceptual diagram of the encounter network based on real infected people. First, agent-based modeling was used to assign a chain of trips by individual agents according to their smart card data. The resulting model allowed us to track the movements of these individual agents. We then used the tracking data to compute the degree and duration of contact experienced by each agent. Through these steps, the level of congestion in public transportation was calculated, as shown in the diagram below.
Fig. 2.
Fig. 2.. Determination of the average distance between individual agents by the level of congestion on public transport.
This figure shows the average distance between individual agents in a metro compartment. Individual agents travel separately according to their travel time, origin, and destination. If these passengers board the same metro compartment, contact occurs. At this point, we calculated the congestion level according to the number of passengers in the metro compartment. Moreover, we calculated the average distance between individual agents according to the congestion level in the compartment by considering the area occupied by each agent. The result was then used to calculate the actual transmission probability for individual agents within a compartment. Congestion levels were defined as level of service (LOS). LOS E–F represents an average distance of no less than 0.61 m per agent, whereas LOS A–C represents an average distance greater than 0.94 m per agent. We tracked the number of people onboard public transport and calculated the average distance between individual agents and applied the result to the infection diffusion model.
Fig. 3.
Fig. 3.. Prediction of the actual transmission probability according to quarantine policies such as mandatory mask wearing and social distancing.
This figure shows the variation in the number of exposed agents based on the implementation of social distancing and mandatory mask wearing with respect to different case scenarios. Mask wearing reduces the distance the virus can spread, and social distancing increases the average distance between individual agents in a metro carriage, as in Fig. 1. These two policies contribute to reduced exposure. In case 1, agents are most likely to exist around the infected agent and are more likely to be exposed because of the high probability of the exposed agent because social distancing is not maintained and no mask is worn. In case 2, social distancing is maintained, and thus the probability of exposed agent is low. However, the probability of exposed agents around the infected agent is high, thereby resulting in some degree of exposed agent. In case 3, social distancing is not performed. However, the infected agent is not exposed to many agents because of the mask and thereby resulting in a sharp drop in the number of exposed agents. As shown in case 4, implementing both policies results in a sharp decrease in the exposed agent.
Fig. 4.
Fig. 4.. Trend of exposed agents based on the degree of congestion in each case.
The graphs show the number of exposed agents based on different congestion levels for each case. First, the probability per person is not absolute and every individual agent’s probability of exposure varies depending on the actual probability of contact with the infected person, the congestion level in the public vehicle, and contact. The analysis calculated the probability of exposure for each individual agent over 1 day. The figure shows the average value generated by individual agents for each congestion level. The individual agent values cannot be presented because approximately 10 million journeys are made on the Seoul public transportation system per day. The average value is therefore calculated as the probability of exposure given the number of people exposed at different congestion levels. The standard deviations are also presented in the graph. In the case with social distancing (case 2), the upper limit of congestion is limited. Hence, the number of exposed agents decreases. When masks are worn (cases 3 and 4), the agent is less likely to be exposed (see Supplementary Materials, section 4.2).
Fig. 5.
Fig. 5.. Reduction in infection rate by comparing a normal case with cases involving mandatory wearing of mask and social distancing with mask.
The graph compares the reduction in infection rates based on the total number of agents exposed in the 30 days after an outbreak depends on the quarantine policies in force and during peak hours. In the cases involving mandatory mask wearing and social distancing with mask wearing, the infection rates are reduced by 95.8% (93.5% during peak hour) and 96.6% (98.1% during peak hour), respectively (see Supplementary Materials, section 4.2).

References

    1. Kraemer M. U. G., Yang C.-H., Gutierrez B., Wu C.-H., Klein B., Pigott D. M.; Open COVID-19 Data Working Group, du Plessis L., Faria N. R., Li R., Hanage W. P., Brownstein J. S., Layan M., Vespignani A., Tian H., Dye C., Pybus O. G., Scarpino S. V., The effect of human mobility and control measures on the COVID-19 epidemic in China. Science 368, 493–497 (2020). - PMC - PubMed
    1. Pucher J., Park H., Kim M. H., Song J., Public transport reforms in Seoul: Innovations motivated by funding crisis. J. Public Transp. 8, 41–62 (2005).
    1. The Korea Herald Newsletter, Social distancing waning? Public transport usage up slightly in Seoul (2020); www.koreaherald.com/view.php?ud=.
    1. Chinazzi M., Davis J. T., Ajelli M., Gioannini C., Litvinova M., Merler S., Pastore y Piontti A., Mu K., Rossi L., Sun K., Viboud C., Xiong X., Yu H., Halloran M. E., Longini I. M. Jr., Vespignani A., The effect of travel restrictions on the spread of the 2019 novel coronavirus (COVID-19) outbreak. Science 368, 395–400 (2020). - PMC - PubMed
    1. Kim K. M., Ki M., Cho S.-I., Sung M., Hong J. K., Cheong H.-K., Kim J.-H., Lee S.-E., Lee C., Lee K.-J., Park Y.-S., Kim S. W., Choi B. Y., Epidemiologic features of the first MERS outbreak in Korea: Focus on Pyeongtaek St. Mary’s Hospital. Epidemiol. Health 37, e2015041 (2015). - PMC - PubMed