. 2022 Jul-Aug;104(4):467-483.
doi: 10.1080/00223891.2021.1984246. Epub 2021 Oct 22.

Detecting Idiographic Personality Change

Affiliations

Detecting Idiographic Personality Change

Emorie D Beck et al. J Pers Assess. 2022 Jul-Aug.

Abstract

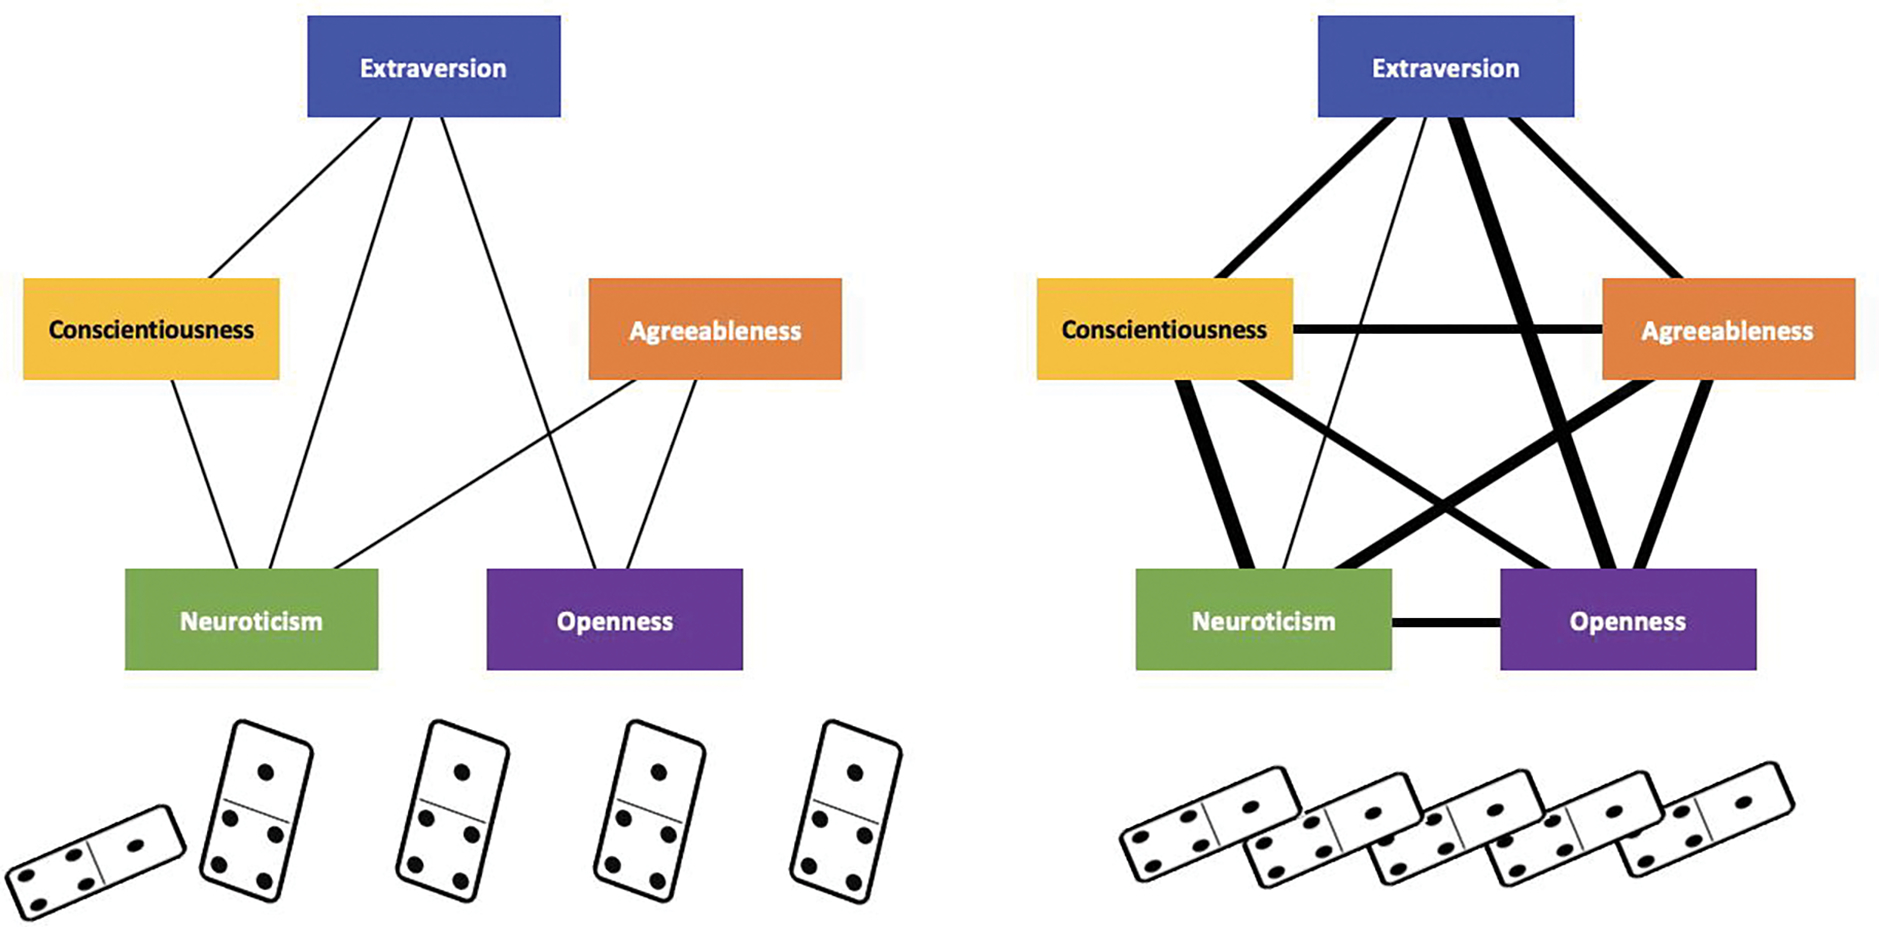
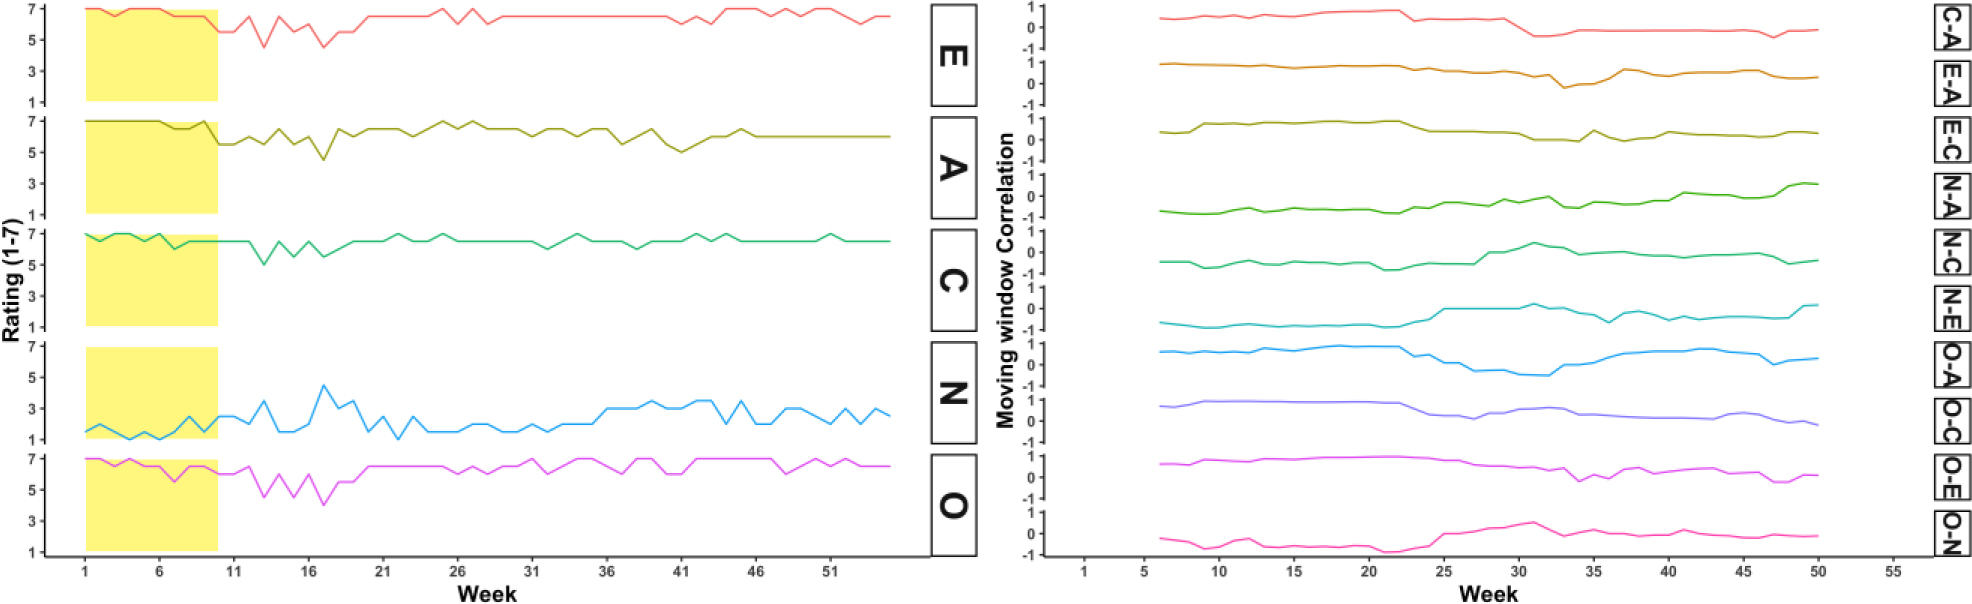
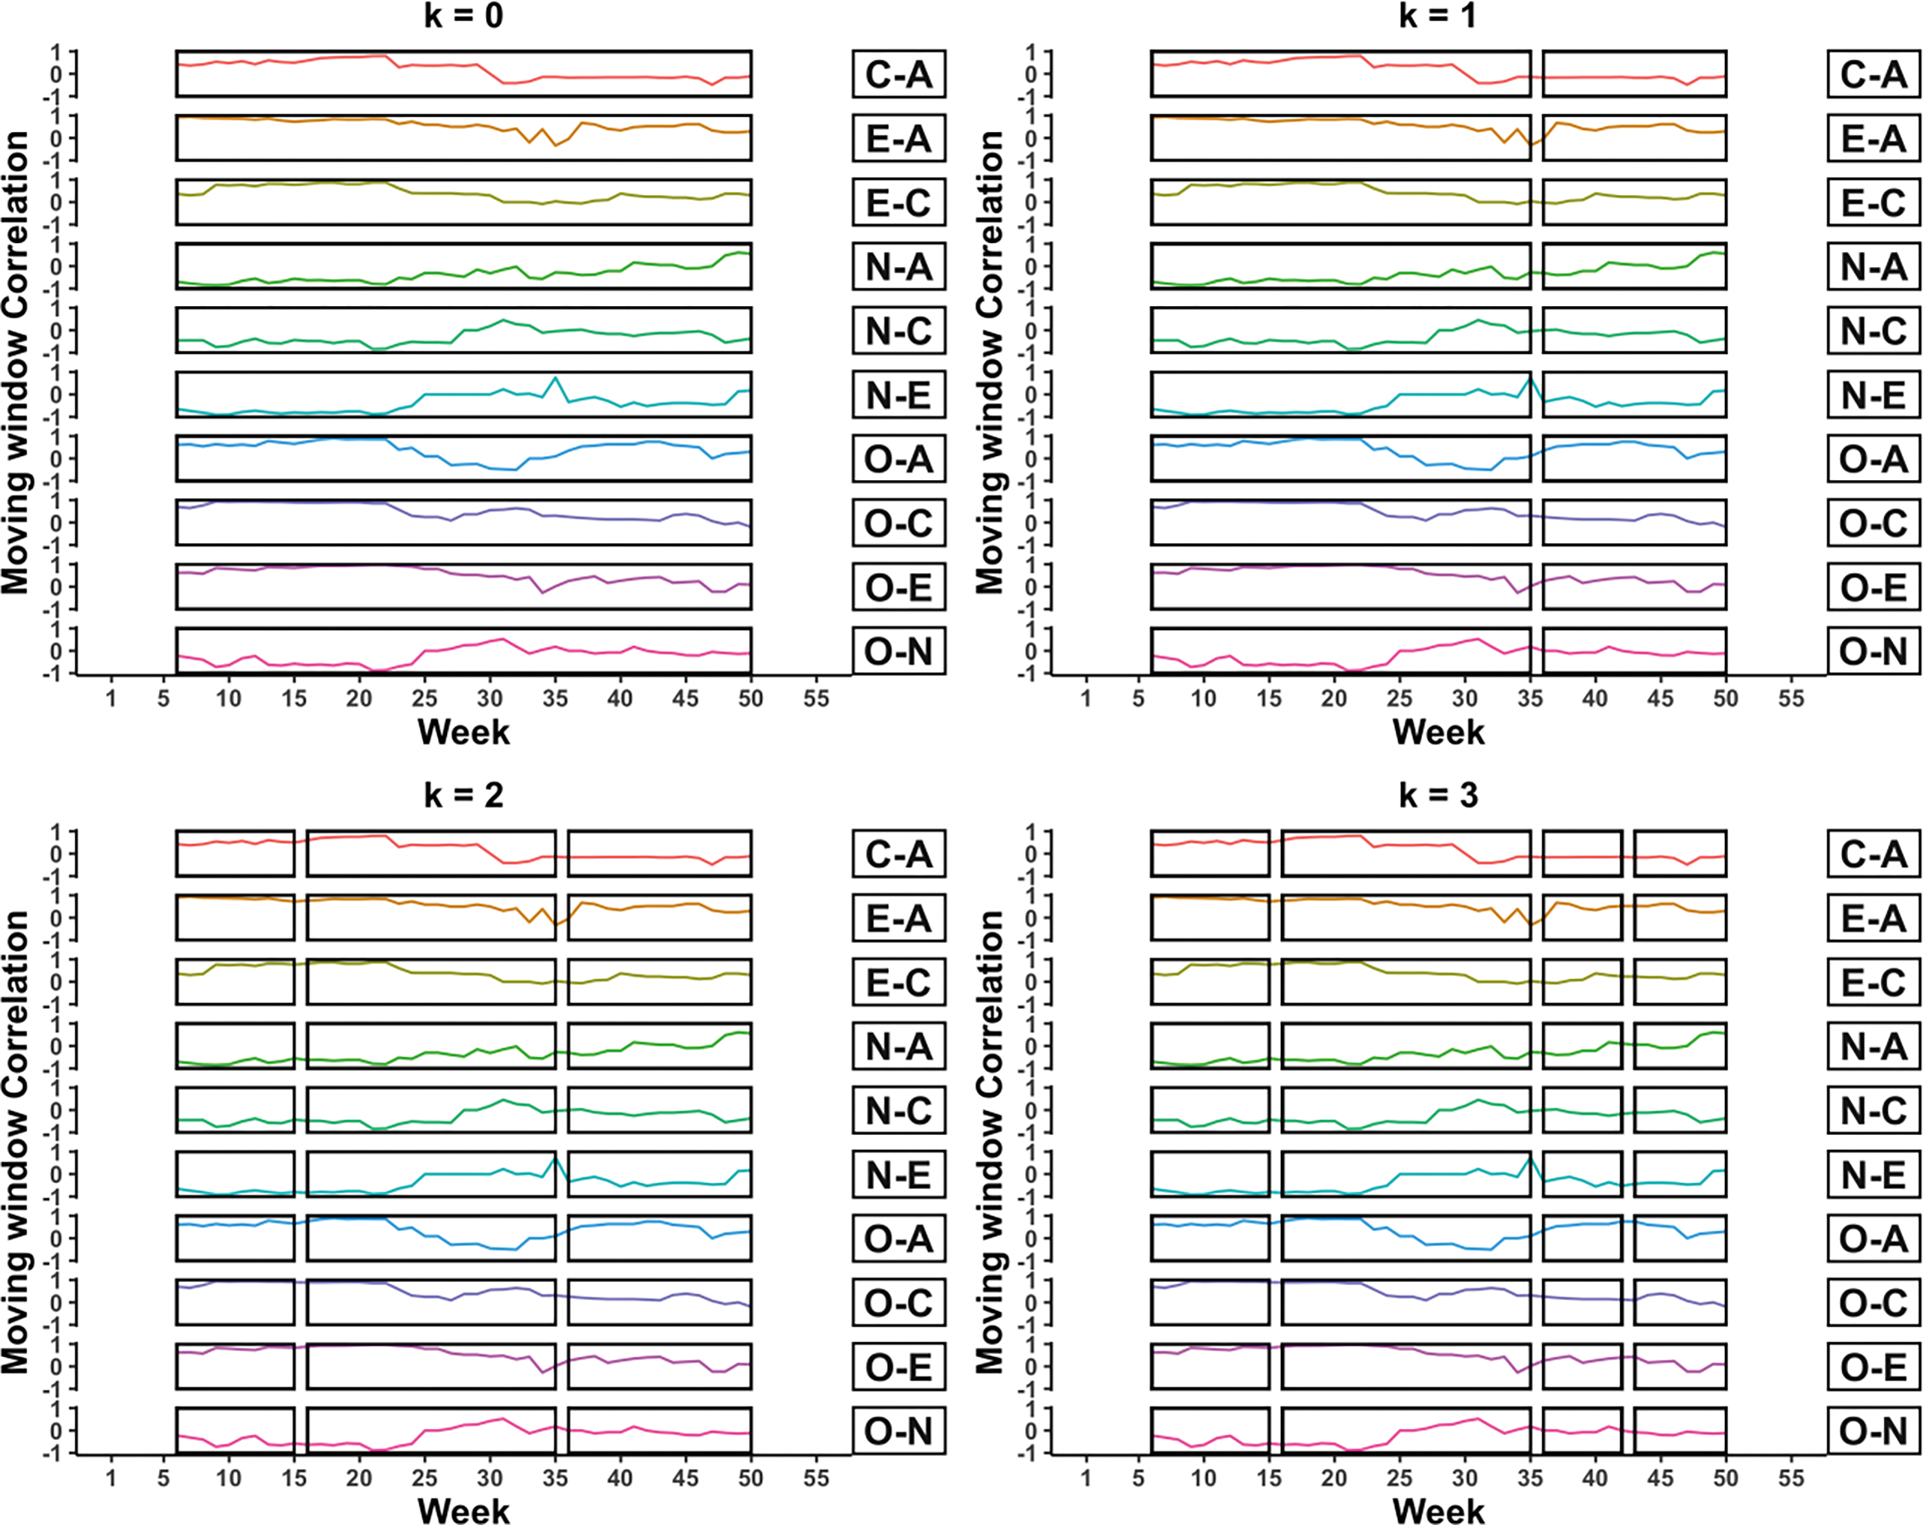
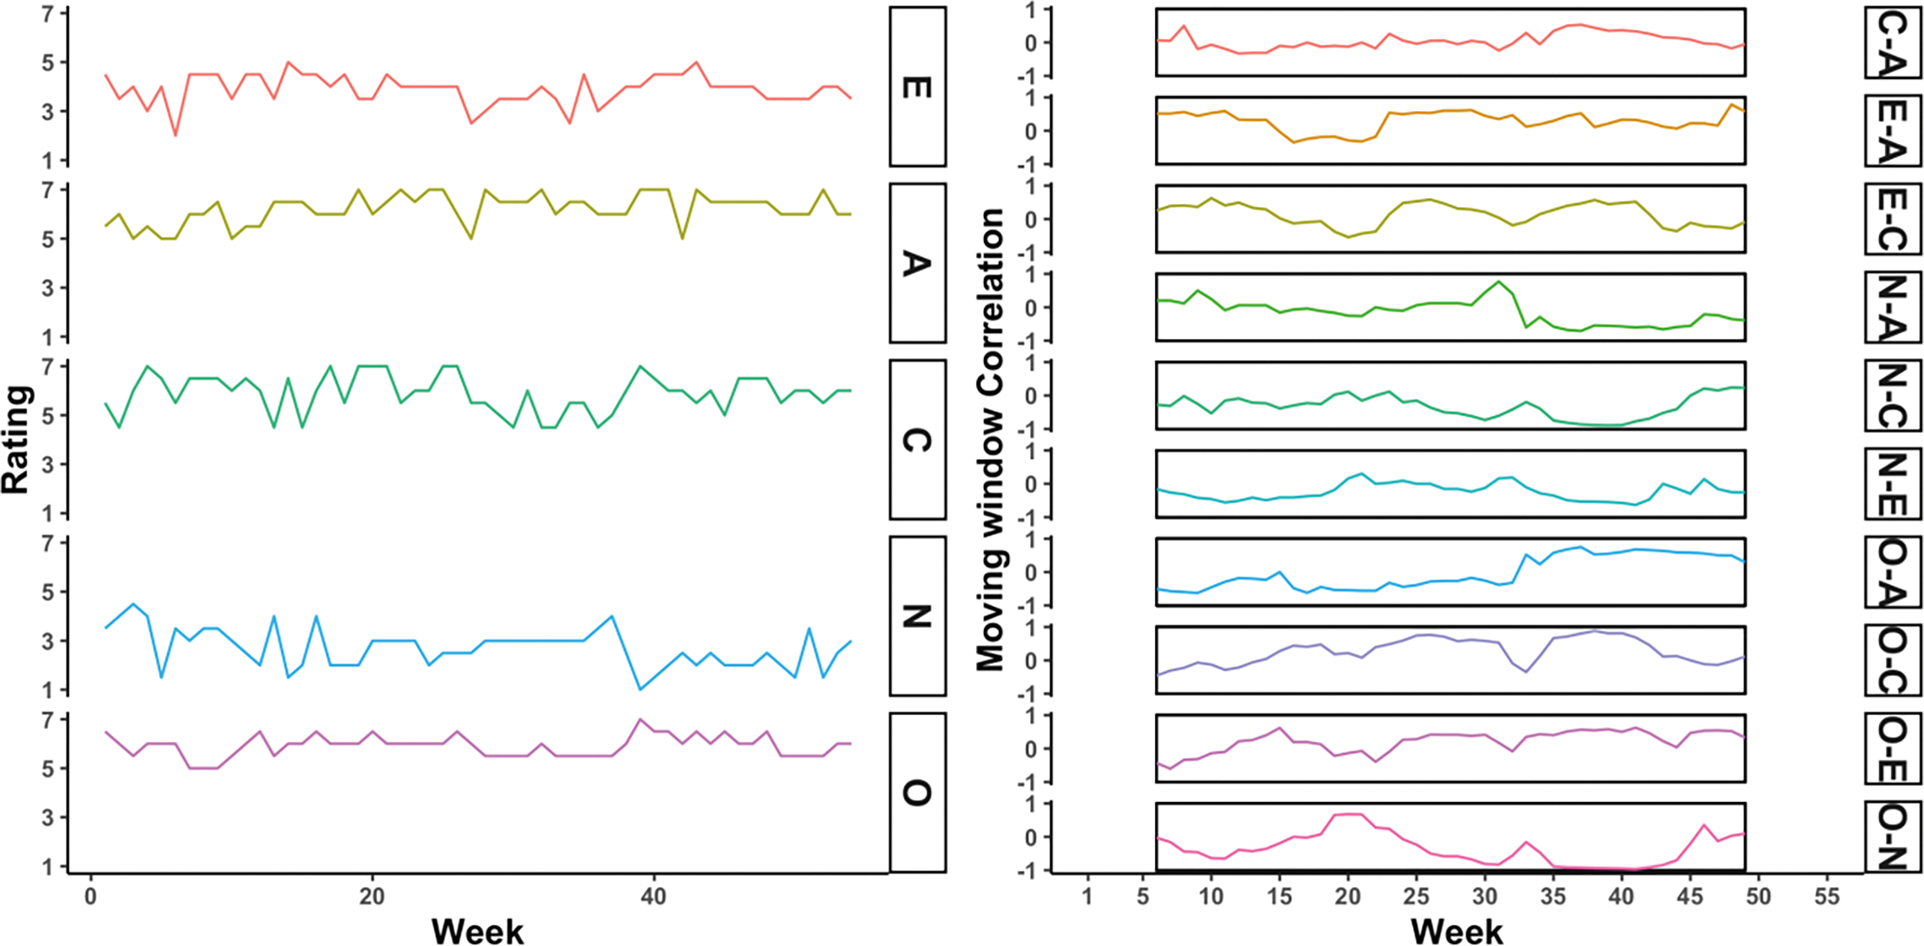
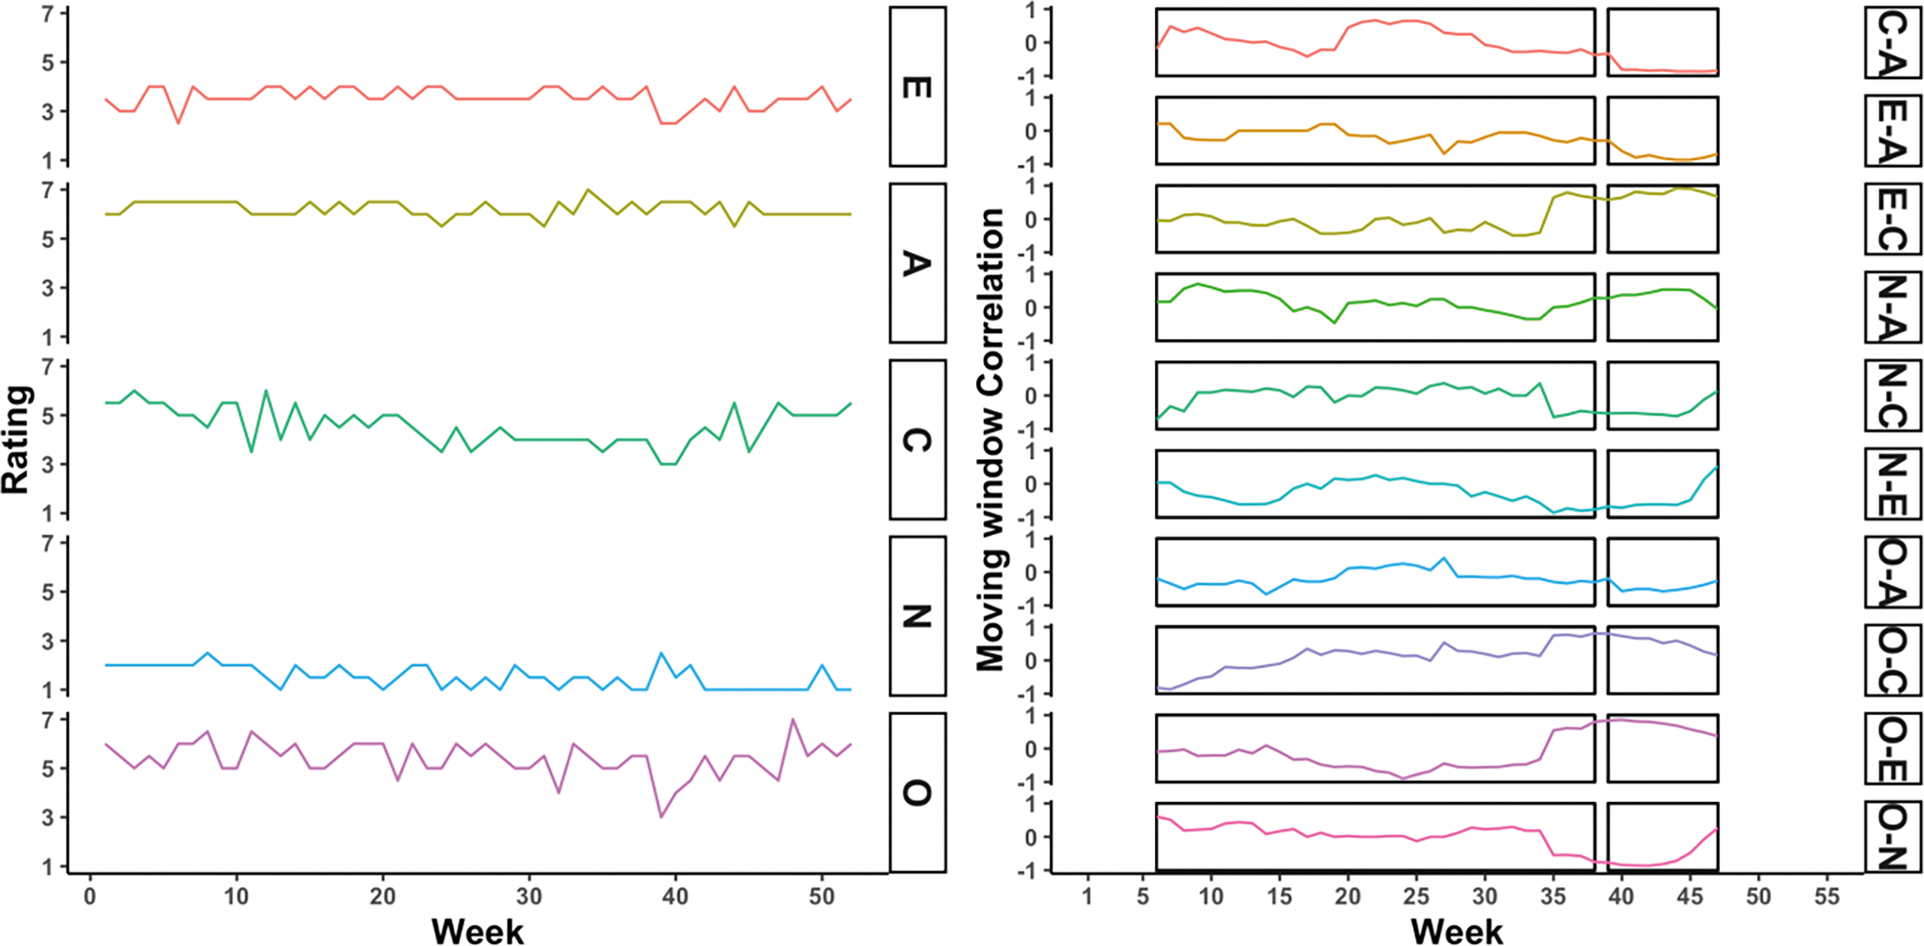
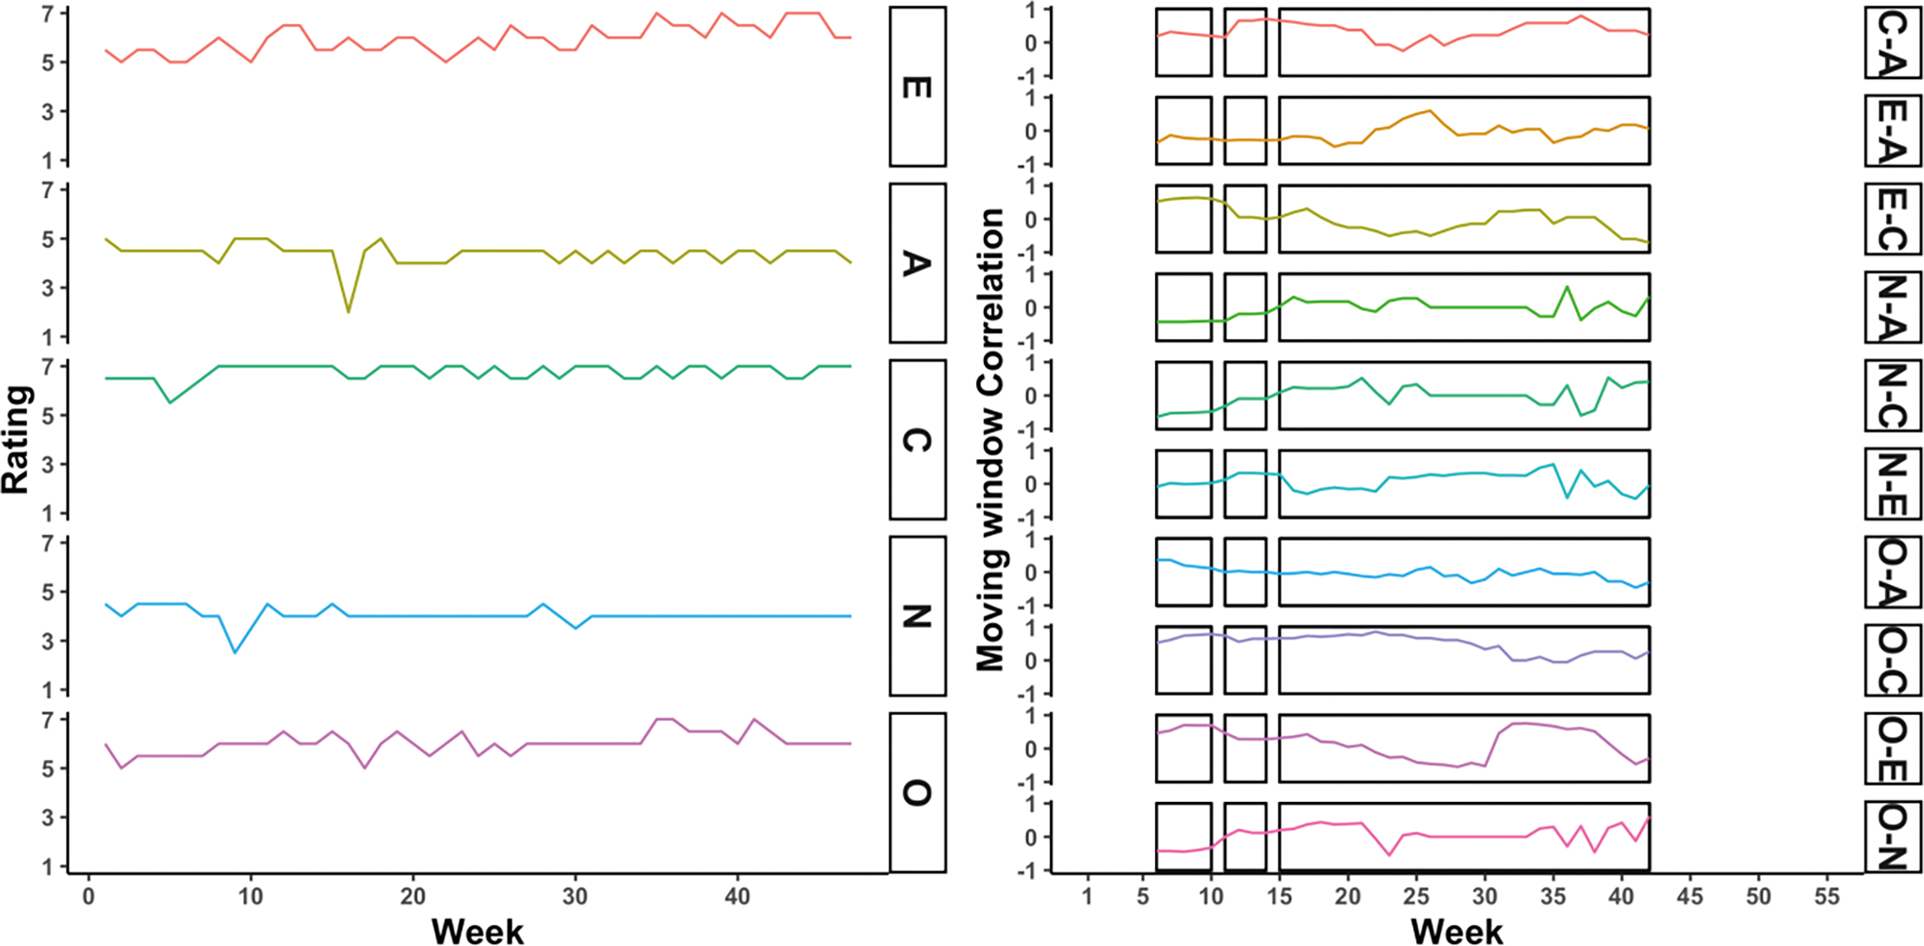
Personality changes across the lifespan, but strong evidence regarding the mechanisms responsible for personality change remains elusive. Studies of personality change and life events, for example, suggest that personality is difficult to change. But there are two key issues with assessing personality change. First, most change models optimize population-level, not individual-level, effects, which ignores heterogeneity in patterns of change. Second, optimizing change as mean-levels of self-reports fails to incorporate methods for assessing personality dynamics, such as using changes in variances of and correlations in multivariate time series data that often proceed changes in mean-levels, making variance change detection a promising technique for the study of change. Using a sample of N = 388 participants (total N = 21,790) assessed weekly over 60 weeks, we test a permutation-based approach for detecting individual-level personality changes in multivariate time series and compare the results to event-based methods for assessing change. We find that a non-trivial number of participants show change over the course of the year but that there was little association between these change points and life events they experienced. We conclude by highlighting the importance in idiographic and dynamic investigations of change.


Figures

Figure 1.
Figure 1.
Two hypothetical correlational structures of the Big Five for two individuals. (1A): A loosely connected (low density) system in which perturbations in one component will have little impact on others (i.e. if one domino falls, the others will not follow). (1B): A strongly connected (high density) system in which perturbations in one component will have strong impact on others (i.e. if one domino falls, the others will follow).
Figure 2.
Figure 2.
Raw time series (2A) and moving window correlation time series (2B) for one example participant. The x-axis represents week in the study, the y-axis is the rating on a 1 to 7 scale in the left panel and a correlation (−1 to 1) in the right panel. Rows in the left panel capture trait composites, while rows in the right panel capture combinations of traits. The box in 1A captures the window that slides across the time series, capturing the correlations among observations therein. E = Extraversion, A = Agreeableness, C = Conscientiousness, N = Neuroticism, and O = Openness.
Figure 3.
Figure 3.
Sample moving window correlation time series with 0 to 3 knots (i.e. 1 to 4 phases). Week is on the x-axis, moving window correlations (−1 to 1) are on the y-axis, and different rows indicate all unique combinations of traits. Boxes indicate each unique phase, meaning that knots occur at the breaks between boxes.
Figure 4.
Figure 4.
Raw and moving window correlation time series for participant 109, who should one phase (no change points). The x-axis represents week in the study, the y-axis is the rating on a 1 to 7 scale in the left panel and a correlation (−1 to 1) in the right panel. Rows in the left panel capture trait composites, while rows in the right panel capture combinations of traits. E = Extraversion, A = Agreeableness, C = Conscientiousness, N = Neuroticism, and O = Openness.
Figure 5.
Figure 5.
Raw and moving window correlation time series for participant 202, who should one phase (no change points). The x-axis represents week in the study, the y-axis is the rating on a 1 to 7 scale in the left panel and a correlation (−1 to 1) in the right panel. Rows in the left panel capture trait composites, while rows in the right panel capture combinations of traits. E = Extraversion, A = Agreeableness, C = Conscientiousness, N = Neuroticism, and O = Openness.
Figure 6.
Figure 6.
Raw and moving window correlation time series for participant 087, who should one phase (no change points). The x-axis represents week in the study, the y-axis is the rating on a 1 to 7 scale in the left panel and a correlation (−1 to 1) in the right panel. Rows in the left panel capture trait composites, while rows in the right panel capture combinations of traits. E = Extraversion, A = Agreeableness, C = Conscientiousness, N = Neuroticism, and O = Openness.

Similar articles

Cited by

References

    1. Allemand M, & Martin M (2017). On Correlated Change in Personality. European Psychologist, 21(4), 237–253. 10.1027/1016-9040/a000256 - DOI
    1. Allemand M, Zimprich D, & Martin M (2008). Long-term correlated change in personality traits in old age. Psychology and Aging, 23(3), 545–557. 10.1037/a0013239 - DOI - PubMed
    1. Allport GW (1937). Personality: A psychological interpretation.
    1. Allport GW (1960). The open system in personality theory. The Journal of Abnormal and Social Psychology, 61(3), 301–310. 10.1037/h0043619 - DOI - PubMed
    1. Arslan RC, Reitz AK, Driebe JC, Gerlach TM, & Penke L (2021). Routinely randomize potential sources of measurement reactivity to estimate and adjust for biases in subjective reports. Psychological Methods, 26(2), 175–185. 10.1037/met0000294 - DOI - PubMed

Publication types