Review
. 2021 Nov 17;109(22):3552-3575.
doi: 10.1016/j.neuron.2021.09.034. Epub 2021 Oct 21.

The learning of prospective and retrospective cognitive maps within neural circuits

Affiliations
Review

The learning of prospective and retrospective cognitive maps within neural circuits

Vijay Mohan K Namboodiri et al. Neuron. .

Abstract

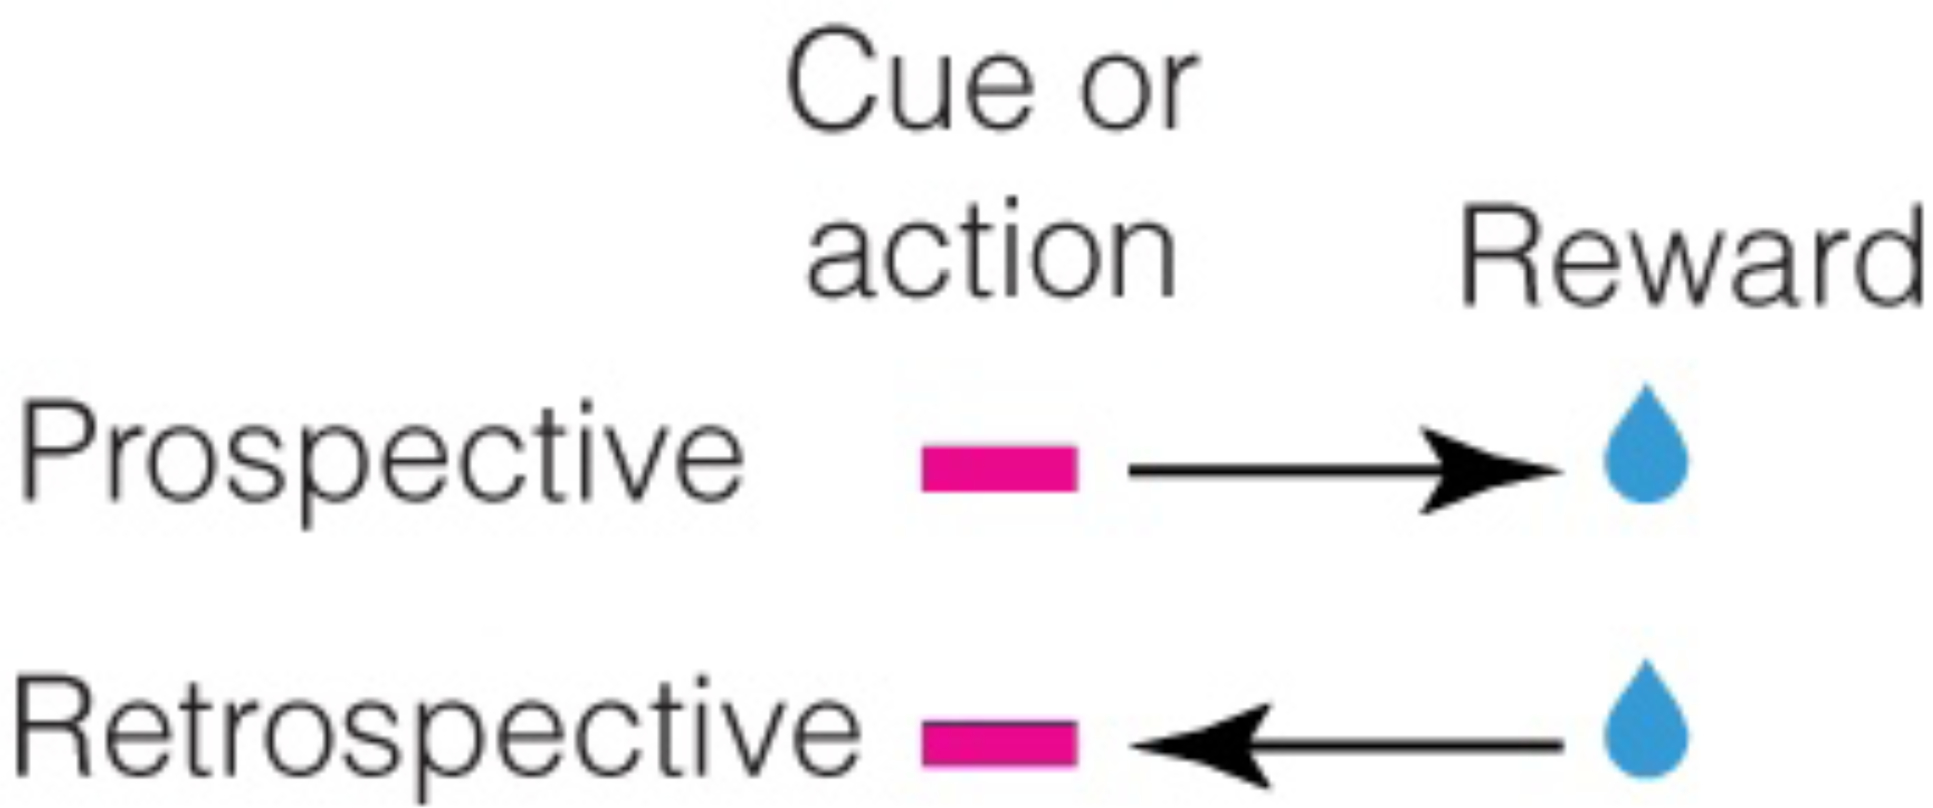
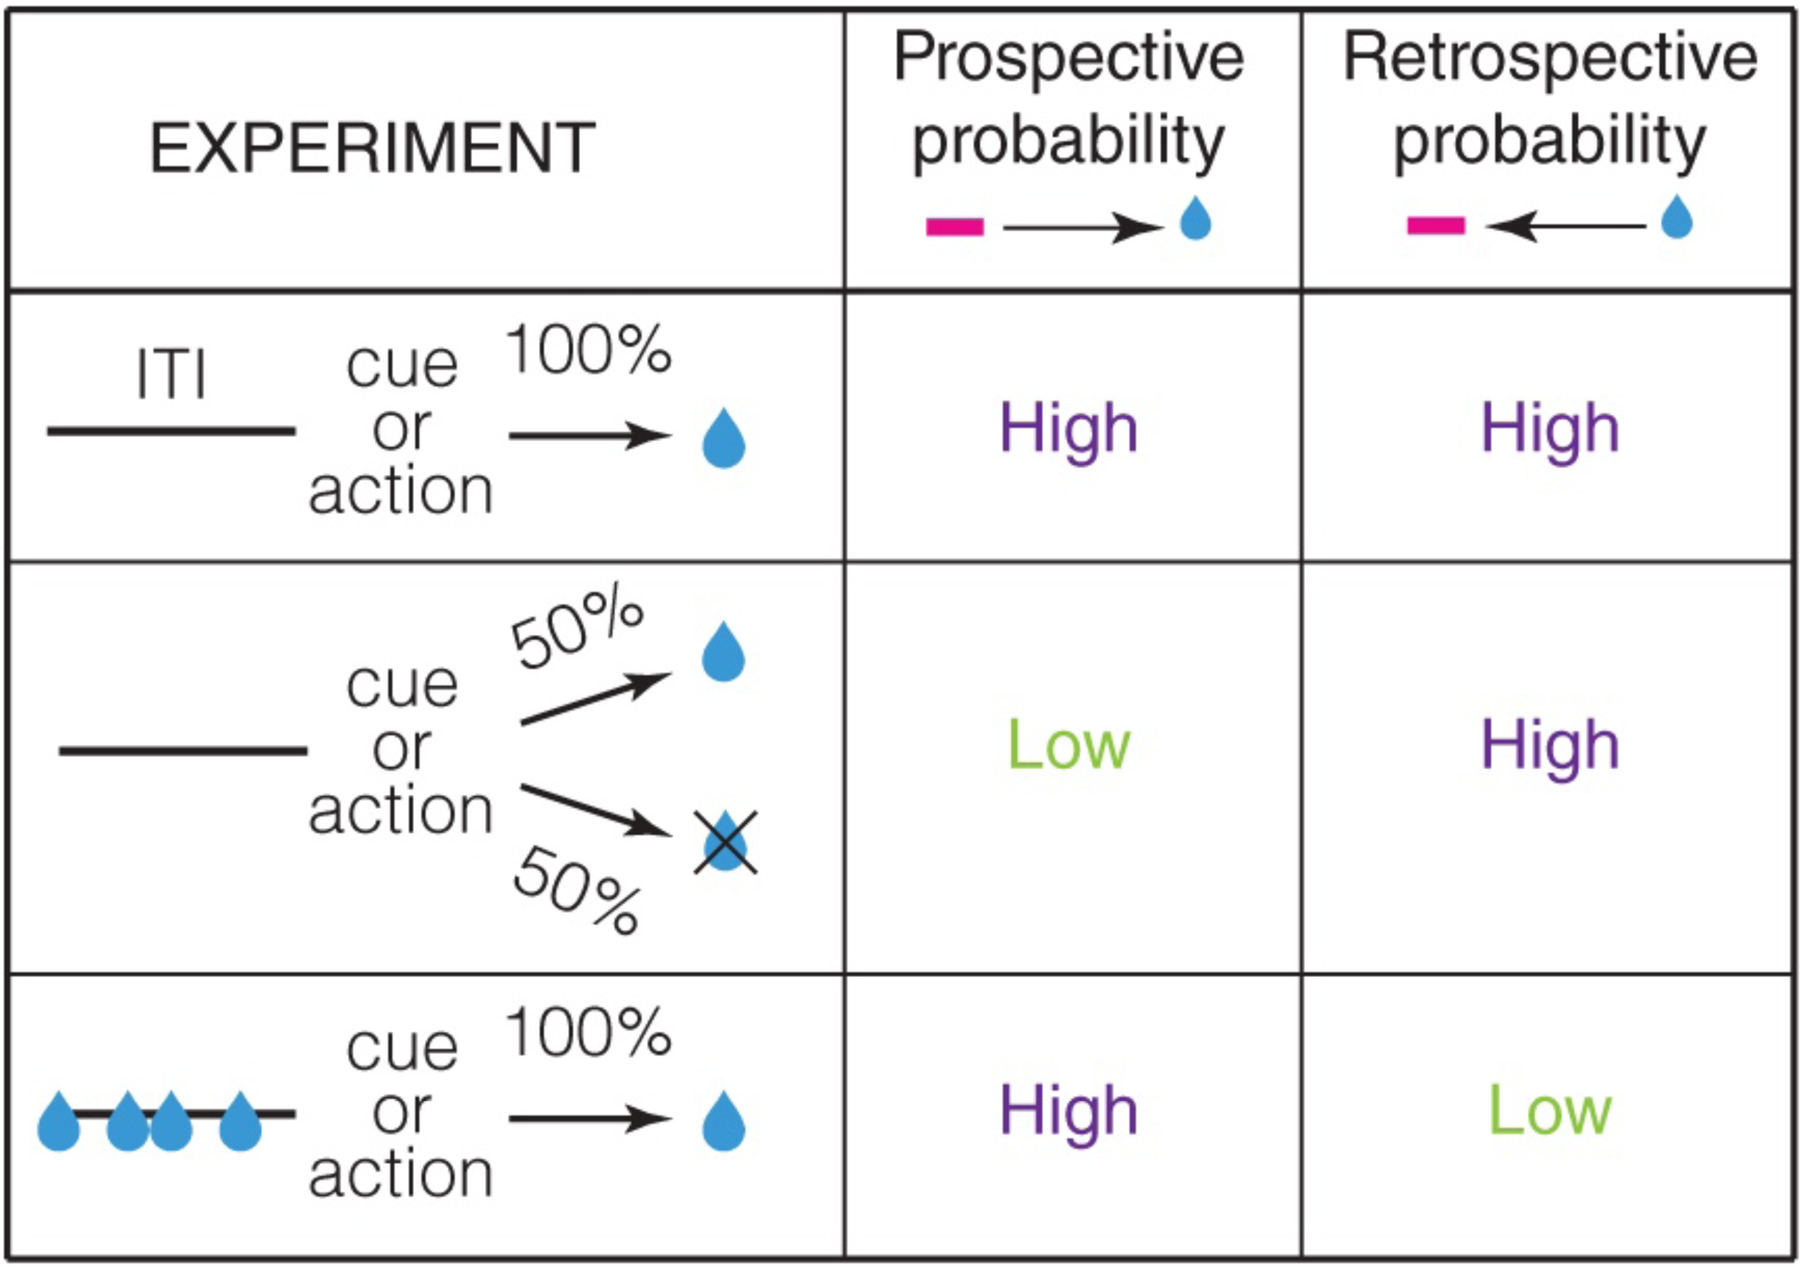
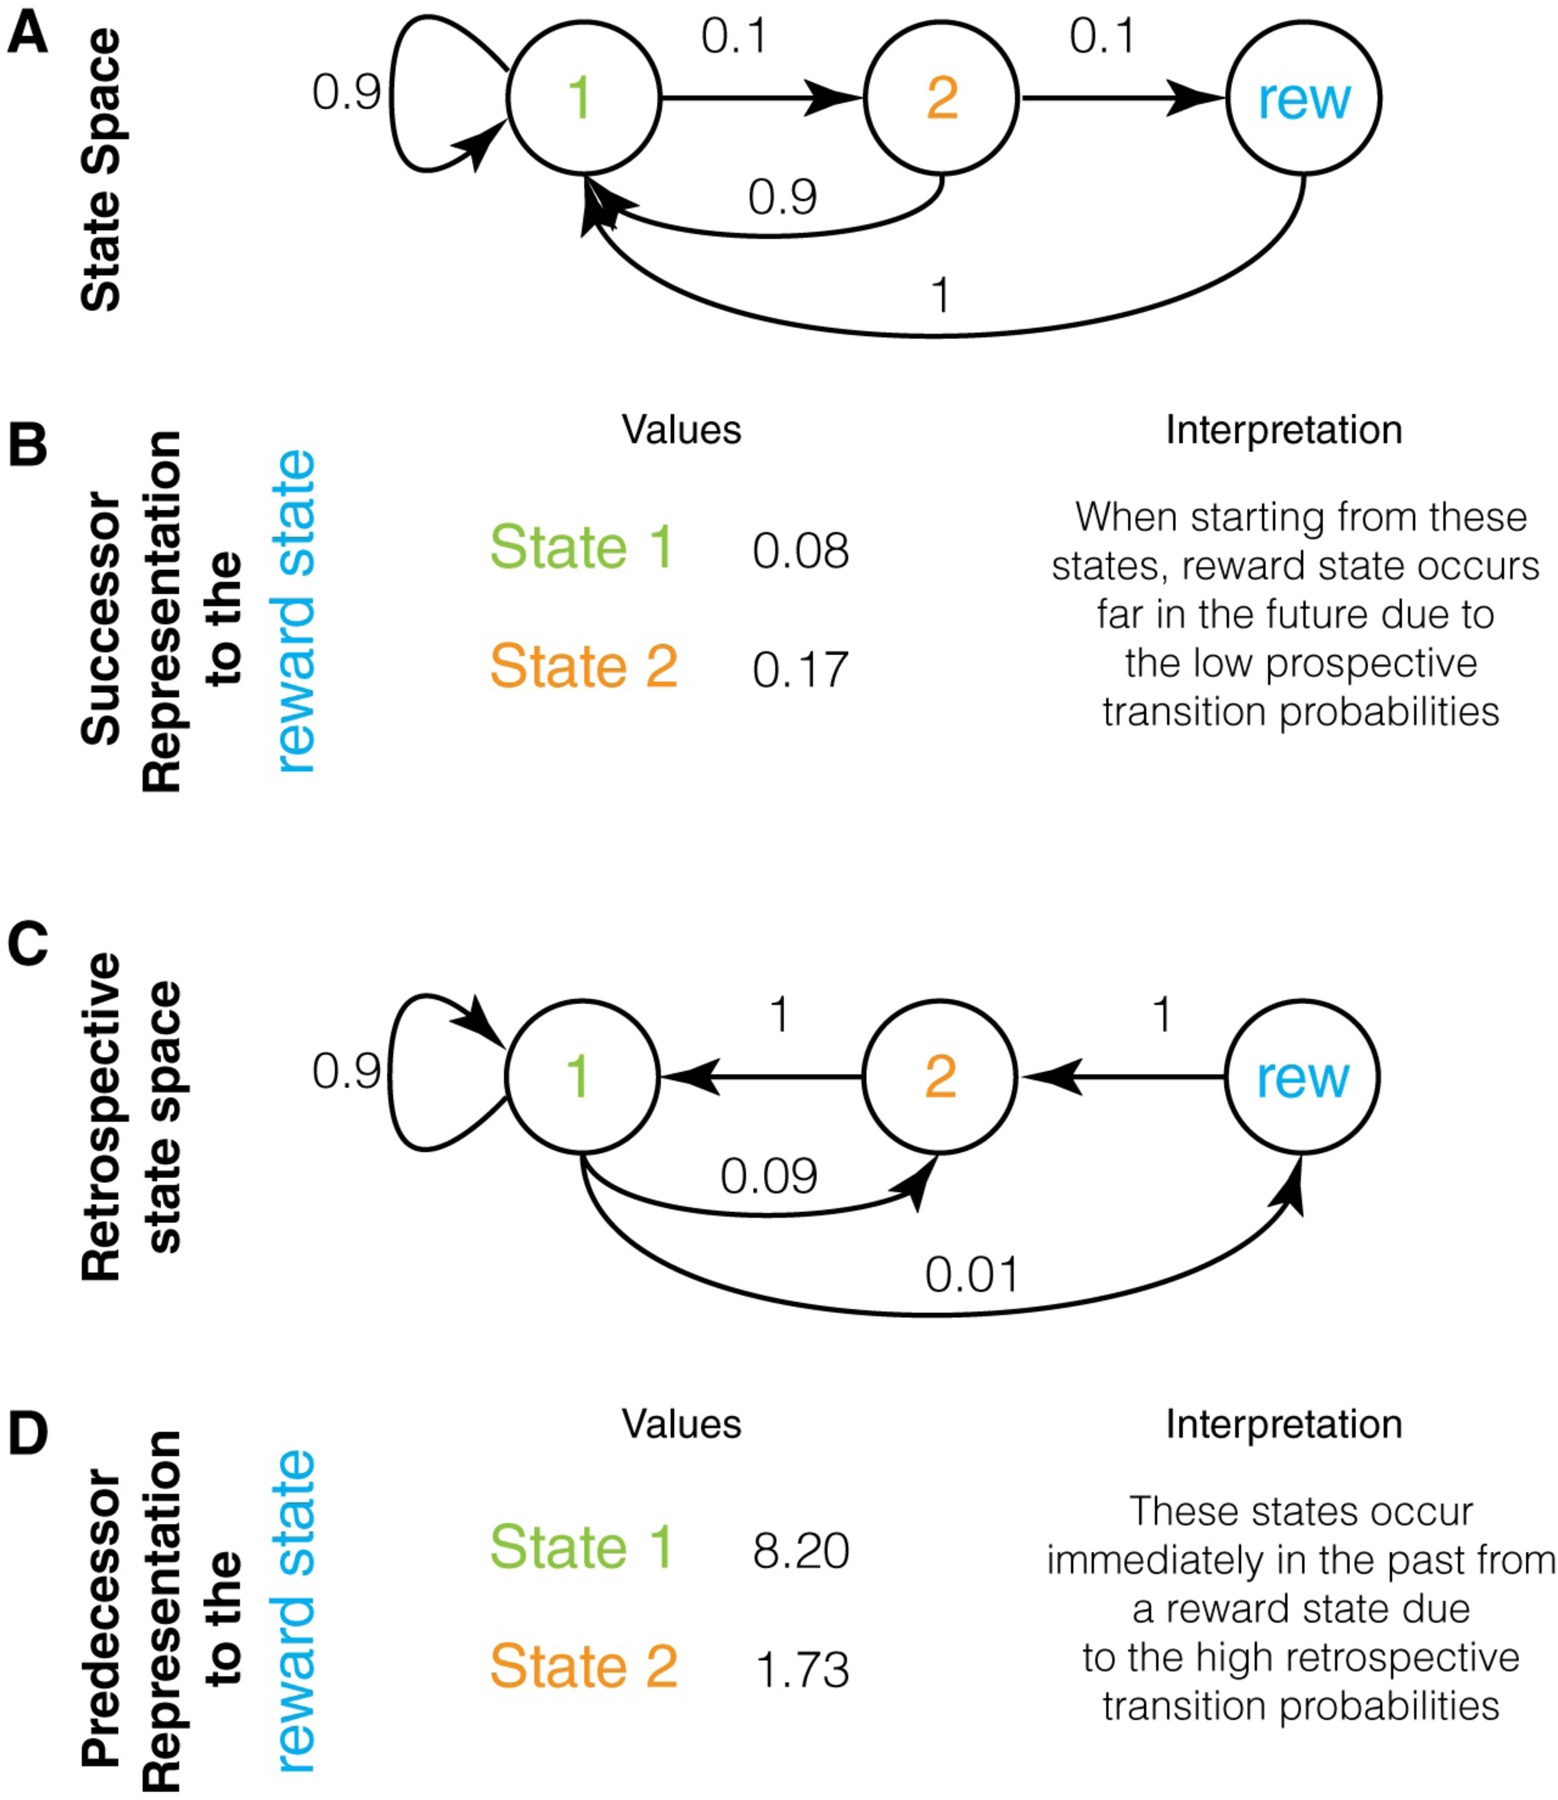
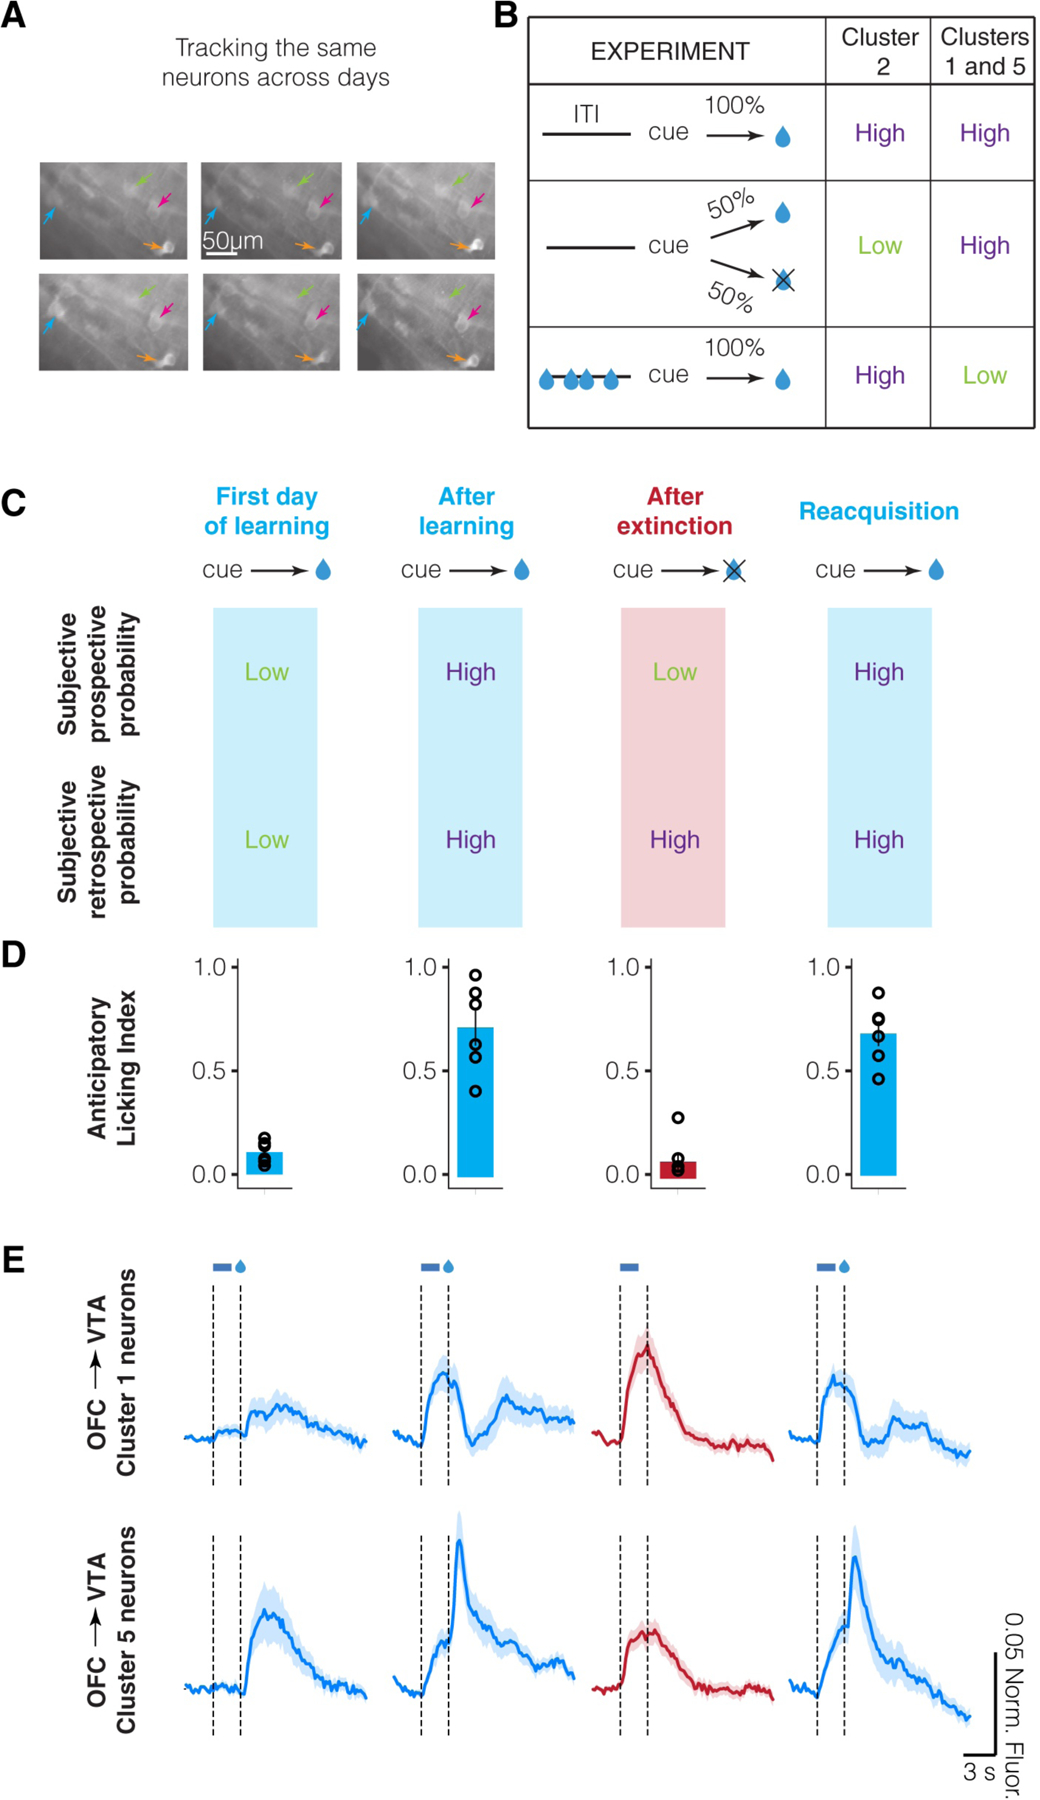
Brain circuits are thought to form a "cognitive map" to process and store statistical relationships in the environment. A cognitive map is commonly defined as a mental representation that describes environmental states (i.e., variables or events) and the relationship between these states. This process is commonly conceptualized as a prospective process, as it is based on the relationships between states in chronological order (e.g., does reward follow a given state?). In this perspective, we expand this concept on the basis of recent findings to postulate that in addition to a prospective map, the brain forms and uses a retrospective cognitive map (e.g., does a given state precede reward?). In doing so, we demonstrate that many neural signals and behaviors (e.g., habits) that seem inflexible and non-cognitive can result from retrospective cognitive maps. Together, we present a significant conceptual reframing of the neurobiological study of associative learning, memory, and decision making.


Figures

Figure 1:
Figure 1:
The causal relationship between reward predictors and rewards may be learned prospectively or retrospectively.
Figure 2:
Figure 2:
Schematic experiments illustrating prospective and retrospective transition probabilities. In the top experiment, there is a high prospective and retrospective probability between the reward predictor and reward. ITI stands for intertrial interval, i.e. the duration between a reward and the next reward predictor. In the middle experiment, the prospective probability is low since cue/action predicts reward only 50% of the time. However, retrospective probability is high since every reward is preceded by the cue/action. In the bottom experiment, prospective probability is high, as every cue/action is followed by a reward, but the retrospective probability is low since not every reward is preceded by the cue/action.
Figure 3
Figure 3
Successor and Predecessor representations: A. A state space that illustrates the key difference between successor and predecessor representations. Here, state 1 transitions with 10% probability to state 2, which then transitions with 10% probability to a reward state. Thus, obtaining reward is only possible by starting at state 1, even though the probability of reward is extremely low when starting at state 1 (1%). The challenge of an animal is to learn that the only feasible path to a reward state is by starting in state 1. B. The values of the successor representation to a reward state for states 1 and 2 are shown under the assumption of a discount factor of 0.9 (calculated in Appendix 1). These are very low and reflect the fact that reward states typically occur far into the future when starting in these states (due to low transition probabilities to reward state). Hence, these low values do not highlight that a reward state is only feasible if the animal starts in state 1. C. The retrospective state space for this example, showing that ending up in a reward state means that it is certain that the previous state was state 2 and that the second previous state was state 1. Thus, a retrospective evaluation makes it clear that a reward state is only feasible if one starts in state 1. D. The predecessor representation of the two states to the reward state. These values are very high compared to the SR and highlight the fact that a reward state is only feasible if the animal starts in state 1. PR is higher for state 1 because it is a much more frequent state (see text).
Figure 4
Figure 4
Neuronal activity in select OFC neuronal subpopulations is consistent with a representation of the retrospective transition probability A. Longitudinal tracking of the same neurons across many days using two-photon calcium imaging (reproduced from Namboodiri et al. 2019). Four example neurons are shown in different colored arrows. B. Qualitative summary of data from three separate subpopulations of neurons identified by clustering neuronal activity (summarized from Namboodiri et al. 2019). Comparison with Figure 2 shows qualitative correspondence of these groups with a representation of prospective and retrospective transition probabilities. C. Additional test of the representation of a retrospective transition probability using extinction of learned cue-reward pairing. The expected subjective probabilities are shown. D. Anticipatory licking induced by the cue, showing that animals learn extinction. E. Mean normalized fluorescence of longitudinally tracked OFC→VTA neurons (n=27 cluster 1, n=23 cluster 5) plotted against time locked to cue onset. Cue response (between the dashed lines) is high even after extinction, consistent with the expected subjective retrospective transition probability.
Figure 5
Figure 5
Representation of retrospective transition probability in a songbird brain: The y-axis measures the response modulation of neurons in area HVC of the Bengalese finch to a syllable (Bouchard and Brainard, 2013). The x-axis measures the retrospective transition probability from that syllable to the preceding sequence in the natural song of the bird. An increase in retrospective transition probability to the preceding stimulus causes a linear increase in response of HVC neurons. Reproduced here with permission (Fig 4G in original publication).
Figure 6
Figure 6
Reconceptualization of the function of several neural circuits. Here, we speculatively propose a reconceptualized framework of the function of several nodes of the neural circuits involved in associative learning. While we propose some evidence consistent with our framework in the text, we present this framework primarily to stimulate future experimental testing. For simplicity, we omit representations of reward value/magnitude. Further, we are not proposing that the listed functions completely describe a given node. Almost certainly, each node is involved in many other functions due to the heterogeneity of cell types.
Box Fig 1.
Box Fig 1.
Illustration of SR and PR contingencies: A. An example high dimensional state space. All prospective transition probabilities are denoted by the corresponding arrows. B. Intuitive interpretation of the state space in A. Since the only path to reward goes through state 1, state 1 is the most important state to organize learning around. C. SR and PR for all states to the reward state. Here, the discounting factor was set to 0.99. Neither the SR nor the PR magnitudes highlight the fact that state 1 is the most important state for the path to reward. Note that the PR values here mostly reflect how frequent each state is, with state 5 being the most frequent state. This is also the reason why the mean SR value is much lower than the mean PR value, as the mean SR value reflects the relative frequency of the reward state. D. SR and PR contingencies for all states to the reward state. These quantities account for the relative frequencies of all states. SR contingency measures how much more frequently a given state occurs after reward compared to a random state. PR contingency measures how much more frequently a given state occurs before reward compared to a random state. PR contingency quantitatively measures all the important intuitive observations in B regarding the state space.

Similar articles

Cited by

References

    1. Abramson CI (2009). A Study in Inspiration: Charles Henry Turner (1867–1923) and the Investigation of Insect Behavior. Annual Review of Entomology 54, 343–359. - PubMed
    1. Adams CD (1982). Variations in the sensitivity of instrumental responding to reinforcer devaluation. The Quarterly Journal of Experimental Psychology Section B 34, 77–98.
    1. Afsardeir A, and Keramati M (2018). Behavioural signatures of backward planning in animals. Eur J Neurosci 47, 479–487. - PubMed
    1. Alarcón DE, Bonardi C, and Delamater AR (2018). Associative mechanisms involved in specific Pavlovian-to-instrumental transfer in human learning tasks. Quarterly Journal of Experimental Psychology 71, 1607–1625. - PMC - PubMed
    1. Ambrose RE, Pfeiffer BE, and Foster DJ (2016). Reverse Replay of Hippocampal Place Cells Is Uniquely Modulated by Changing Reward. Neuron 91, 1124–1136. - PMC - PubMed

Publication types