. 2021 Dec 13;39(12):1610-1622.e9.
doi: 10.1016/j.ccell.2021.09.011. Epub 2021 Oct 21.

Adoptive cell therapy with tumor-specific Th9 cells induces viral mimicry to eliminate antigen-loss-variant tumor cells

Affiliations

Adoptive cell therapy with tumor-specific Th9 cells induces viral mimicry to eliminate antigen-loss-variant tumor cells

Gang Xue et al. Cancer Cell. .

Abstract

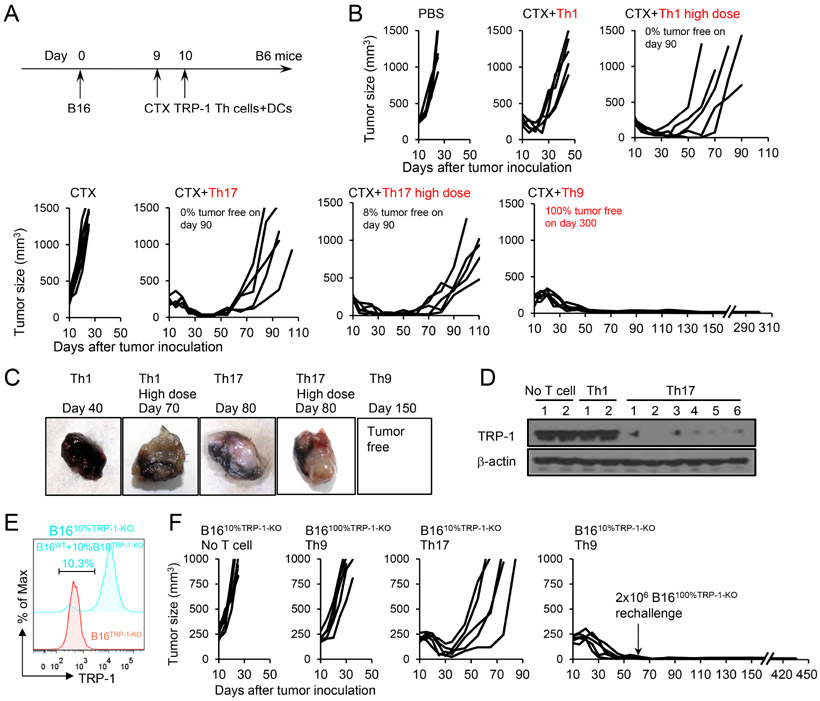
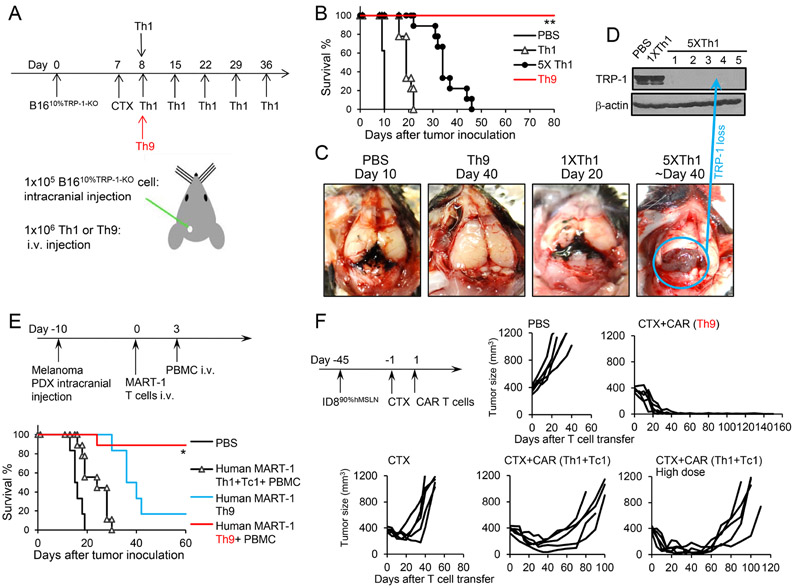
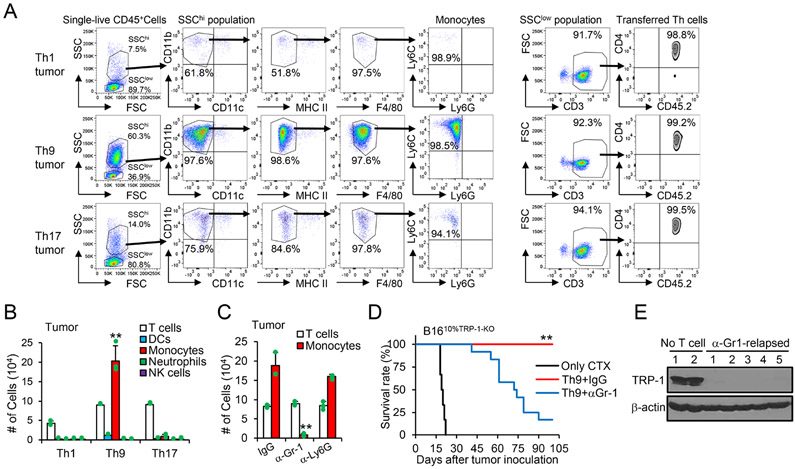
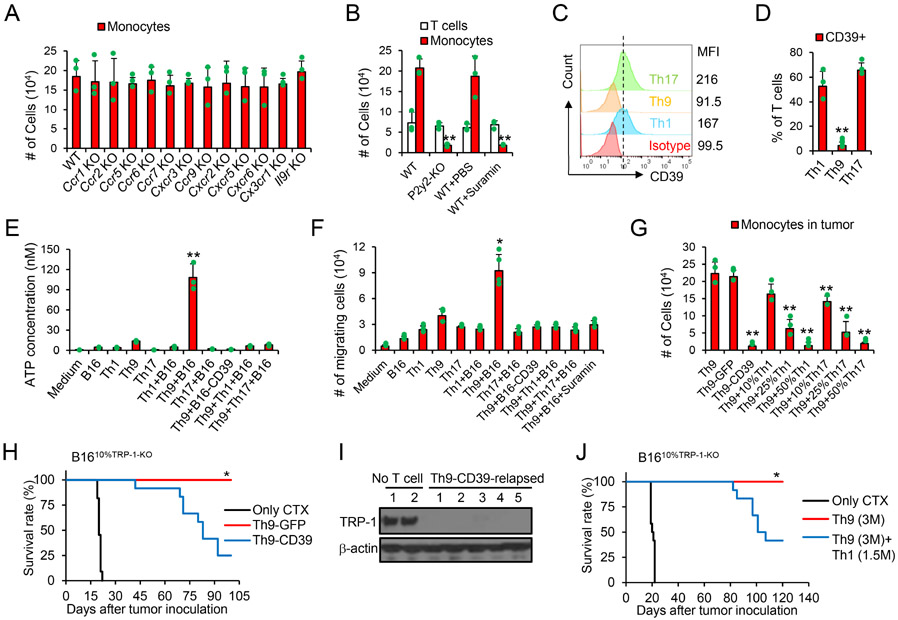
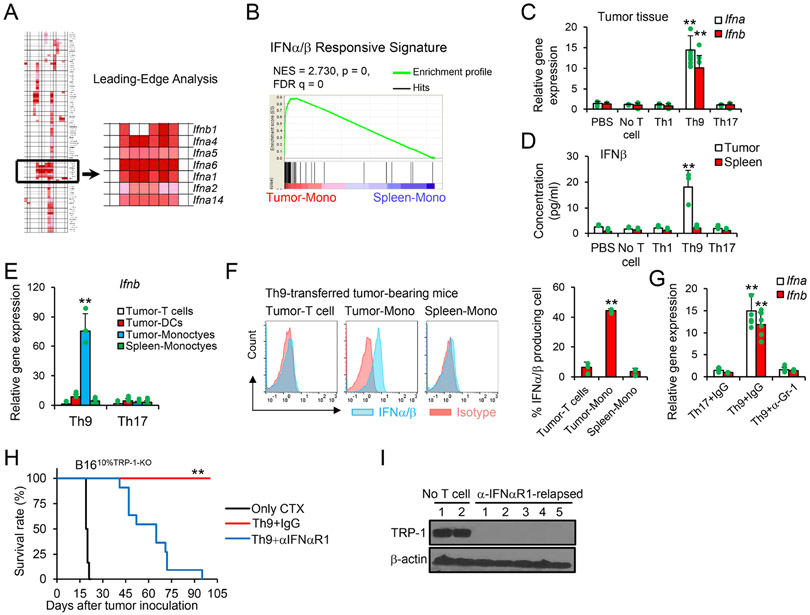
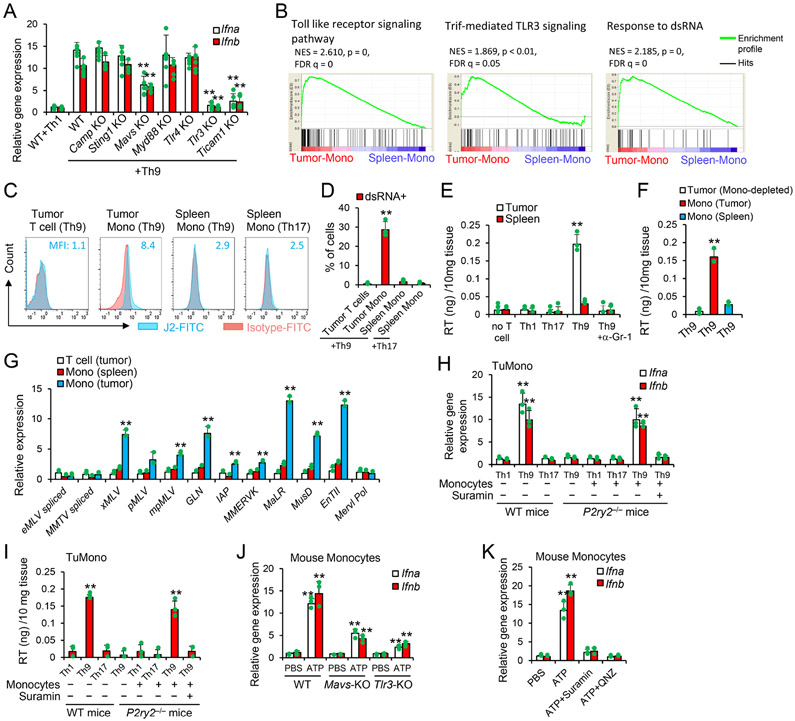
Resistance can occur in patients receiving adoptive cell therapy (ACT) due to antigen-loss-variant (ALV) cancer cell outgrowth. Here we demonstrate that murine and human T helper (Th) 9 cells, but not Th1/Tc1 or Th17 cells, expressing tumor-specific T cell receptors (TCRs) or chimeric antigen receptors (CARs), eradicate advanced tumors that contain ALVs. This unprecedented antitumor capacity of Th9 cells is attributed to both enhanced direct tumor cell killing and bystander antitumor effects promoted by intratumor release of interferon (IFN) α/β. Mechanistically, tumor-specific Th9 cells increase the intratumor accumulation of extracellular ATP (eATP; released from dying tumor cells), because of a unique feature of Th9 cells that lack the expression of ATP degrading ectoenzyme cluster of differentiation (CD) 39. Intratumor enrichment of eATP promotes the monocyte infiltration and stimulates their production of IFNα/β by inducing eATP-endogenous retrovirus-Toll-like receptor 3 (TLR3)/mitochondrial antiviral signaling (MAVS) pathway activation. These results identify tumor-specific Th9 cells as a unique T cell subset endowed with the unprecedented capacity to eliminate ALVs for curative responses.

Keywords: Adoptive cell therapy; Th9; antigen-loss variant cancer cells; type I IFN.


Conflict of interest statement

Declaration of interests The authors declare no competing interests.

Figures

Figure 1.
Figure 1.. Transfer of tumor-specific Th9 cells prevents the relapse of variant tumors.
(A) TRP-1-specific Th1, Th17, Th9 cells (CD45.2+, regular dose, 2.5×10⁶), high dose Th1 (2×10⁷), or high dose Th17 cells (7.5×10⁶) were transferred i.v. into CD45.1+ B6 mice bearing 10-day large established B16 tumors (1×10⁶ B16 cells challenged s.c. 10 days before T cell transfer). Adjuvant cyclophosphamide (CTX, i.p.) and DC vaccination (2.5×10⁵, i.v.) were administered to some mice as indicated. (B) Tumor responses to TRP-1 cell transfer are shown (n=5/group). The description of tumor-free survival is summarized from several independent studies. (C-D) Tumors were harvested from No-T-cell-treated mice, Th1 or Th17-cell-treated mice. Images of representative tumors are shown in (C). Tumor tissue lysates were analyzed for TRP-1 expression by western-blot (D). (E) Intracellular staining of TRP-1 in B1610%TRP-1-KO and B16TRP-1-KO tumor cells. (F) B1610%TRP-1-KO tumor (contain 10% B16TRP-1-KO ALVs)-bearing mice were treated similarly to Fig. 1A. Surviving mice in the Th9-cell-treated group were rechallenged with 2×10⁶ ALVs (B16TRP-1-KO) on day 60. Tumor responses are shown (n=5/group). Representative results from one of two repeated experiments are shown (total # of mice/group ≥ 20 in B; ≥ 10 in F).
Figure 2.
Figure 2.. Effect of TRP-1-specific-Th9 cells and hMesothelin-CAR-Th9 cells.
(A) TRP-1-specific 1.0×10⁶ Th1 (single or multiple doses), or 1.0×10⁶ Th9 cells (CD45.2+) were transferred i.v. into CD45.1+ B6 mice bearing 8-day established intracranially (i.c.) injected B16 tumors (1×10⁵ B1610%TRP-1-KO tumor cells challenged i.c. 8 days before T cell transfer). (B) Survival analysis in response to adoptive cell transfer (n=9-10/group). Data are summarized from two independent studies. **P<0.01, Th9 compared with PBS, Th1, and 5×Th1, survival analysis was conducted by log-rank test. (C-D) Brain tumors were harvested from mice received indicated treatments. Images of representative brain tumors are shown (C). Tumor tissue lysates were analyzed for TRP-1 expression by western blot (D). (E) Human autologous MART-1-specific 1.0×10⁶ Th9, or 1.0×10⁶ Th1+Tc1 cells were transferred i.v. into NSG mice bearing 10-day established intracranially (i.c.) injected melanoma PDX (1×10⁵ cells challenged i.c. 10 days before T cell transfer). Autologous PBMC was administered i.v. to mice on day 3 as indicated. Survival analysis in response to ACT (n=6-9/group). Data are summarized from three independent studies. *P<0.05, Human MART-1 Th9+PBMC compared with any other groups, survival analysis was conducted by log-rank test. (F) hMesothelin-CAR-T cells (5.0×10⁶ GFP+) were transferred i.v. into CD45.1+ B6 mice bearing 45-day-established, s.c. injected ID890%hMesothelin tumors. CAR Th1+Tc1 cells were used in a regular dose of total cell # at 5×10⁶ or in a high dose of 2.5×10⁷ cells. Tumor responses to hMesothelin-CAR-T cell transfer are shown (n=5/group). Data are summarized from two independent studies. Representative results from one of two repeated experiments are shown (total # of mice/group ≥ 10).
Figure 3.
Figure 3.. Tumor inflammatory monocytes recruited by Th9 cells during lymphopenia are crucial to anti-ALV responses.
(A-B) B1610%TRP-1-KO tumor-bearing mice (s.c.) were treated as shown in Fig. 1F. Tumor tissues (200 mg/mice, 10 days after ACT) were harvested and used for FACS analysis. Representative (A) and summarized results (B, n=3-4/group) are shown. Data are mean ± SD. **P<0.01, Th9 compared with Th1 and Th17 groups, one-way ANOVA with Tukey test. (C-E) B1610%TRP-1-KO tumor-bearing mice were treated with Th9 cells as shown in Fig. 1F, together with indicated antibodies every 3 days after ACT. Tumor-infiltrating indicated immune cells are calculated from FACS analysis (C, n=3-4/group). Data are mean ± SD. **P<0.01, α-Gr-1 compared with IgG and α-Ly6G groups, one-way ANOVA with Tukey test. (D) Mice survival curves are shown (n=9-12/group, combined from 2 independent experiments), **P<0.01, compared with any other groups, survival analysis was conducted by log-rank test. (E) Tumor (~day 60) tissue lysates were analyzed for TRP-1 production by western-blot. Representative results from one of two repeated experiments are shown.
Figure 4.
Figure 4.. Tumor-specific Th9 cells promote eATP-P2Y2 dependent chemotaxis of tumor monocytes.
(A-B) B1610%TRP-1-KO tumor-bearing WT or transgenic mice were treated as shown in Fig. 1F. Some mice were treated with i.p. injection of suramin. Tumor tissues (200 mg/mice, 10 days after ACT) were harvested and leukocytes were counted and used for FACS analysis. Tumor-infiltrating indicated immune cells are calculated from FACS analysis (B, n=3-4/group). Data are mean ± SD. **P<0.01, compared with WT and WT+PBS groups, one-way ANOVA with Tukey test. (C-D) Surface expression of CD39 on TRP-1 T cells was analyzed by FACS. Data are mean ± SD. **P<0.01, Th9 compared with Th1 and Th17 groups, one-way ANOVA with Tukey test. (E) B16 tumor cells and TRP-1 T cells were cultured alone or cocultured as indicated for 24 hours (n=3). The ATP concentrations in the culture supernatant were determined by ATP Determination Kit. Data are mean ± SD. **P<0.01, Th9+B16 compared with any other groups, one-way ANOVA with Tukey test. (F) Monocytes migration assay. B16-bearing mice were treated with CTX. SpMono were sorted 10 days later and seeded in Transwells with the bottom media from the supernatant of indicated cell cultures. Cells migrated to the bottom after 18 hrs are counted by cell counter. Data are mean ± SD. *P<0.05, Th9 compared with any other groups, one-way ANOVA with Tukey test. (G) B1610%TRP-1-KO tumor-bearing WT mice were treated as shown in Fig. 1F. Tumor tissues (200 mg/mice, 10 days after ACT) were harvested and leukocytes were counted and used for FACS analysis (G, n=3-4/group). Data are mean ± SD. **P<0.01, compared with Th9 and Th9-GFP groups, one-way ANOVA with Tukey test. (H-I) B1610%TRP-1-KO tumor-bearing WT mice were treated as shown in Fig. 1F. (H) Mice survival curves are shown (n=10-12/group, combined from 3 independent experiments), *P<0.05, compared with any other groups, survival analysis was conducted by log-rank test. (I) Tumor (~day 60) tissue lysates were analyzed for TRP-1 production by western-blot. (J) B1610%TRP-1-KO tumor-bearing WT mice were treated as shown in Fig. 1F. Mice survival curves are shown (n=9-12/group, combined from 3 independent experiments), *P<0.05, compared with any other groups, survival analysis was conducted by log-rank test. Representative results from one of two or three repeated experiments are shown.
Figure 5.
Figure 5.. Th9 cell ACT induces type I IFN signatures in tumor for ALV-clearance.
(A-B) Mice were treated as in Fig. 1F, and mice transferred with Th9 cells were euthanized 10 days after transfer. Tumor monocytes and SpMono were sorted for gene array (n=3). Shown is a gene cluster that contributes the most to the enrichment signal of a given gene set's leading edge or core enrichment (A) and IFNα/β responsive signature (B). (C-G) Mice were treated as in Fig. 1F. (C) Tumor tissues were extracted for total RNA and analyzed by qPCR (n=3/group). Data are mean ± SD. **P<0.01, compared with any other groups, one-way ANOVA with Tukey test. (D) Tumor lysate supernatants were analyzed by ELISA for IFNβ (n=3/group). Data are mean ± SD. **P<0.01, compared with any other groups, one-way ANOVA with Tukey test. (E) The indicated cells were sorted for qPCR (n=3/group). Data are mean ± SD. **P<0.01, Th9 compared with Th17 group, one-way ANOVA with Tukey test. (F) Intracellular staining of IFNα/β was performed on the indicated cells obtained from Th9-treated mice (n=3/group). Data are mean ± SD. **P<0.01, tumor-Mono compared with Tumor-T cells or Spleen-Mono groups, one-way ANOVA with Tukey test. (G) Tumor tissues from mice with the indicated treatments were extracted for total RNA and analyzed by qPCR (n=3/group). Data are mean ± SD. **P<0.01, Th9+IgG compared with any other groups, one-way ANOVA with Tukey test. (H-I) B1610%TRP-1-KO tumor-bearing WT mice were treated as shown in Fig. 1F, with antibody injection i.p. every 3 days after ACT. (H) Mice survival curves are shown (n=9-11/group, combined from 2 independent experiments), **P<0.01, compared with any other groups, survival analysis was conducted by log-rank test. (I) Tumor (~day 60) tissue lysates were analyzed for TRP-1 production by western-blot. Representative results from one of two repeated experiments are shown.
Figure 6.
Figure 6.. Viral mimicry in tumor monocytes is required for Th9 anti-ALV responses.
(A) B1610%TRP-1-KO tumor-bearing WT or transgenic mice were treated as shown in Fig. 1F. Tumor tissues (10 days after ACT) were extracted for total RNA and analyzed by qPCR (n=3/group), Data are mean ± SD. **P<0.01, compared with WT+Th9 group, one-way ANOVA with Tukey test. (B) GSEA of the gene profiles as in Fig. 5A was performed for the indicated gene signatures. (C-D) Intracellular staining of dsRNA (n=3/group) was performed in the indicated cells 10 days after treatments similar as in Fig. 1F. Data are mean ± SD. **P<0.01, compared with any other groups, one-way ANOVA with Tukey test. (E-F) B1610%TRP-1-KO tumor-bearing WT mice were treated as shown in Fig. 1F. Tumor tissues (E) or sorted cells (F) 10 days after ACT were lysed by 1% Triton-X-100. Data are mean ± SD. **P<0.01, compared with any other groups, one-way ANOVA with Tukey test. (G) Tumor-infiltrating cells sorted from Th9-treated mice 10 days after transfer (n=3/group) were tested for transcript levels of the indicated murine ERVs measured by qPCR. Data are mean ± SD. **P<0.01, compared with T cell (tumor) and Mono (spleen) groups, one-way ANOVA with Tukey test. (H-I) WT SpMono sorted from CTX-treated mice were injected into tumor of P2ry2−/− mice (10 days after tumor-bearing P2ry2−/− mice treated with CTX+T cells w/o suramin). The tumor tissues were analyzed by qPCR (H) and RT activity (I) 3 days later (n=3-4/group). Data are mean ± SD. **P<0.01, Th9 cells compared with Th1, Th17 cells, and spleen-mono injected into tumor receiving Th9 cells and suramin, one-way ANOVA with Tukey test. (J) SpMono sorted from CTX-treated WT, Tlr3 KO, or Mavs KO mice were treated as indicated and performed for qPCR analysis (n=3/group). Data are mean ± SD. **P<0.01, compared with PBS or WT/ATP groups, one-way ANOVA with Tukey test. (K) WT SpMono sorted from CTX-treated mice were treated as indicated and performed for qPCR (n=3/group). Data are mean ± SD. **P<0.01, compared with any other groups, one-way ANOVA with Tukey test. Representative results from one of two repeated experiments are shown.

Comment in

References

    1. Adachi K, Kano Y, Nagai T, Okuyama N, Sakoda Y, and Tamada K (2018). IL-7 and CCL19 expression in CAR-T cells improves immune cell infiltration and CAR-T cell survival in the tumor. Nat. Biotechnol - PubMed
    1. Cohen Adam D., MD, Garfall Alfred L., MD, Stadtmauer Edward A., MD1, Melenhorst JJ, PhD, Lacey Simon F., PhD, Lancaster Eric, MD, Vogl Dan T., MD, Weiss BM, MD1, Dengel Karen, RN, Nelson Annemarie, RN, Plesa Gabriela, MD, PhD, Chen F, PhD, and, Davis Megan M., P. (2019). B cell maturation antigen-specific CAR T cells are clinically active in multiple myeloma. J Clin Invest March 21. - PMC - PubMed
    1. Becker JC, and Schrama D (2013). The Dark Side of Cyclophosphamide: Cyclophosphamide-Mediated Ablation of Regulatory T Cells. J. Invest. Dermatol 133, 1462–1465. - PubMed
    1. Bedard PL, Hansen AR, Ratain MJ, and Siu LL (2013). Tumour heterogeneity in the clinic. Nature 501, 355–364. - PMC - PubMed
    1. Borbulevych OY, Santhanagopolan SM, Hossain M, and Baker BM (2011). TCRs Used in Cancer Gene Therapy Cross-React with MART-1/Melan-A Tumor Antigens via Distinct Mechanisms. J. Immunol 187, 2453–2463. - PMC - PubMed

Publication types

LinkOut - more resources