

Seroepidemiology and model-based prediction of SARS-CoV-2 in Ethiopia: longitudinal cohort study among front-line hospital workers and communities
- PMID: 34678196
- PMCID: PMC8525918
- DOI: 10.1016/S2214-109X(21)00386-7
Seroepidemiology and model-based prediction of SARS-CoV-2 in Ethiopia: longitudinal cohort study among front-line hospital workers and communities
Abstract
Background: Over 1 year since the first reported case, the true COVID-19 burden in Ethiopia remains unknown due to insufficient surveillance. We aimed to investigate the seroepidemiology of SARS-CoV-2 among front-line hospital workers and communities in Ethiopia.
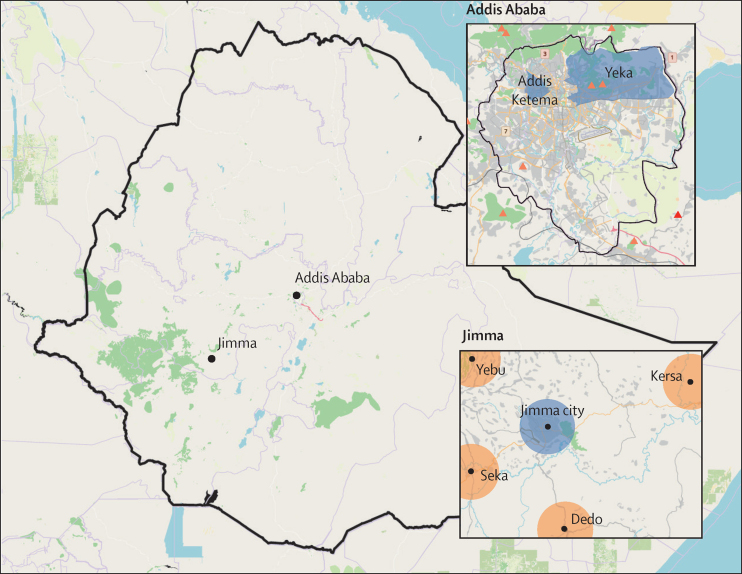
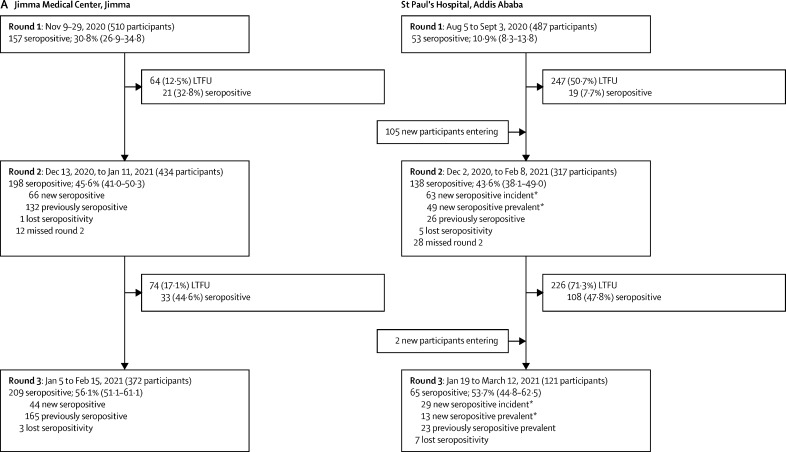
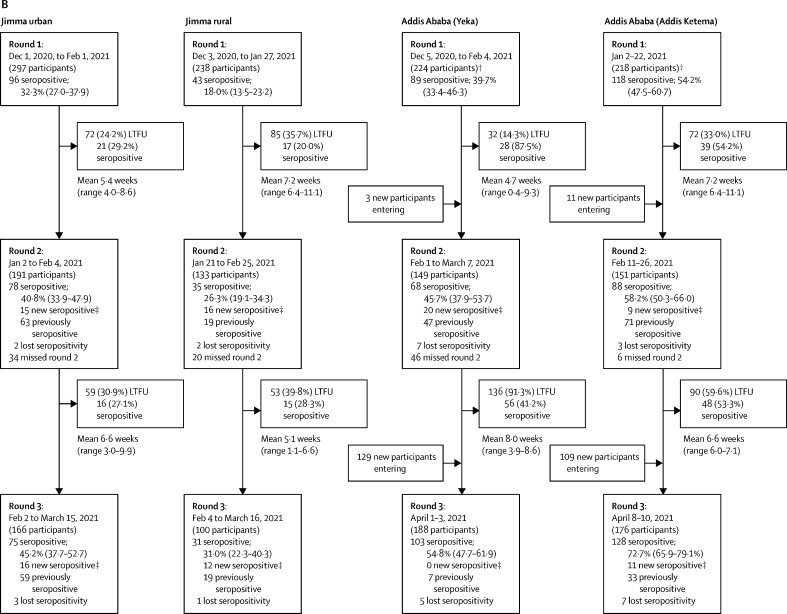
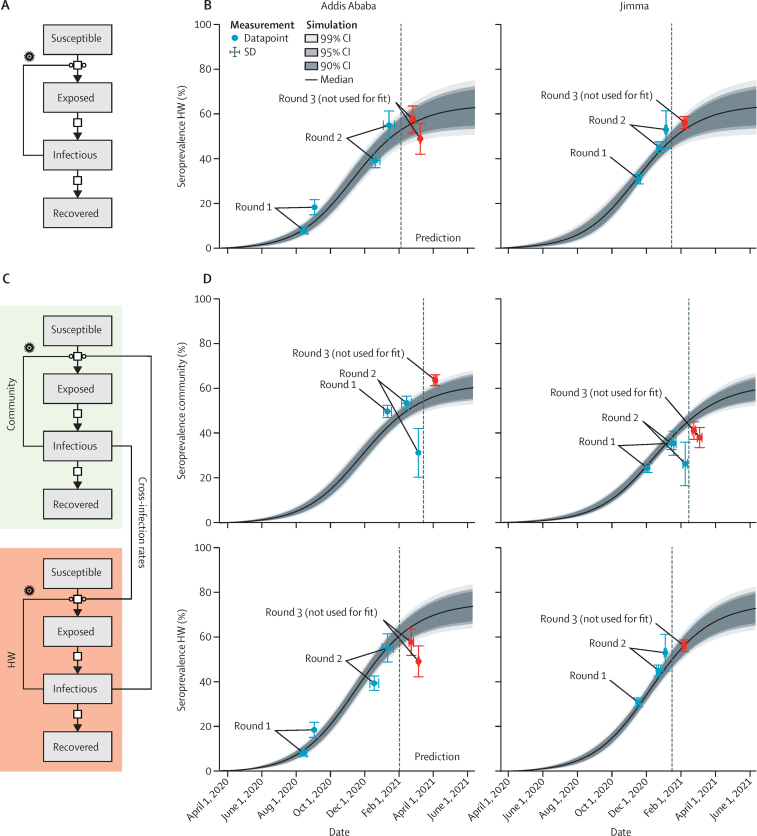
Methods: We did a population-based, longitudinal cohort study at two tertiary teaching hospitals involving hospital workers, rural residents, and urban communities in Jimma and Addis Ababa. Hospital workers were recruited at both hospitals, and community participants were recruited by convenience sampling including urban metropolitan settings, urban and semi-urban settings, and rural communities. Participants were eligible if they were aged 18 years or older, had provided written informed consent, and were willing to provide blood samples by venepuncture. Only one participant per household was recruited. Serology was done with Elecsys anti-SARS-CoV-2 anti-nucleocapsid assay in three consecutive rounds, with a mean interval of 6 weeks between tests, to obtain seroprevalence and incidence estimates within the cohorts.
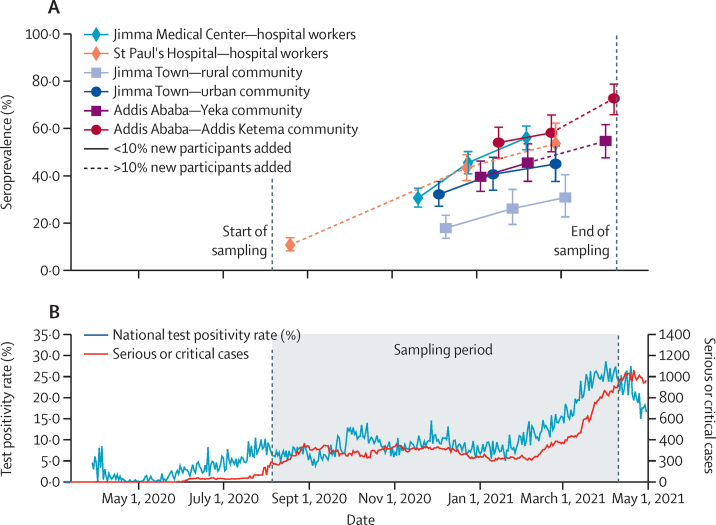
Findings: Between Aug 5, 2020, and April 10, 2021, we did three survey rounds with a total of 1104 hospital workers and 1229 community residents participating. SARS-CoV-2 seroprevalence among hospital workers increased strongly during the study period: in Addis Ababa, it increased from 10·9% (95% credible interval [CrI] 8·3-13·8) in August, 2020, to 53·7% (44·8-62·5) in February, 2021, with an incidence rate of 2223 per 100 000 person-weeks (95% CI 1785-2696); in Jimma Town, it increased from 30·8% (95% CrI 26·9-34·8) in November, 2020, to 56·1% (51·1-61·1) in February, 2021, with an incidence rate of 3810 per 100 000 person-weeks (95% CI 3149-4540). Among urban communities, an almost 40% increase in seroprevalence was observed in early 2021, with incidence rates of 1622 per 100 000 person-weeks (1004-2429) in Jimma Town and 4646 per 100 000 person-weeks (2797-7255) in Addis Ababa. Seroprevalence in rural communities increased from 18·0% (95% CrI 13·5-23·2) in November, 2020, to 31·0% (22·3-40·3) in March, 2021.
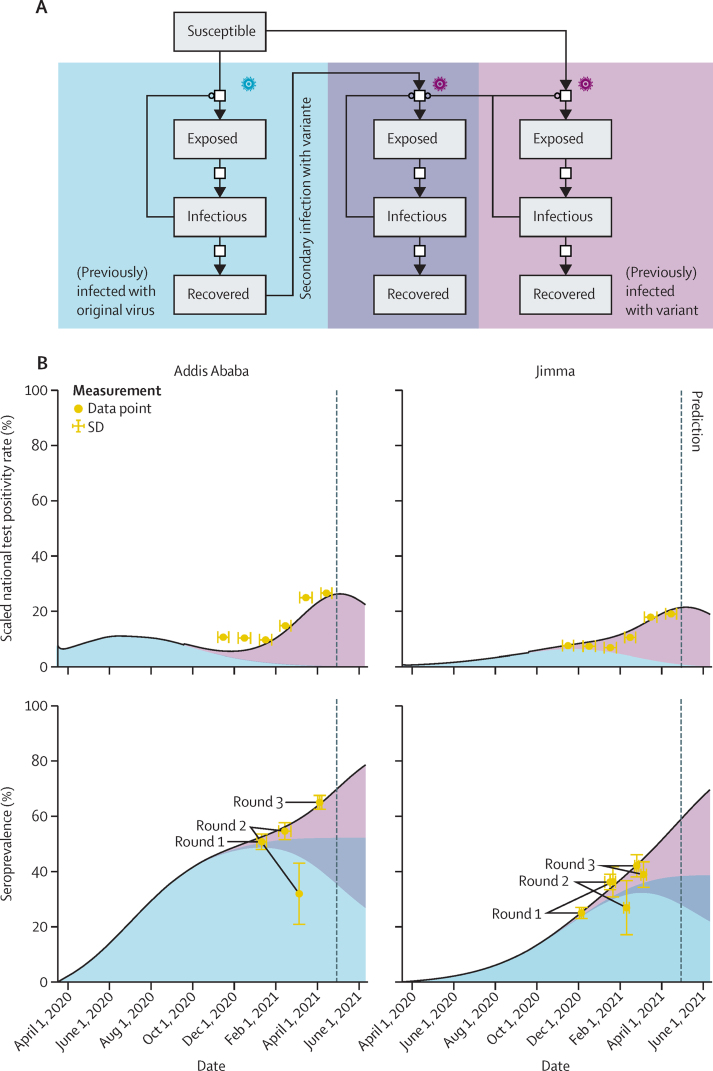
Interpretation: SARS-CoV-2 spread in Ethiopia has been highly dynamic among hospital worker and urban communities. We can speculate that the greatest wave of SARS-CoV-2 infections is currently evolving in rural Ethiopia, and thus requires focused attention regarding health-care burden and disease prevention.
Funding: Bavarian State Ministry of Sciences, Research, and the Arts; Germany Ministry of Education and Research; EU Horizon 2020 programme; Deutsche Forschungsgemeinschaft; and Volkswagenstiftung.
Copyright © 2021 The Author(s). Published by Elsevier Ltd. This is an Open Access article under the CC BY-NC-ND 4.0 license. Published by Elsevier Ltd.. All rights reserved.
Conflict of interest statement
Declaration of interests We declare no competing interests.
Figures
Comment in
-
Escalating burden of SARS-CoV-2 infection in Ethiopia.Lancet Glob Health. 2021 Nov;9(11):e1477-e1478. doi: 10.1016/S2214-109X(21)00436-8. Lancet Glob Health. 2021. PMID: 34678181 Free PMC article. No abstract available.
References
-
- Massinga Loembé M, Tshangela A, Salyer SJ, Varma JK, Ouma AEO, Nkengasong JN. COVID-19 in Africa: the spread and response. Nat Med. 2020;26:999–1003. - PubMed
-
- African Centers for Disease Control and Prevention Coronavirus disease 2019 (COVID-19) https://africacdc.org/covid-19/
-
- Johns Hopkins University COVID-19 dashboard by the Center for Systems Science and Engineering (CSSE) at Johns Hopkins University. https://coronavirus.jhu.edu/map.html
-
- Gudina EK, Tesfaye M, Siraj D, Haileamilak A, Yilma D. COVID-19 in Ethiopia in the first 180 days: lessons learned and the way forward. Ethiop J Health Dev. 2020;34:6.
Publication types
MeSH terms
LinkOut - more resources
Full Text Sources
Medical
Miscellaneous
