. 2021 Nov 9;16(11):2718-2735.
doi: 10.1016/j.stemcr.2021.09.014. Epub 2021 Oct 21.

Pluripotent stem cell derived dopaminergic subpopulations model the selective neuron degeneration in Parkinson's disease

Affiliations

Pluripotent stem cell derived dopaminergic subpopulations model the selective neuron degeneration in Parkinson's disease

Tony Oosterveen et al. Stem Cell Reports. .

Abstract

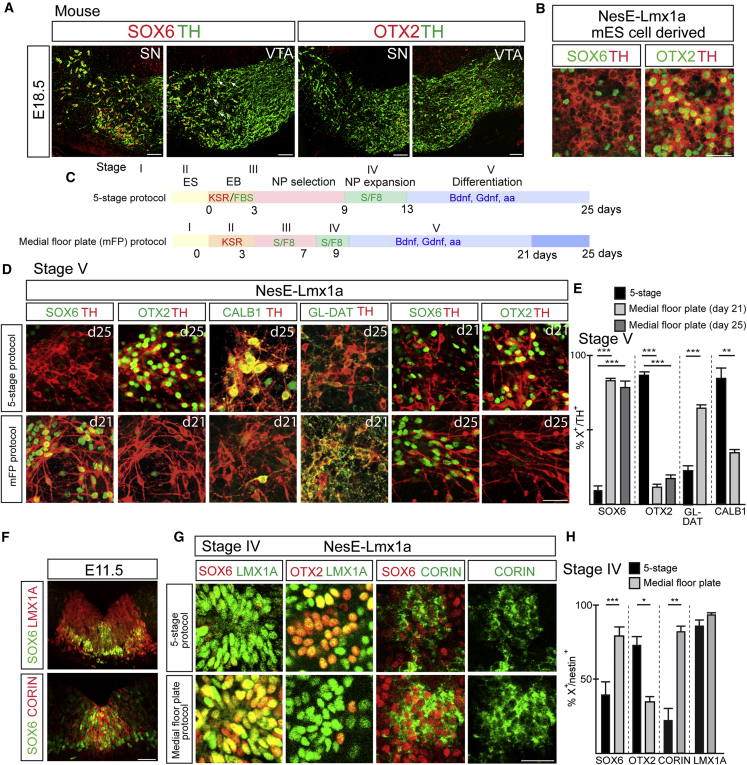
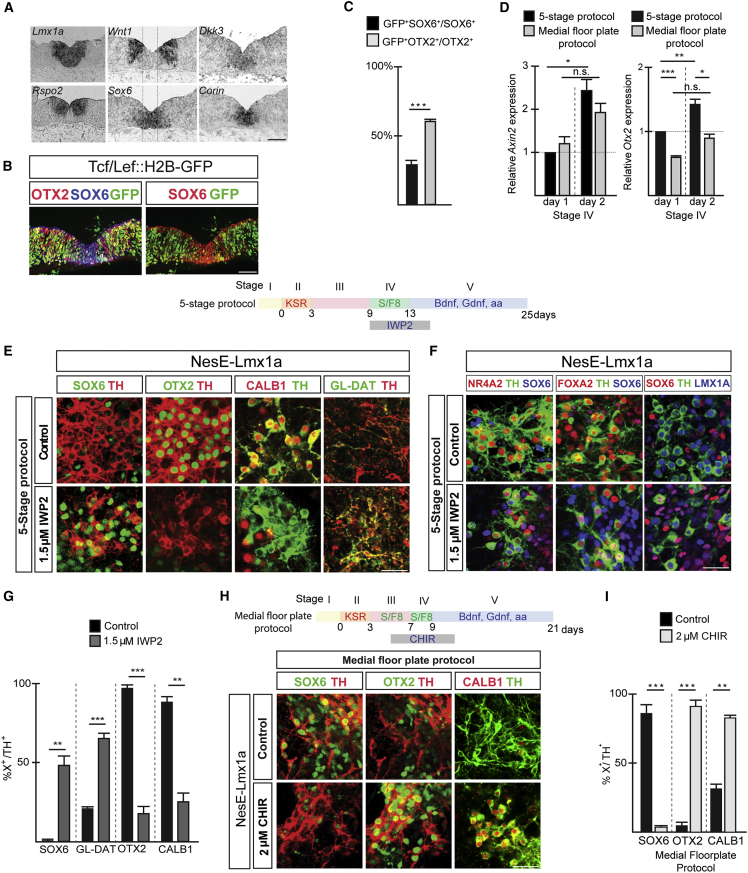
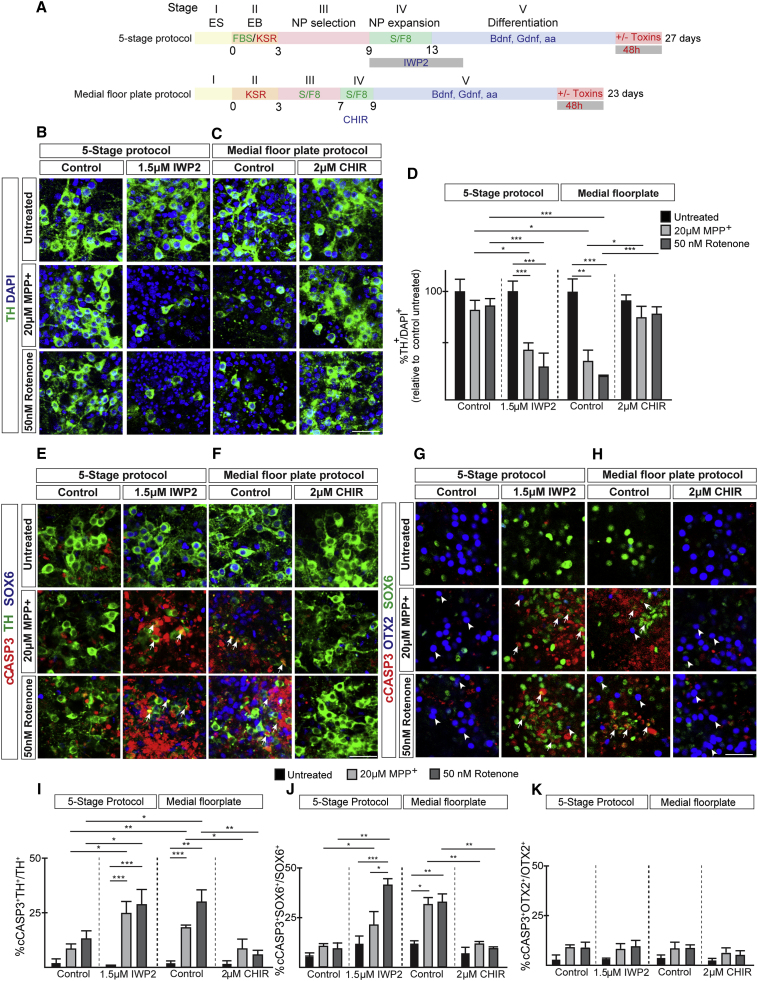
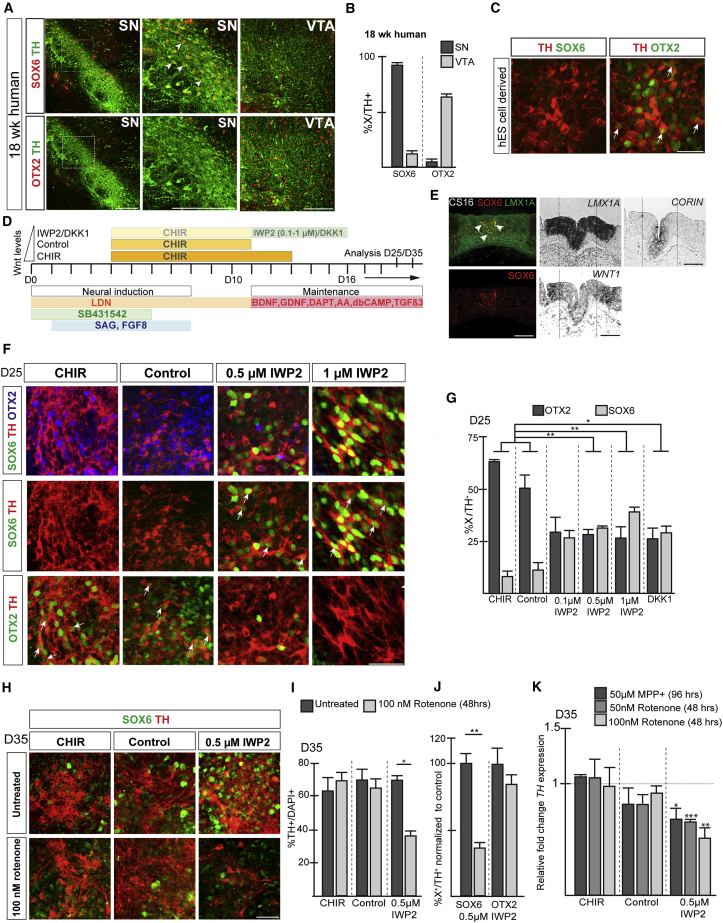
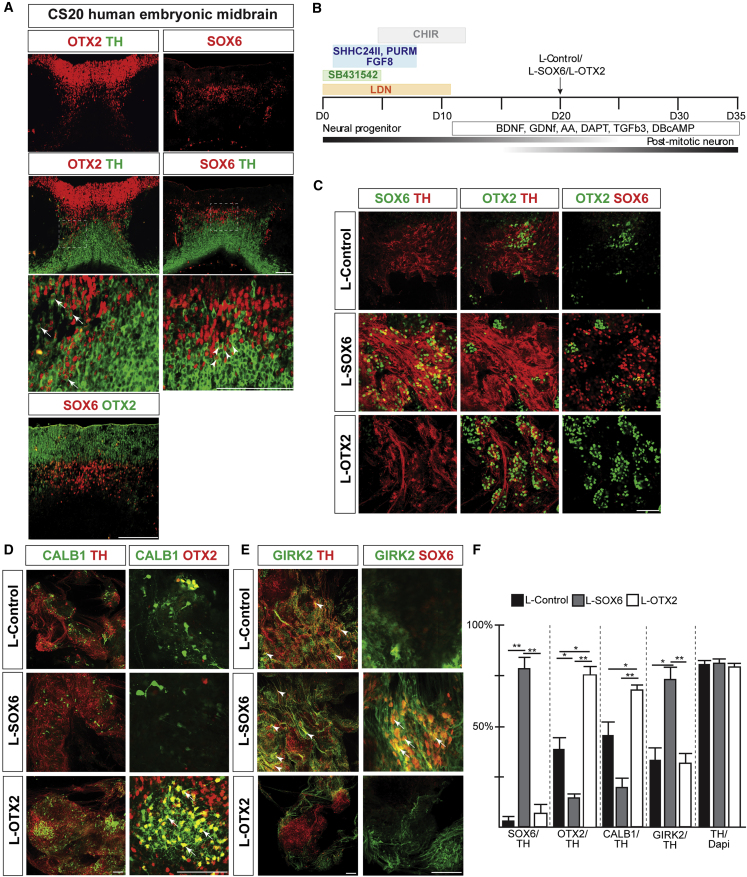
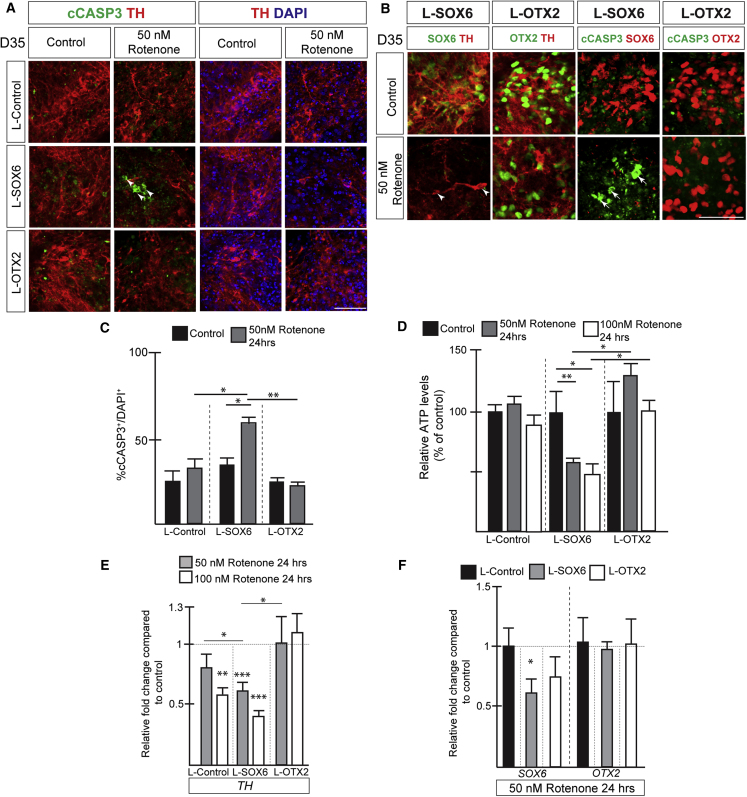
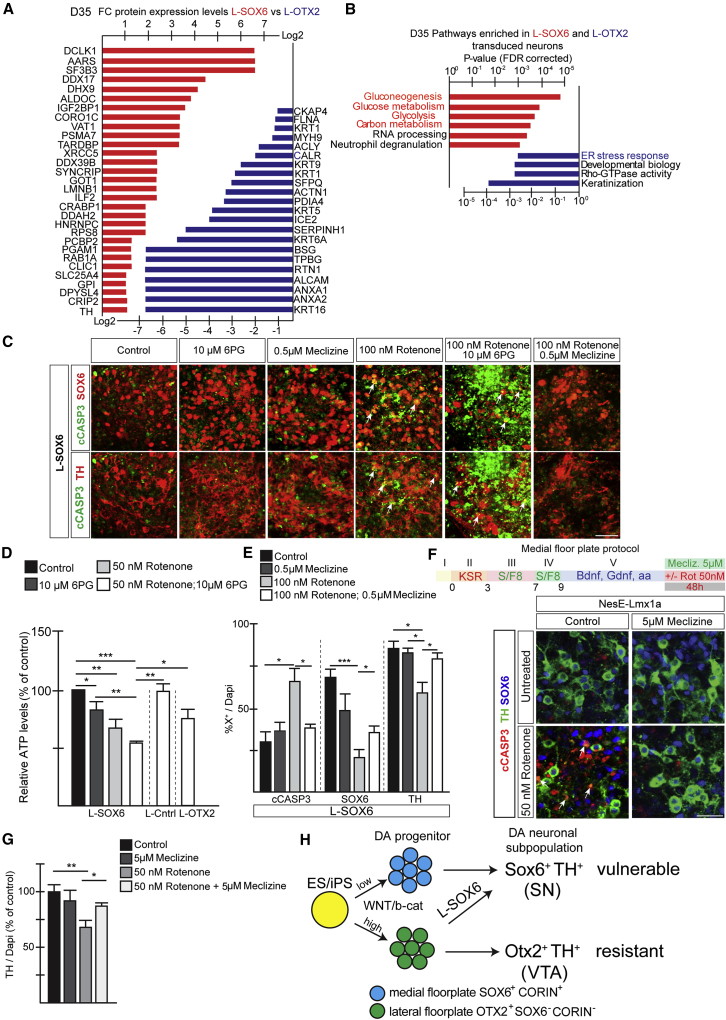
In Parkinson's disease (PD), substantia nigra (SN) dopaminergic (DA) neurons degenerate, while related ventral tegmental area (VTA) DA neurons remain relatively unaffected. Here, we present a methodology that directs the differentiation of mouse and human pluripotent stem cells toward either SN- or VTA-like DA lineage and models their distinct vulnerabilities. We show that the level of WNT activity is critical for the induction of the SN- and VTA-lineage transcription factors Sox6 and Otx2, respectively. Both WNT signaling modulation and forced expression of these transcription factors can drive DA neurons toward the SN- or VTA-like fate. Importantly, the SN-like lineage enriched DA cultures recapitulate the selective sensitivity to mitochondrial toxins as observed in PD, while VTA-like neuron-enriched cultures are more resistant. Furthermore, a proteomics approach led to the identification of compounds that alter SN neuronal survival, demonstrating the utility of our strategy for disease modeling and drug discovery.

Keywords: derivation of substantia nigra dopaminergic neuronal lineage from pluripotent stem cells; directed differentiation of pluripotent stem cells into distinct dopaminergic subpopulations; modeling selective dopaminergic vulnerability in vitro; pluripotent stem cell-based model of Parkinson's disease.


Figures

Figure 1
Figure 1
Directed differentiation of mESCs toward SN-like neuronal lineage (A) Immunohistochemical (IHC) analysis of SOX6 and OTX2 in SN and VTA neurons of E18.5 mouse embryo. Arrows point to Sox6-expressing cells within VTA. (B) IHC analysis of Nes-Lmx1a mESC-derived DA neurons. (C) Schematic overview of the 5-stage and medial FP protocols. (D) IHC analysis of NesE-Lmx1a ESC-derived neurons (stage V). (E) Percentages of TH+ neurons expressing the indicated neuronal markers in Nes-Lmx1a mESC-derived DA neurons (stage V). Mean values ± SD; one-way ANOVA with Bonferroni correction (SOX6 and OTX2) or unpaired t test (GlycoDAT and CALB1); n = 3 independent experiments. (F) IHC analysis of midbrain FP of E11.5 mouse embryo. (G) IHC analysis of DA progenitor markers in Nes-Lmx1a mESC-derived progenitors (stage IV). (H) Percentage of NESTIN+ cells expressing indicated markers in Nes-Lmx1a mESC-derived neural progenitors (stage IV). n = 3 independent experiments; mean values ± SD; unpaired t test. p < 0.05, ∗∗p < 0.01, ∗∗∗p < 0.001. Scale bars, 100 μm (A and F) and 50 μm (B, D, and G).
Figure 2
Figure 2
Differential WNT signaling levels regulate DA neuronal subpopulation specification during mESC differentiation (A) Gene expression patterns of WNT signaling components in relation to Sox6 and Lmx1a in the FP of E11.5 mouse embryo. (B) IHC analysis of the midbrain FP of Tcf/Lef::H2B-GFP reporter mouse line at E11.5. Reporter activation is visualized by GFP expression. (C) Percentage GFP+ DA neuronal progenitors expressing either SOX6 or OTX2 in the Tcf/Lef::H2B-GFP reporter mouse line. Mean values ± SD; unpaired t test; n = 3 independent experiments. (D) qPCR analysis of Axin2 and Otx2 expression levels in NesE-Lmx1a ESC-derived neural progenitors at day 1 and day 2 of stage IV. n = 5 independent experiments; mean values ± SEM; two-way ANOVA with Bonferroni correction; n.s., not significant. (E) Experimental design differentiation protocol. IHC analysis of NesE-Lmx1a ESC DA cultures (stage V). (F) DA marker analysis of NesE-Lmx1a mESC-derived cultures differentiated according the 5-stage protocol (stage V) and treated with 1.5 μM IWP2. (G) Percentages of TH+ neurons expressing the indicated markers in NesE-Lmx1a ESC-derived cultures (stage V) differentiated as described in (E). Mean values ± SD; unpaired t test; n = 3 independent experiments. (H) Scheme of differentiation protocol. Immunohistochemical analysis of control and CHIR-treated cultures (stage V). (I) Percentages of TH+ neurons expressing indicated markers differentiated as described in (H). Mean values ± SD; unpaired t test; n = 3 independent experiments. p < 0.05, ∗∗p < 0.01, ∗∗∗p < 0.001. Scale bars, 50 μm.
Figure 3
Figure 3
Modulation of WNT signaling affects the sensitivity of neurons to mitochondrial toxins (A) Diagram presenting the mESC differentiation conditions. (B and C) (B) Analysis of TH in relation to DAPI in cultures differentiated according the 5-stage protocol and (C) the medial FP protocol. (D) Graph showing the percentage of TH-expressing neurons in relation to DAPI. Mean values ± SD; two-way ANOVA with Bonferroni correction; n = 3 independent experiments. (E and F) (E) IHC analysis of cultures differentiated according the 5-stage protocol and (F) the medial FP protocol. Arrows point to cCASP3+ TH+-labeled neurons. (G and H) (G) IHC analysis of cultures differentiated according the 5-stage protocol and (H) the medial FP protocol. Arrows point to cCASP3+ SOX6+-labeled neurons. Arrowheads indicate OTX2+ neurons negatively labeled for cCASP3. (IK) Graphs showing (I) the percentage of cCASP3 in relation to TH, (J) the percentage cCASP3-expressing cells in relation to SOX6, and (K) the percentage cCASP3-expressing cells in relation to OTX2 under various culture conditions. Mean values ± SD; two-way ANOVA with Bonferroni correction; n = 3 independent experiments. p < 0.05, ∗∗p < 0.01, ∗∗∗p < 0.001. Scale bars, 50 μm.
Figure 4
Figure 4
WNT inhibition induces SOX6 in hESC-derived DA neurons and confers sensitivity to mitochondrial toxins (A) IHC analysis of the human fetal brain. (B) Percentage of SN and VTA DA neurons expressing either SOX6 or OTX2 in the human fetal midbrain. (C) Expression of SOX6 and OTX2 in hESC-derived TH-positive neurons. (D) Schematic overview depicting hESC differentiation conditions. CHIR (CHIR from day 4 to day 13), control (CHIR from day 4 to day 11), and IWP2 (IWP2 from day 11 until day 16). (E) Analysis of FP markers in human embryo (cs16). Arrowheads indicate overlap of SOX6 and LMX1A expression. Dashed lines indicate medial/lateral division within progenitor domain. (F) IHC analysis of hESC-derived cultures (day 25). Arrows point to OTX2+/TH+-labeled neurons in CHIR and control cultures and SOX6+/TH+-labeled neurons in IWP2-treated cultures. Differentiation conditions as described in (D). (G) Percentage of TH+ neurons expressing SOX6 or OTX2 differentiated as described in (D). Mean values ± SD; one-way ANOVA with Bonferroni correction; n = 4 independent experiments. (H) Analysis of SOX6 and TH expression in hESC-derived cultures treated with rotenone for 48 h at day 35. (I) Percentage of TH+ neurons after treatment with either dimethyl sulfoxide (DMSO) or rotenone for 48 h at day 35 differentiated as described in (C). Mean values ± SD; paired t test; n = 3 independent experiments. (J) Percentage of SOX6 or OTX2 expressing TH+ neurons differentiated in the presence of IWP2 and treated with either DMSO or rotenone (100 nM) for 48 h at day 35. Mean values ± SD; paired t test; n = 3 independent experiments. (K) Relative levels of TH expression in toxin-treated neurons compared with untreated (normalized to 1). Mean values ± SD; one-way ANOVA with Bonferroni correction; n = 3 independent experiments. p < 0.05, ∗∗p < 0.01, ∗∗∗p < 0.001. Scale bars, 200 μm (A), 100 μm (E), and 50 μm (C, F, and I).
Figure 5
Figure 5
Induction of DA-subpopulation-specific markers in dopaminergic cultures transduced with L-SOX6 and L-OTX2 (A) IHC analysis of coronal sections of the human embryonic midbrain. Arrows indicate OTX2+ DA neurons, while arrowheads point to SOX6+ DA neurons. Higher-magnification images are from the regions indicated by a dashed square. (B) Schematic overview of differentiation conditions. Arrow indicates time point of lentiviral transduction. (C) IHC analysis of day-35 lentiviral transduced cultures. (D) IHC analysis of lentivirus transduced cultures (day 35). Arrowheads indicate overlap between CALB1 and OTX2. (E) IHC analysis of lentivirus transduced cultures at day 35. Arrowheads indicate overlap between GIRK2 and SOX6. (F) Graph showing percentage of TH+ neurons expressing indicated markers at day 35. Mean ± SD; one-way ANOVA with Bonferroni correction; n = 3 independent experiments. p < 0.05, ∗∗p < 0.01. Scale bars, 100 μm.
Figure 6
Figure 6
L-Sox6 transduced dopaminergic neurons display increased sensitivity to rotenone (A) IHC analysis of lentiviral transduced cultures treated with rotenone at day 35 for 24 h. Arrowheads indicate cCASP3-expressing cells. (B) Immunohistochemical analysis shows loss of SOX6 expression (arrowheads) and increase in cCASP3 (arrows) expression in L-SOX6 transduced cultures upon rotenone treatment. (C) Graph displaying % percentage of CASP3+/DAPI+ in virus transduced control and 50 nM rotenone (24 h)-treated cultures at day 35. Mean ± SD; one-way ANOVA with Bonferroni correction; n = 3. (D) Relative ATP levels in rotenone-treated cultures (24 h, day 35) as a percentage of the untreated cultures. Mean ± SD; one-way ANOVA with Bonferroni correction; n = 4 independent experiments. (E) qPCR analysis of TH expression in rotenone-treated (24 h, day 35) virus transduced cultures compared with untreated cultures (normalized to 1). Mean ± SD; one-way ANOVA with Bonferroni correction; n = 4 independent experiments. (F) qPCR analysis of SOX6 and OTX2 expression in rotenone-treated (24 h, day 35) virus transduced cultures compared with untreated cultures (normalized to 1). Mean ± SD; unpaired t test; n = 4 independent experiments. p < 0.05, ∗∗p < 0.01. Scale bars, 50 μm.
Figure 7
Figure 7
SOX6-mediated induction of metabolic pathways provides protection of neurons to mitochondrial toxicity (A) Proteins differentially expressed between L-SOX6 (red bars) and L-OTX2 (blue bars) transduced hESC-derived cultures (day 35). Expression levels are presented as log2 transformed fold change (FC) values. (B) Graph indicates pathways significantly enriched in L-SOX6 and L-OTX2 transduced cultures. (C) IHC analysis of L-SOX6 transduced hESC-derived cultures treated as indicated for 24 h at day 35. Arrows indicate cCASP3-labeled SOX6- and TH-expressing neurons. (D) Relative ATP levels in rotenone- and 6PG-treated cultures (24 h, day 35) as a percentage of the untreated cultures. Mean ± SD; one-way ANOVA with Bonferroni correction; n = 4 independent experiments. (E) Percentage of cCASP3-, SOX6-, and TH-expressing cells in hESC-derived L-SOX6 transduced cultures treated with rotenone and meclizine (24 h, day 35). Mean ± SD; one-way ANOVA with Bonferroni correction; n = 4 independent experiments. (F) mESC differentiation scheme. IHC analysis of Nes-Lmx1a mESC-derived cultures. Arrows indicate overlap between cCASP3 and TH. (G) Percentage of TH+ neurons present in mESC medial FP-derived cultures. Control value normalized to 100. Mean ± SD; one-way ANOVA with Bonferroni correction; n = 4 independent experiments. (H) Model illustrating DA sublineage selection process during mouse and human PSC differentiation and its consequences on vulnerability. p < 0.05, ∗∗p < 0.01, ∗∗∗p < 0.001. Scale bars, 50 μm.

References

    1. Anderegg A., Poulin J.F., Awatramani R. Molecular heterogeneity of midbrain dopaminergic neurons—moving toward single cell resolution. FEBS Lett. 2015;589:3714–3726. - PMC - PubMed
    1. Au E., Ahmed T., Karayannis T., Biswas S., Gan L., Fishell G. A modular gain-of-function approach to generate cortical interneuron subtypes from ES cells. Neuron. 2013;80:1145–1158. - PMC - PubMed
    1. Blaess S., Bodea G.O., Kabanova A., Chanet S., Mugniery E., Derouiche A., Stephen D., Joyner A.L. Temporal-spatial changes in Sonic Hedgehog expression and signaling reveal different potentials of ventral mesencephalic progenitors to populate distinct ventral midbrain nuclei. Neural Dev. 2011;6:29. - PMC - PubMed
    1. Blum M. A null mutation in TGF-alpha leads to a reduction in midbrain dopaminergic neurons in the substantia nigra. Nat. Neurosci. 1998;1:374–377. - PubMed
    1. Bolam J.P., Pissadaki E.K. Living on the edge with too many mouths to feed: why dopamine neurons die. Mov. Disord. 2012;27:1478–1483. - PMC - PubMed

Publication types

MeSH terms

Substances