

A new platform for high-throughput therapy testing on iPSC-derived lung progenitor cells from cystic fibrosis patients
- PMID: 34678210
- PMCID: PMC8581165
- DOI: 10.1016/j.stemcr.2021.09.020
A new platform for high-throughput therapy testing on iPSC-derived lung progenitor cells from cystic fibrosis patients
Abstract
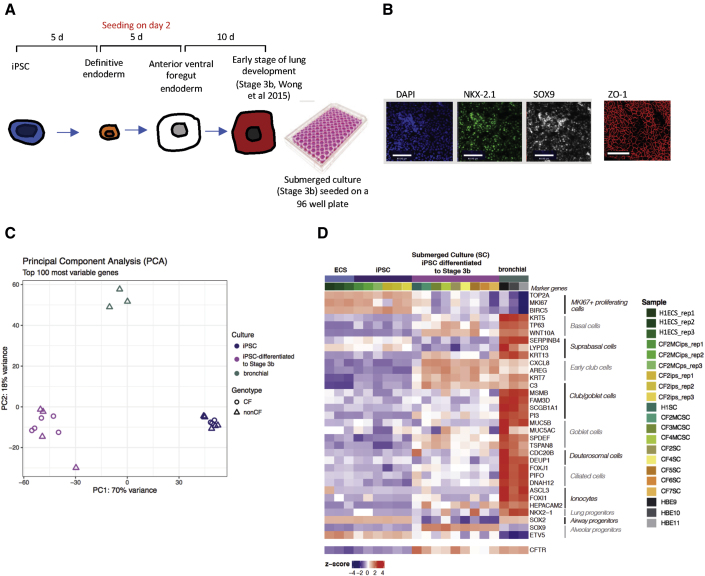
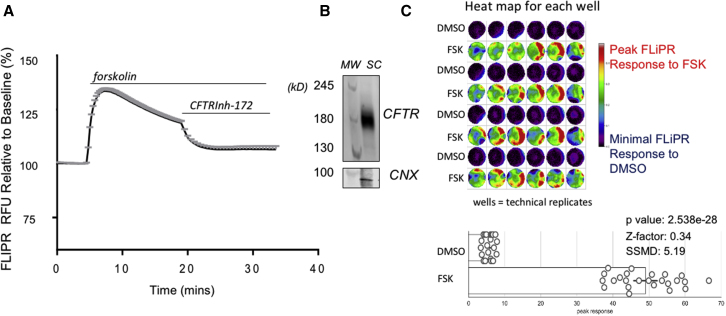
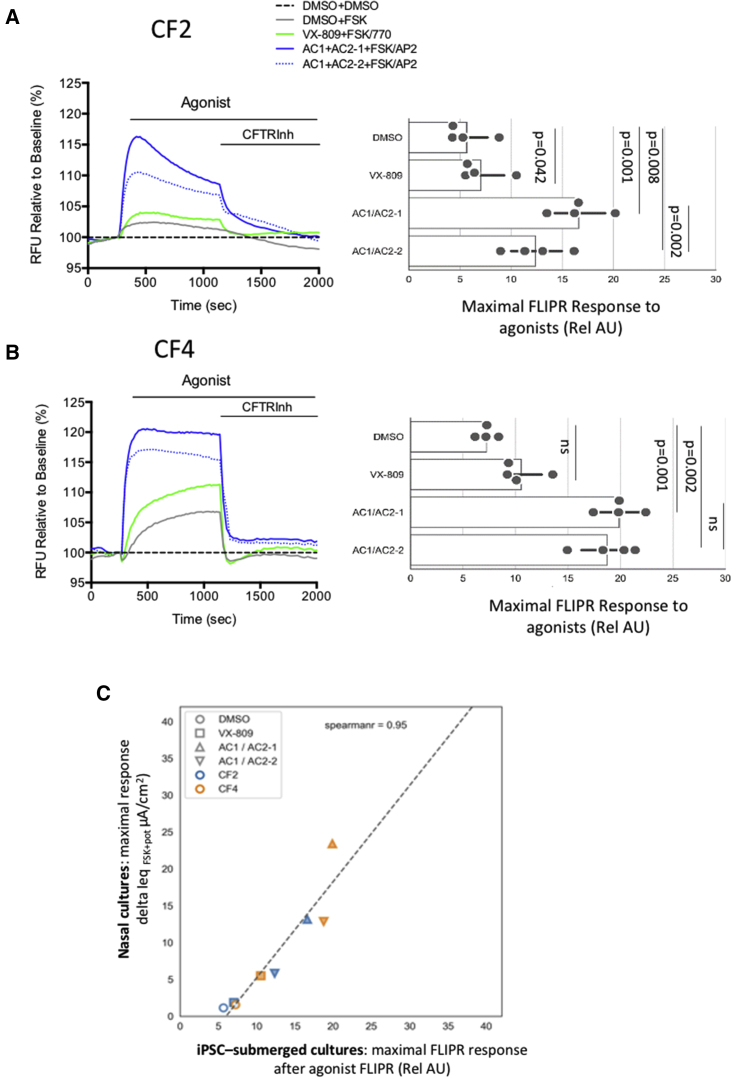
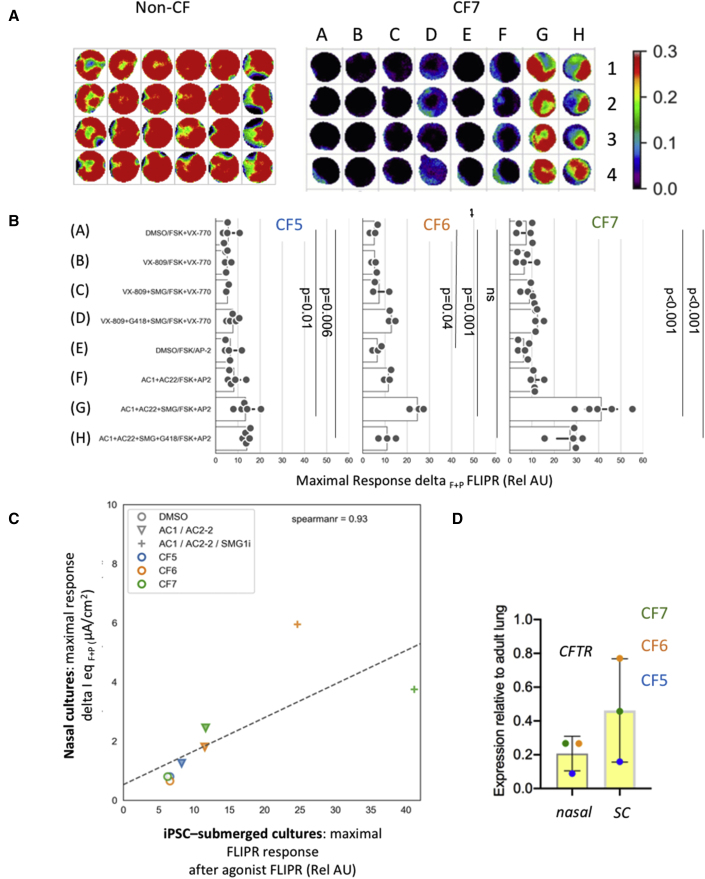
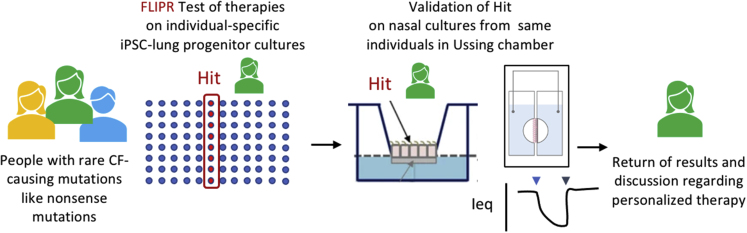
For those people with cystic fibrosis carrying rare CFTR mutations not responding to currently available therapies, there is an unmet need for relevant tissue models for therapy development. Here, we describe a new testing platform that employs patient-specific induced pluripotent stem cells (iPSCs) differentiated to lung progenitor cells that can be studied using a dynamic, high-throughput fluorescence-based assay of CFTR channel activity. Our proof-of-concept studies support the potential use of this platform, together with a Canadian bioresource that contains iPSC lines and matched nasal cultures from people with rare mutations, to advance patient-oriented therapy development. Interventions identified in the high-throughput, stem cell-based model and validated in primary nasal cultures from the same person have the potential to be advanced as therapies.
Keywords: CF-causing nonsense mutations; apical chloride conductance assay; complementary assays of primary and iPSC derived tissues; high-throughput phenotypic platform; pluripotent stem cells; precision medicine; therapy testing.
Copyright © 2021 The Authors. Published by Elsevier Inc. All rights reserved.
Figures
Similar articles
-
Modeling Cystic Fibrosis Using Pluripotent Stem Cell-Derived Human Pancreatic Ductal Epithelial Cells.Stem Cells Transl Med. 2016 May;5(5):572-9. doi: 10.5966/sctm.2015-0276. Epub 2016 Mar 31. Stem Cells Transl Med. 2016. PMID: 27034411 Free PMC article.
-
Testing organ-specific responses to therapies in tissues differentiated from Cystic Fibrosis patient derived iPSCs.Stem Cell Res. 2025 Mar;83:103653. doi: 10.1016/j.scr.2025.103653. Epub 2025 Jan 6. Stem Cell Res. 2025. PMID: 39793274
-
Targeted correction and restored function of the CFTR gene in cystic fibrosis induced pluripotent stem cells.Stem Cell Reports. 2015 Apr 14;4(4):569-77. doi: 10.1016/j.stemcr.2015.02.005. Epub 2015 Mar 12. Stem Cell Reports. 2015. PMID: 25772471 Free PMC article.
-
Induced pluripotent stem cells for treating cystic fibrosis: State of the science.Pediatr Pulmonol. 2018 Nov;53(S3):S12-S29. doi: 10.1002/ppul.24118. Epub 2018 Jul 30. Pediatr Pulmonol. 2018. PMID: 30062693 Review.
-
Personalized medicine for cystic fibrosis: establishing human model systems.Pediatr Pulmonol. 2015 Oct;50 Suppl 40:S14-23. doi: 10.1002/ppul.23233. Pediatr Pulmonol. 2015. PMID: 26335952 Review.
Cited by
-
Early human fetal lung atlas reveals the temporal dynamics of epithelial cell plasticity.Nat Commun. 2024 Jul 13;15(1):5898. doi: 10.1038/s41467-024-50281-5. Nat Commun. 2024. PMID: 39003323 Free PMC article.
-
Primary Ciliary Dyskinesia Patient-Specific hiPSC-Derived Airway Epithelium in Air-Liquid Interface Culture Recapitulates Disease Specific Phenotypes In Vitro.Cells. 2023 May 24;12(11):1467. doi: 10.3390/cells12111467. Cells. 2023. PMID: 37296588 Free PMC article.
-
Established and novel human translational models to advance cystic fibrosis research, drug discovery, and optimize CFTR-targeting therapeutics.Curr Opin Pharmacol. 2022 Jun;64:102210. doi: 10.1016/j.coph.2022.102210. Epub 2022 Apr 21. Curr Opin Pharmacol. 2022. PMID: 35462105 Free PMC article. Review.
-
Bridging systems biology and tissue engineering: Unleashing the full potential of complex 3D in vitro tissue models of disease.Biophys Rev (Melville). 2024 Apr 10;5(2):021301. doi: 10.1063/5.0179125. eCollection 2024 Jun. Biophys Rev (Melville). 2024. PMID: 38617201 Free PMC article. Review.
-
A multidisciplinary approach towards modeling of a virtual human lung.NPJ Syst Biol Appl. 2025 Apr 18;11(1):38. doi: 10.1038/s41540-025-00517-x. NPJ Syst Biol Appl. 2025. PMID: 40251169 Free PMC article. Review.
References
-
- Awatade N.T., Wong S.L., Capraro A., Pandzic E., Slapetova I., Zhong L., Turgutoglu N., Fawcett L.K., Whan R.M., Jaffe A., et al. Significant functional differences in differentiated Conditionally Reprogrammed (CRC)- and Feeder-free Dual SMAD inhibited-expanded human nasal epithelial cells. J. Cyst Fibros. 2021;20:364–371. - PubMed
-
- Berkers G., van Mourik P., Vonk A.M., Kruisselbrink E., Dekkers J.F., de Winter-de Groot K.M., Arets H.G.M., Marck-van der Wilt R.E.P., Dijkema J.S., Vanderschuren M.M., et al. Rectal organoids enable personalized treatment of cystic fibrosis. Cell Rep. 2019;26:1701–1708.e1703. - PubMed
-
- Cao H., Ouyang H., Laselva O., Bartlett C., Zhou Z.P., Duan C., Gunawardena T., Avolio J., Bear C.E., Gonska T., et al. A helper-dependent adenoviral vector rescues CFTR to wild-type functional levels in cystic fibrosis epithelial cells harbouring class I mutations. Eur. Respir. J. 2020;56:5. - PubMed
Publication types
MeSH terms
Substances
LinkOut - more resources
Full Text Sources
Medical
