. 2021 Dec 1:286:120067.
doi: 10.1016/j.lfs.2021.120067. Epub 2021 Oct 19.

Enhanced pro-BDNF-p75NTR pathway activity in denervated skeletal muscle

Affiliations

Enhanced pro-BDNF-p75NTR pathway activity in denervated skeletal muscle

Katherine Aby et al. Life Sci. .

Abstract

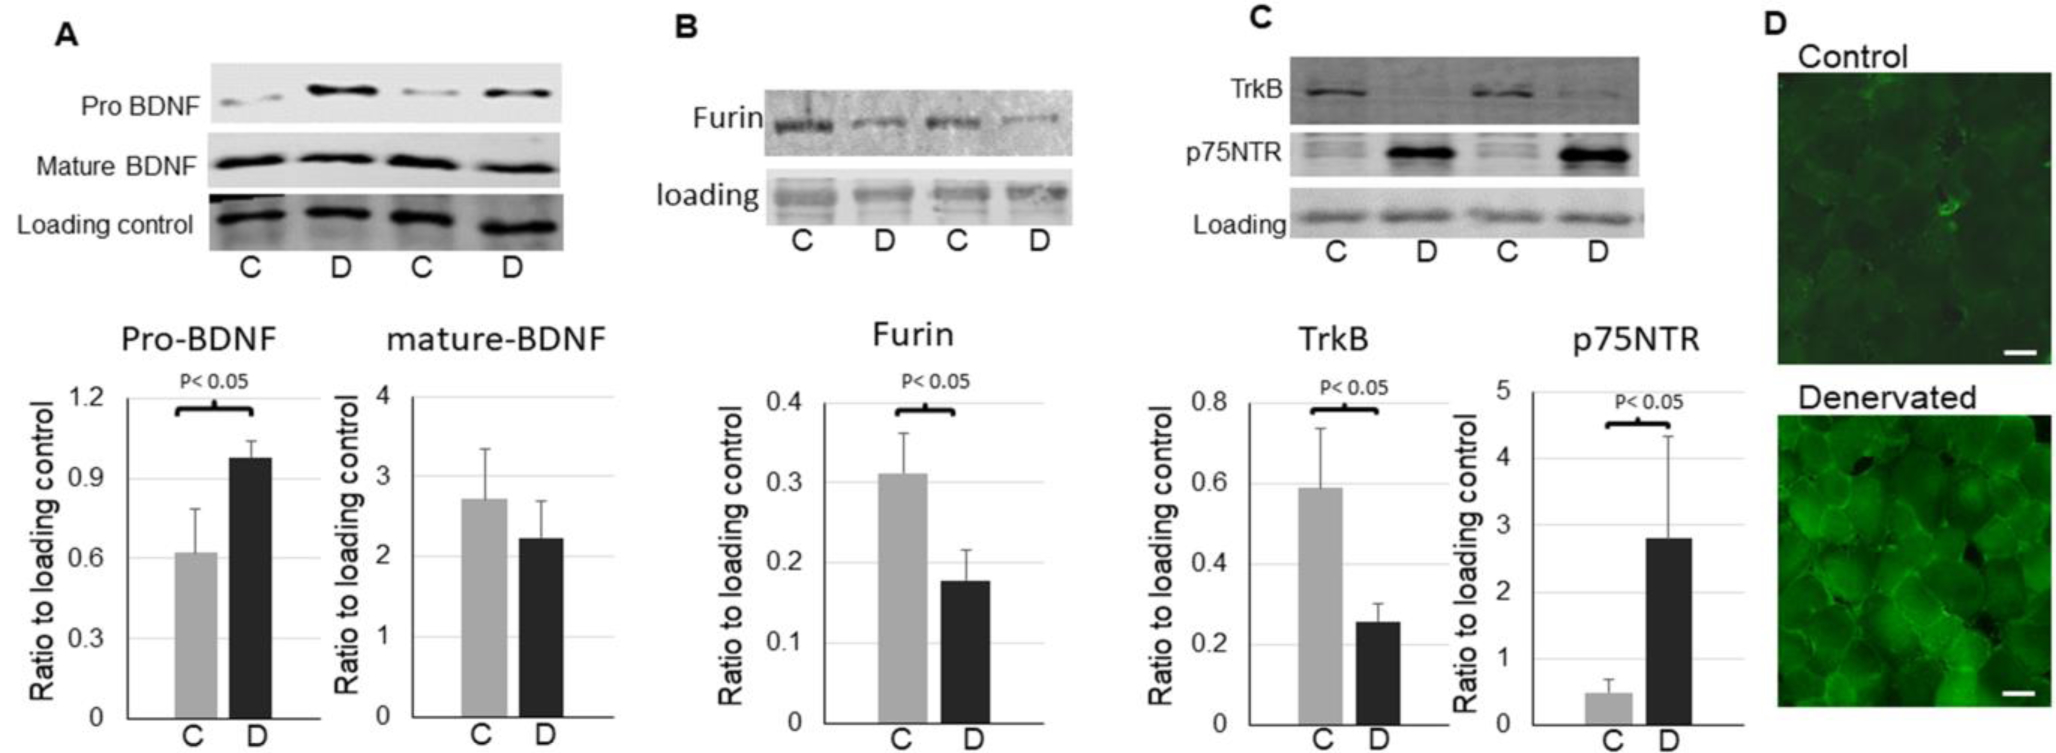
Aims: Brain derived neurotrophic factor (BDNF) and the related receptors TrkB and p75NTR are expressed in skeletal muscle, yet their functions remain to be fully understood. Skeletal muscle denervation, which occurs in spinal injury, peripheral neuropathies, and aging, negatively affects muscle mass and function. In this study, we wanted to understand the role of BDNF, TrkB, and p75NTR in denervation-induced adverse effects on skeletal muscle.

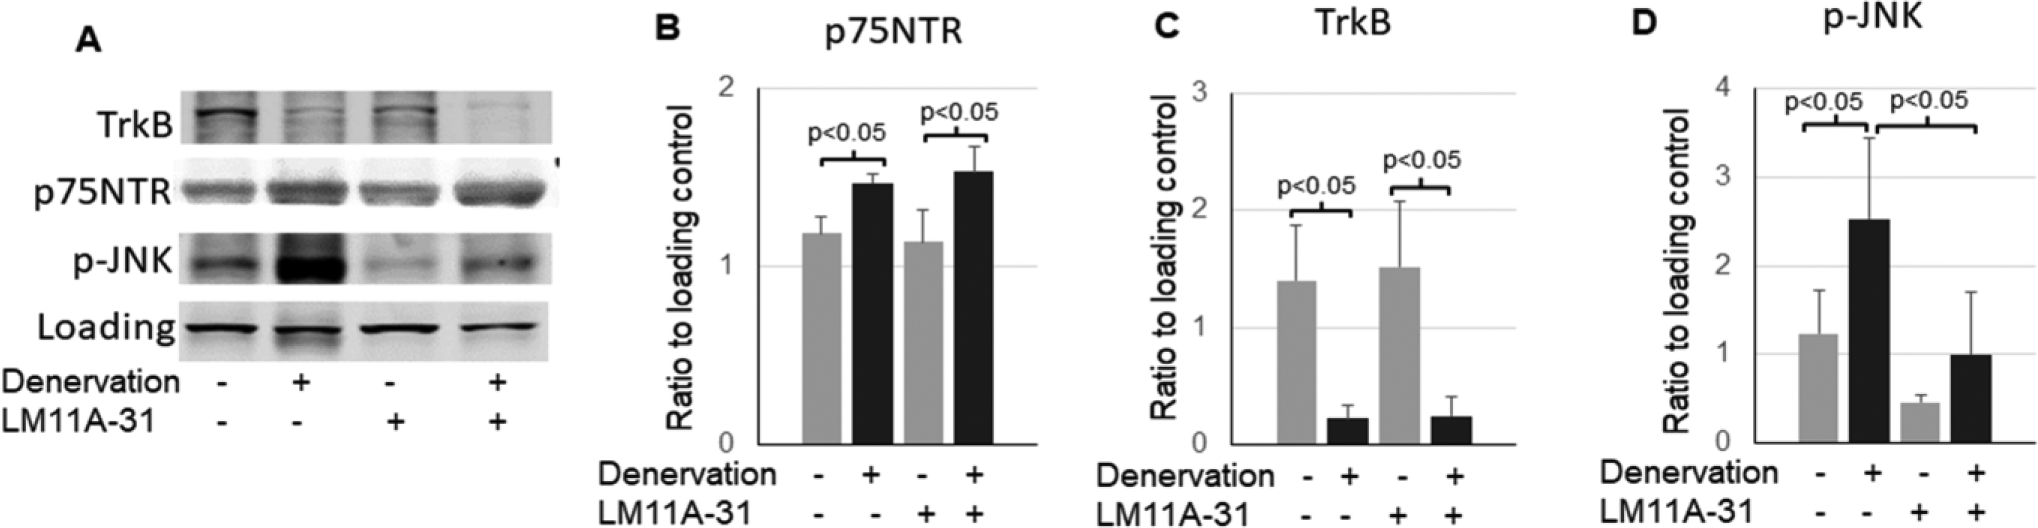
Main methods: Mice with unilateral sciatic denervation were used. Protein levels of pro- and mature BDNF, TrkB, p75NTR, activations of their downstream signaling pathways, and inflammation in the control and denervated muscle were measured with Western blot and tissue staining. Treatment with a p75NTR inhibitor and BDNF skeletal muscle specific knockout in mice were used to examine the role of p75NTR and pro-BDNF.

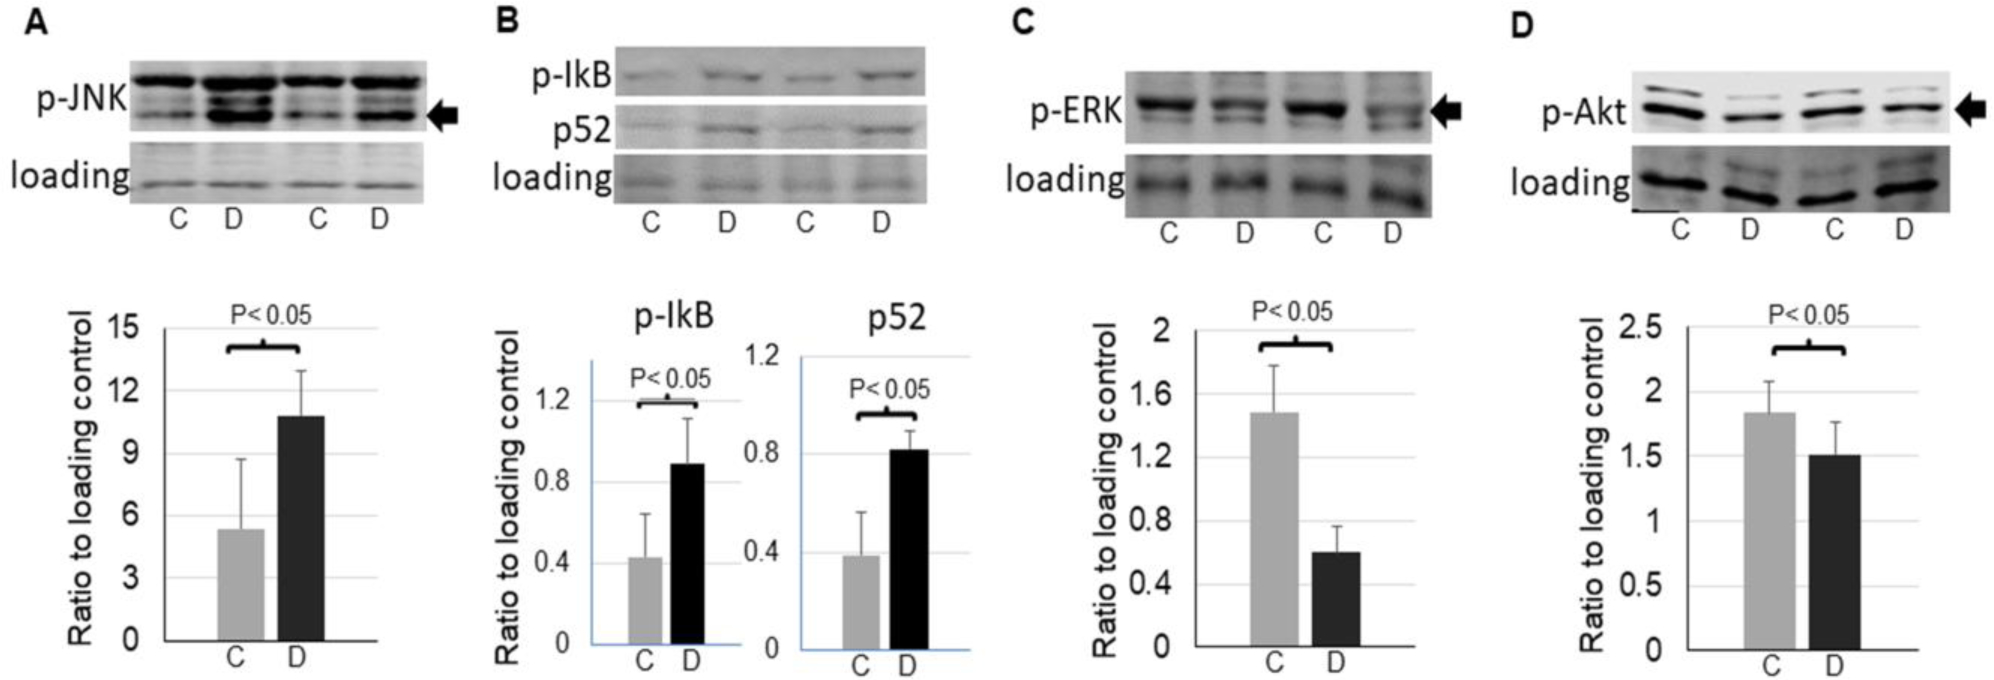
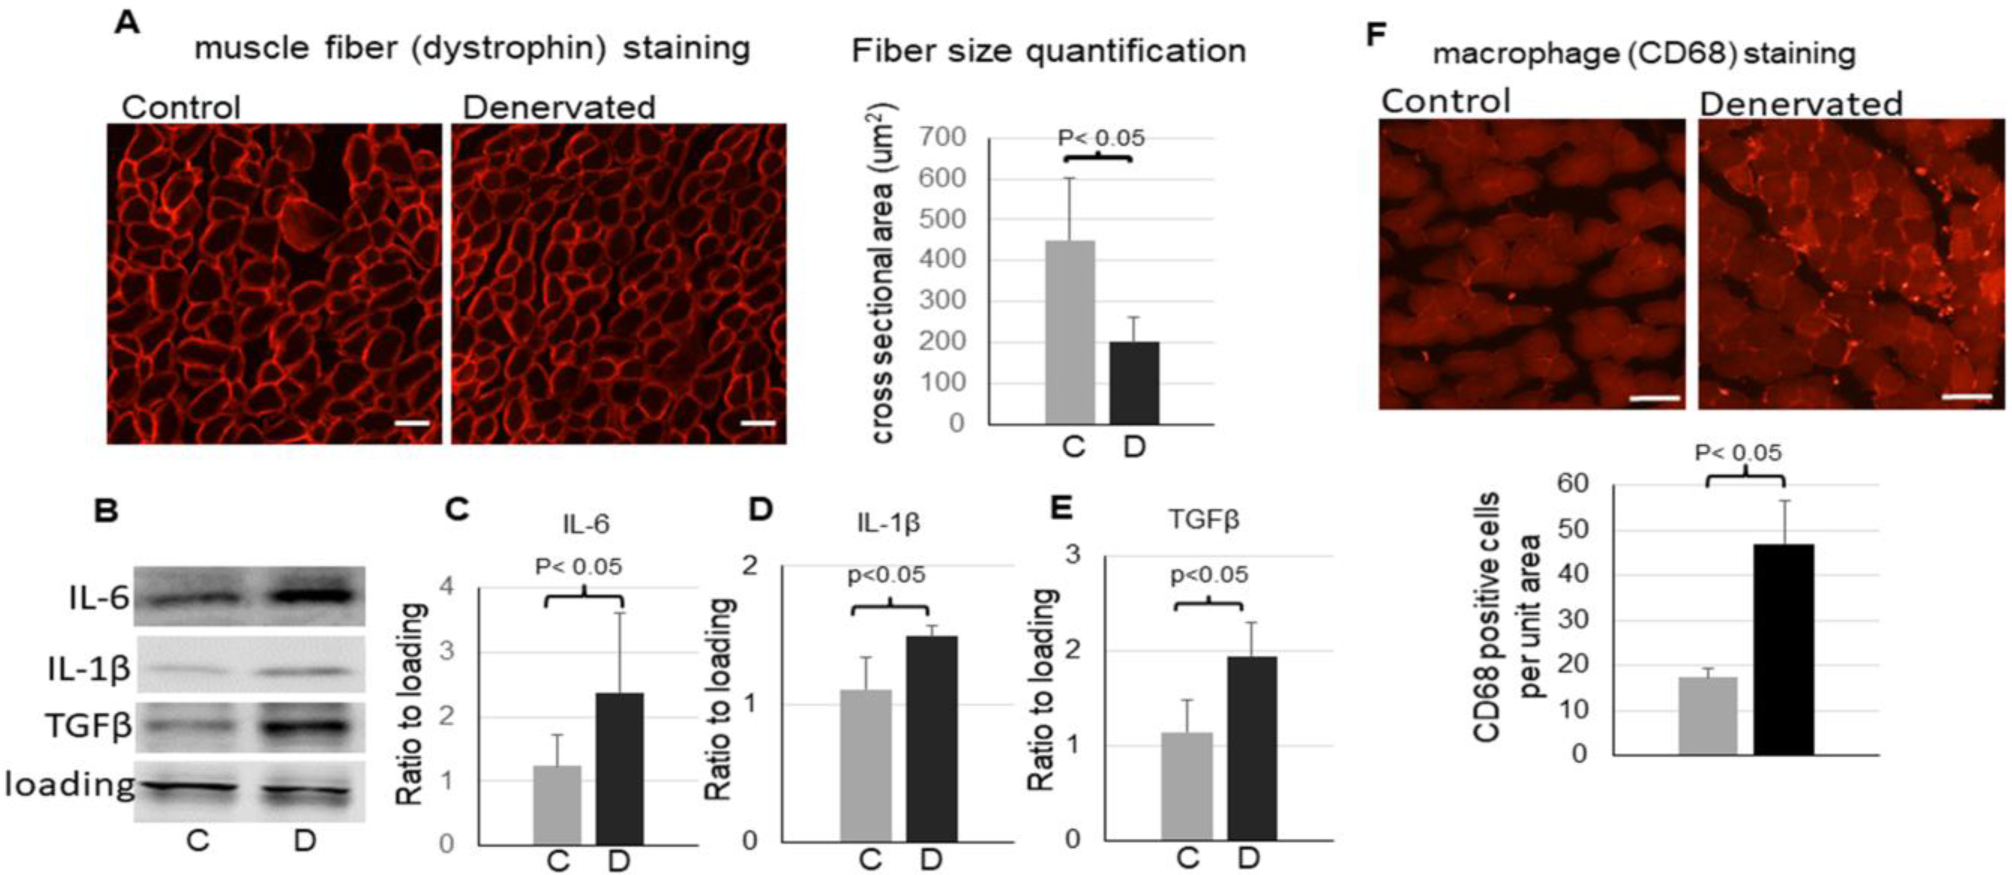
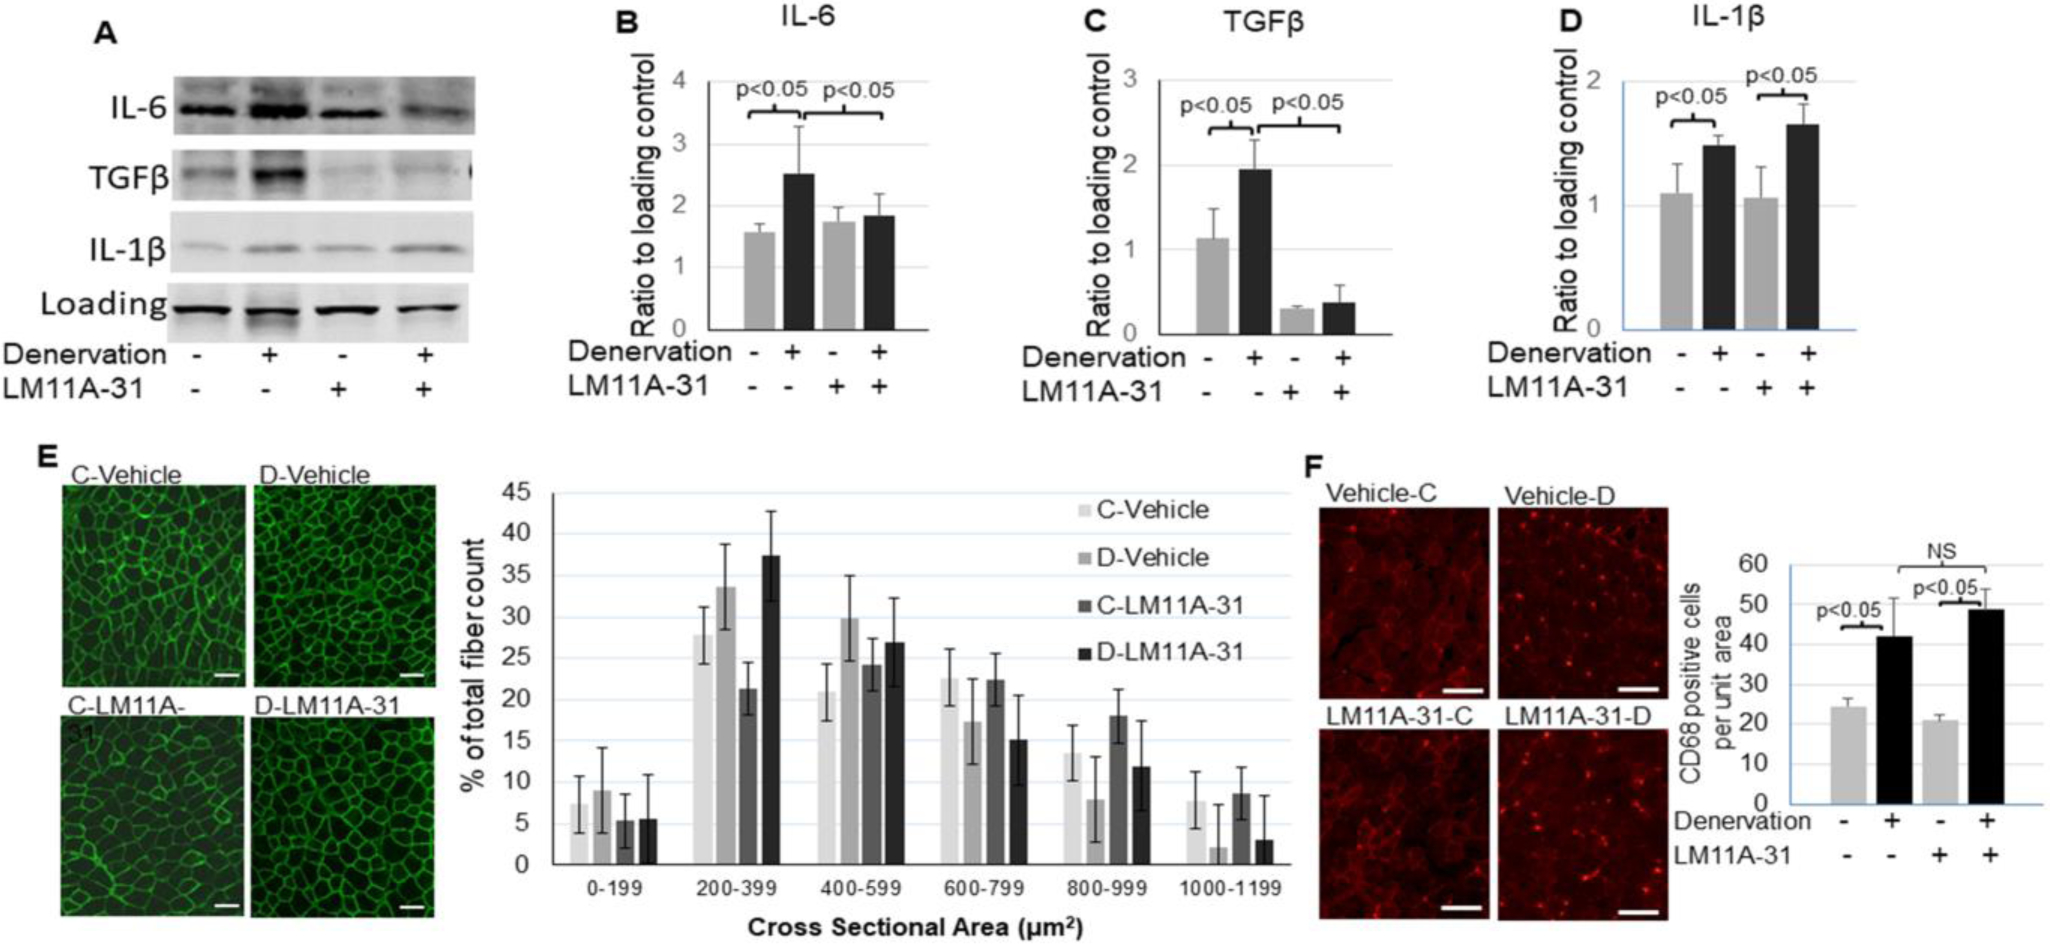
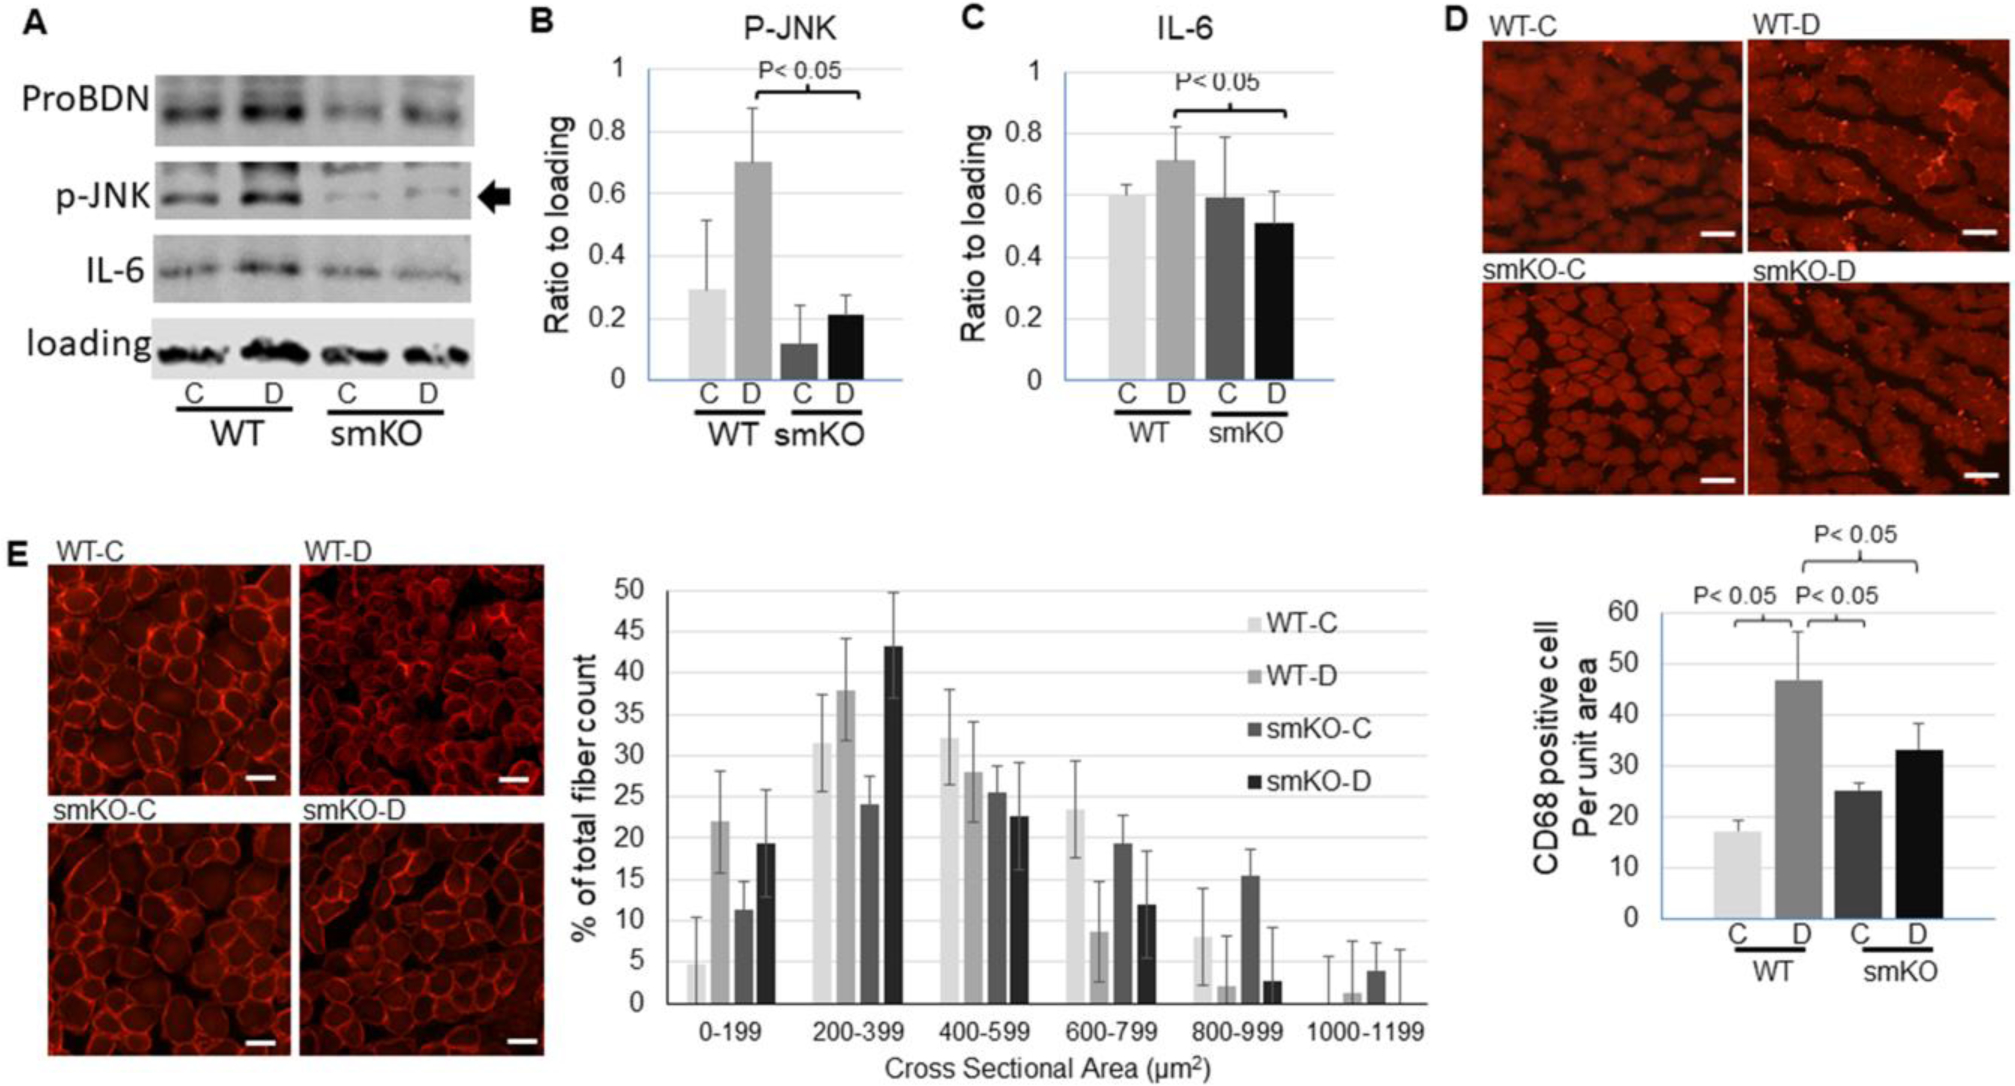
Key findings: In denervated muscle, pro-BDNF and p75NTR were significantly upregulated, and JNK and NF-kB, two major downstream signaling pathways of p75NTR, were activated, along with muscle atrophy and inflammation. Inhibition of p75NTR using LM11A-31 significantly reduced JNK activation and inflammatory cytokines in the denervated muscle. Moreover, skeletal muscle specific knockout of BDNF reduced pro-BDNF level, JNK activation and inflammation in the denervated muscle.

Significance: These results reveal for the first time that the upregulation of pro-BDNF and activation of p75NTR pathway are involved in denervation-induced inflammation in skeletal muscle. The results suggest that inhibition of pro-BDNF-p75NTR pathway can be a new target to treat skeletal muscle inflammation.

Keywords: BDNF; Denervation; Inflammation; Myokine; p75NTR.


Conflict of interest statement

Conflict of interest

The authors declare no conflict of interest related to this study.

Figures

Figure 1,
Figure 1,
Upregulation of pro-BDNF and p75NTR in denervated skeletal muscle. A: representative images and quantifications of pro-BDNF and mature BDNF in the control and denervated muscle (n=6). B: representative images and quantifications of furin in the control and denervated muscle (n=5). C: representative images and quantifications of TrkB and p75NTR in the control and denervated muscle (n=6). D: Immunofluorescent staining for p75NTR in the control and denervated muscle (scale bar = 20 μm, 20x objective). The label “C”=control, “D”=denervated. Data is represented as means ± S.D. analyzed by student’s t-tests.
Figure 2,
Figure 2,
Alterations of signaling pathways in the control and denervated muscle. A: representative images and quantifications of phosphorylation of JNK (54 kDa band, as indicated by an arrow) in the control and denervated muscle (n=5). B: representative images and quantifications of IkB phosphorylation and p52 in the control and denervated muscle (n=5). C: representative images and quantifications of phosphorylation of ERK (44 kDa band as indicated by an arrow) in the control and denervated muscle (n=5). D: representative images of quantifications of phosphorylation of Akt (60 kDa as indicated by an arrow) in the control and denervated muscle (n=6). Data is represented as means ± S.D. analyzed by student’s t-tests.
Figure 3,
Figure 3,
Inflammation in the denervated muscle. A: representative images of dystrophin immunofluorescent staining (scale bar = 20 μm, 20x objective) and quantification (the bar graph) of muscle fiber cross sectional areas in the control and denervated muscle. B - E: representative images (B) and quantifications of IL-6 (C), IL-1β (D), and TGFβ (E) in the control and denervated muscle (n=3–4). F: representative images of immunofluorescent staining (scale bar = 50 μm, 10x objective) and quantification (bottom bar graph) of macrophage marker CD68 in the control and denervated muscle. Data is represented as means ± S.D. analyzed by student’s t-tests.
Figure 4,
Figure 4,
Inhibition of p75NTR attenuates activation of JNK. A-D: representative of Western blot images (A) and quantifications of TrkB (B), p75NTR (C), and phosphorylation of JNK (54 kDa band) (D) in the control or denervated muscle with or without LM11A-31 treatment (n=4). Data is represented as means ± S.D. analyzed by ANOVA analysis.
Figure 5,
Figure 5,
Inhibition of p75NTR reduced inflammation in denervated muscle. A – D: Representative images (A) and quantifications of IL-6 (B), TGFβ (C), and IL-1β (D) in the control or denervated muscle with or without LM11A-31 treatment (n=3–4). E: Immunofluorescent staining of dystrophin (scale bar = 50 μm, 10x objective) and quantification of muscle fiber cross sectional areas (right bar graph) of the control or denervated muscle with or without LM11A-31 treatment. F: representative images (scale bar = 50 μm, 10x objective) and quantification (right bar graph) of macrophage marker CD68 staining in the control or denervated muscle with or without LM11A-31 treatment. Data is represented as means ± S.D. analyzed by ANOVA analysis (B, C, and D). For (E) quantification, the counts were analyzed in SAS studio using a Chi Square analysis followed by comparisons between groups within each size category with a Bonferroni correction.
Figure 6,
Figure 6,
Skeletal muscle specific knockout (smKO) of BDNF attenuated inflammation in denervated muscle. A: representative images of Western blot for pro-BDNF, phosphorylation of JNK, and IL-6 in control or denervated muscle from WT or BDNF smKO mice. B-C: Quantification of phosphorylation of JNK (B) or IL-6 (C) level in control or denervated muscle from WT or BDNF smKO mice. D: representative images (scale bar = 50 μm, 10x objective) and quantification (bottom bar graph) of immunofluorescent staining of macrophage marker CD68 in control or denervated muscle from WT or BDNF smKO mice. E: Immunofluorescent staining of dystrophin (scale bar = 20 μm, 20x objective) and quantification of muscle fiber cross sectional areas (right bar graph) of the control or denervated muscle from WT or BDNF smKO mice. Data is represented as means ± S.D. analyzed by ANOVA analysis (B and C). For (E) quantification, the counts were analyzed in SAS studio using a Chi Square analysis followed by comparisons between groups within each size category with a Bonferroni correction.

References

    1. Schiaffino S and Reggiani C, Fiber types in mammalian skeletal muscles. Physiol Rev, 2011. 91(4): p. 1447–531. - PubMed
    1. Dutt V, et al., Skeletal muscle atrophy: Potential therapeutic agents and their mechanisms of action. Pharmacol Res, 2015. 99: p. 86–100. - PubMed
    1. Palus S, von Haehling S, and Springer J, Muscle wasting: an overview of recent developments in basic research. Int J Cardiol, 2014. 176(3): p. 640–4. - PubMed
    1. Lang CH, et al., Sepsis and inflammatory insults downregulate IGFBP-5, but not IGFBP-4, in skeletal muscle via a TNF-dependent mechanism. Am J Physiol Regul Integr Comp Physiol, 2006. 290(4): p. R963–72. - PubMed
    1. Degens H and Alway SE, Control of muscle size during disuse, disease, and aging. Int J Sports Med, 2006. 27(2): p. 94–9. - PubMed

MeSH terms