. 2021 Oct 7;9(10):250.
doi: 10.3390/toxics9100250.

Exploring Neurobehaviour in Zebrafish Embryos as a Screening Model for Addictiveness of Substances

Affiliations

Exploring Neurobehaviour in Zebrafish Embryos as a Screening Model for Addictiveness of Substances

Anne Havermans et al. Toxics. .

Abstract

Tobacco use is the leading cause of preventable death worldwide and is highly addictive. Nicotine is the main addictive compound in tobacco, but less is known about other components and additives that may contribute to tobacco addiction. The zebrafish embryo (ZFE) has been shown to be a good model to study the toxic effects of chemicals on the neurological system and thus may be a promising model to study behavioral markers of nicotine effects, which may be predictive for addictiveness. We aimed to develop a testing protocol to study nicotine tolerance in ZFE using a locomotion test with light-dark transitions as behavioral trigger. Behavioral experiments were conducted using three exposure paradigms: (1) Acute exposure to determine nicotine's effect and potency. (2) Pre-treatment with nicotine dose range followed by a single dose of nicotine, to determine which pre-treatment dose is sufficient to affect the potency of acute nicotine. (3) Pre-treatment with a single dose combined with acute exposure to a dose range to confirm the hypothesized decreased potency of the acute nicotine exposure. These exposure paradigms showed that (1) acute nicotine exposure decreased ZFE activity in response to dark conditions in a dose-dependent fashion; (2) pre-treatment with increasing concentrations dose-dependently reversed the effect of acute nicotine exposure; and (3) a fixed pre-treatment dose of nicotine induced a decreased potency of the acute nicotine exposure. This effect supported the induction of tolerance to nicotine by the pre-treatment, likely through neuroadaptation. The interpretation of these effects, particularly in view of prediction of dependence and addictiveness, and suitability of the ZFE model to test for such effects of other compounds than nicotine, are discussed.

Keywords: locomotion behavior; neuroadaptation; nicotine; nicotinic acetylcholine receptor; zebrafish embryo.


Conflict of interest statement

The authors declare no conflict of interest. The funders had no role in the design of the study, in the collection, analyses, or interpretation of data, in the writing of the manuscript, or in the decision to publish the results.

Figures

Figure 1
Figure 1
Intraembryonic nicotine concentrations quantified by LC-MS analysis of 10 pooled embryos per sample. (A) Measurement of absorption at 5, 30, 120, 480 min after start of exposure to 30 µM nicotine (nominal external concentration). A fast increase in the intraembryonic nicotine concentration is observed, with a plateau phase starting at >2 h. (B) Measurement of intraembryonic nicotine concentration at 5, 30, 90, 240, and 480 min after cessation of a 24 h exposure to 30 µM nicotine. Upon cessation of external exposure, the intraembryonic nicotine concentration is cleared fast. Data points represent the average of two independent pooled samples of 10 embryos each.
Figure 2
Figure 2
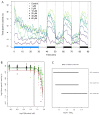
Nicotine exposure concentration-dependently decreases locomotion behavior. (A) Example of ZebraBox output visualized in R (v3.6.3), showing time in activity during 30 min acclimatization (blue bar) and three successive 10 min blocks of light (grey) and dark (black). Each dot represents the average cumulative time in activity in the preceding minute of 12 embryos. (B) Modelled concentration-response curves for the effect of exposure to nicotine on locomotion. Different colors of curves and symbols represent independent experiments. Symbols are the geometric mean of 12 single embryo data (average time in activity per minute), error bars the 90% confidence intervals. Horizontal dashed lines indicate the 50% effect level (CES) per experiment, vertical dashed lines the resulting CED. (C) Confidence intervals (90%) associated with the CEDs from the individual experiments in B.
Figure 3
Figure 3
The effect of a concentration-range nicotine pre-treatment (96–104 hpf) on the effectivity of acute exposure to nicotine (40 µM, 118–120 hpf). The graph indicates that with increasing concentration pre-treatment (x-axis), the level of activity increases, demonstrating the decreased potency of acute exposure to nicotine. Symbols represent the geometric mean of n = 12 single embryo activity data, error bars indicate the 90% confidence interval. CED (intersection dashed lines) is measured at the 50% effect level (CES). Locomotion was analysed directly after acute exposure.
Figure 4
Figure 4
Nicotine pre-treatment reduces the inhibitory effect of acute nicotine exposure on locomotion. (A) Combined analysis of acute exposure (118–120 hpf) dose-response data from three independent experiments following pre-treatment (96–104 hpf) to a single concentration. Proast analysis of the data resulted in overlapping confidence intervals (CI) of CED50 of the three experiments (B), indicating that there are no statistically significant differences between the individual datasets. In B, each pair of CI consists of the CI associated with exponential and Hill models (upper and lower bar, respectively).
Figure 5
Figure 5
(A) Combined analysis of concentration-response data upon acute exposure to nicotine without (black) and with pre-treatment (30 µM; 96–104 hpf; red). Symbols represent the geometric mean of n = 12 embryos, error bars are 90% confidence intervals (CI). CED is measured at the 50% effect level (CES; intersection of dashed lines). (B) 90% Confidence intervals to the CEDs, where each pair of CI consists of the CI associated with exponential and Hill models (upper and lower bar, respectively).

Similar articles

Cited by

References

    1. U.S. Department of Health and Human Services . The Health Consequences of Smoking: 50 Years of Progress. A Report of the Surgeon General. U.S. Department of Health and Human Services, Centers for Disease Control and Prevention, National Center for Chronic Disease Prevention and Health Promotion, Office on Smoking and Health; Atlanta, GA, USA: 2014.
    1. World Health Organization (WHO) WHO Report on the Global Tobacco Epidemic: Addressing New and Emerging Products. World Health Organization (WHO); Geneva, Switzerland: 2021.
    1. Hughes J.R., Keely J., Naud S. Shape of the relapse curve and long-term abstinence among untreated smokers. Addiction. 2004;99:29–38. doi: 10.1111/j.1360-0443.2004.00540.x. - DOI - PubMed
    1. Ursprung W.W.S.A., DiFranza J.R. The loss of autonomy over smoking in relation to lifetime cigarette consumption. Addict. Behav. 2010;35:14–18. doi: 10.1016/j.addbeh.2009.08.001. - DOI - PubMed
    1. van de Nobelen S., Kienhuis A.S., Talhout R. An Inventory of Methods for the Assessment of Additive Increased Addictiveness of Tobacco Products: Table 1. Nicotine Tob. Res. 2016;18:1546–1555. doi: 10.1093/ntr/ntw002. - DOI - PMC - PubMed

LinkOut - more resources