

Cytotoxicity Effect of Quinoin, Type 1 Ribosome-Inactivating Protein from Quinoa Seeds, on Glioblastoma Cells
- PMID: 34678977
- PMCID: PMC8537469
- DOI: 10.3390/toxins13100684
Cytotoxicity Effect of Quinoin, Type 1 Ribosome-Inactivating Protein from Quinoa Seeds, on Glioblastoma Cells
Abstract
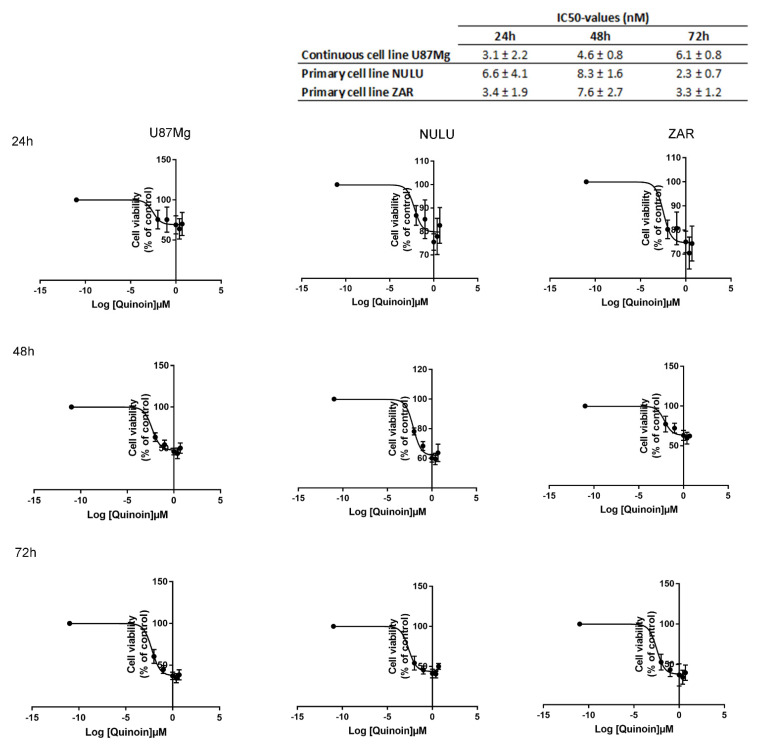
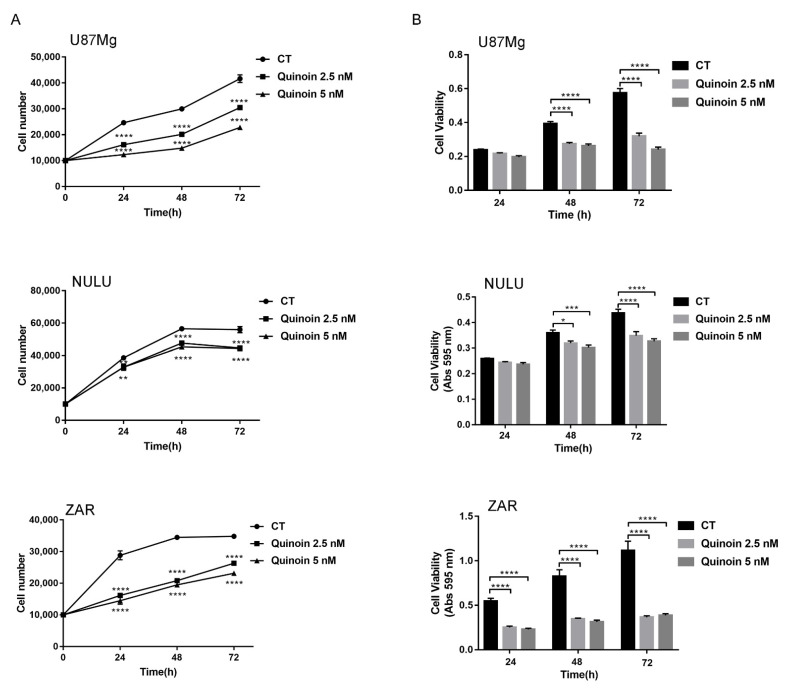
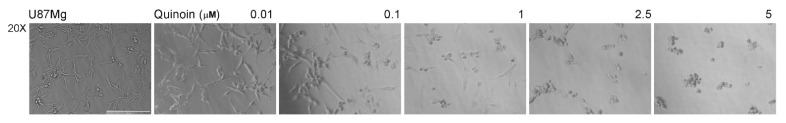
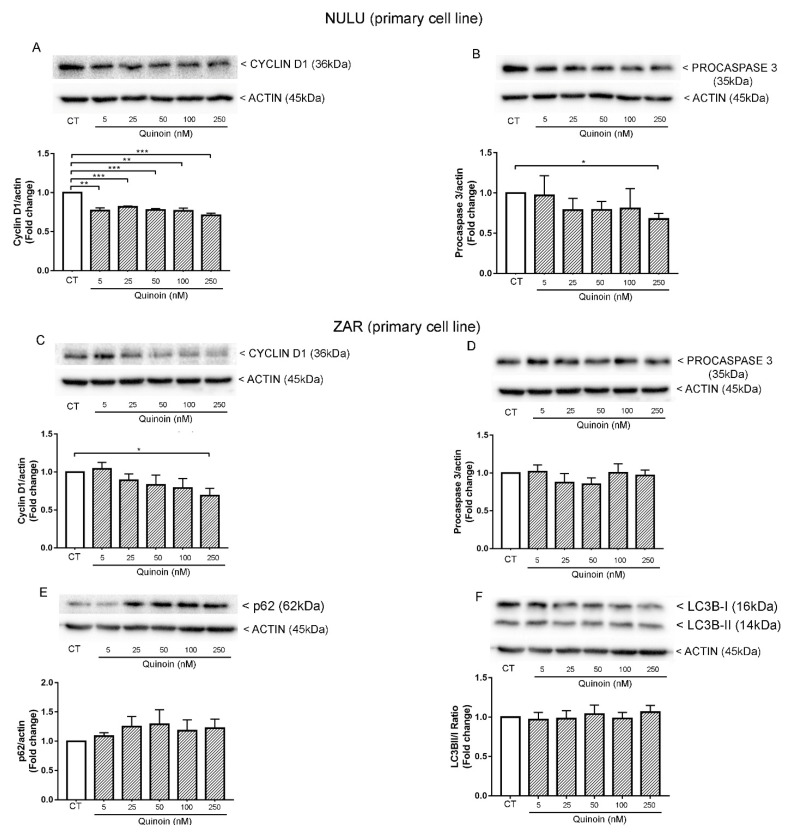
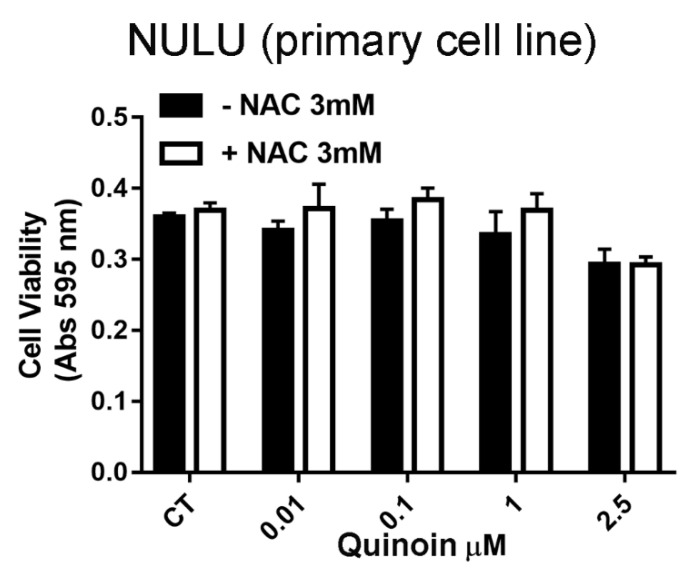
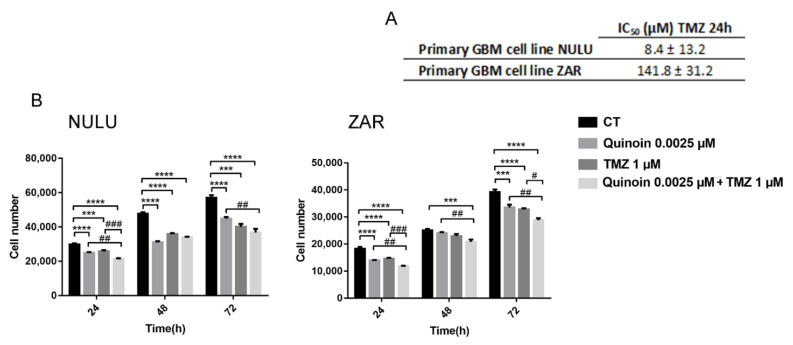
Ribosome-inactivating proteins (RIPs) are found in several edible plants and are well characterized. Many studies highlight their use in cancer therapy, alone or as immunoconjugates, linked to monoclonal antibodies directed against target cancer cells. In this context, we investigate the cytotoxicity of quinoin, a novel type 1 RIP from quinoa seeds, on human continuous and primary glioblastoma cell lines. The cytotoxic effect of quinoin was assayed on human continuous glioblastoma U87Mg cells. Moreover, considering that common conventional glioblastoma multiforme (GBM) cell lines are genetically different from the tumors from which they derive, the cytotoxicity of quinoin was subsequently tested towards primary cells NULU and ZAR (two cell lines established from patients' gliomas), also in combination with the chemotherapeutic agent temozolomide (TMZ), currently used in glioblastoma treatment. The present study demonstrated that quinoin (2.5 and 5.0 nM) strongly reduced glioblastoma cells' growth. The mechanisms responsible for the inhibitory action of quinoin are different in the tested primary cell lines, reproducing the heterogeneous response of glioblastoma cells. Interestingly, primary cells treated with quinoin in combination with TMZ were more sensitive to the treatment. Overall, our data highlight that quinoin could represent a novel tool for glioblastoma therapy and a possible adjuvant for the treatment of the disease in combination with TMZ, alone or as possible immunoconjugates/nanoconstructs.
Keywords: Chenopodium quinoa wild; patient-derived glioblastoma cell lines; quinoin; ribosome-inactivating proteins; temozolomide.
Conflict of interest statement
The authors declare no conflict of interest.
Figures
Similar articles
-
The Structural Characterization and Antipathogenic Activities of Quinoin, a Type 1 Ribosome-Inactivating Protein from Quinoa Seeds.Int J Mol Sci. 2021 Aug 20;22(16):8964. doi: 10.3390/ijms22168964. Int J Mol Sci. 2021. PMID: 34445686 Free PMC article.
-
Genotoxicity Assessment of Quinoin, a Ribosome Inactivating Protein from Quinoa Seeds, in the Teleost Danio rerio.Front Biosci (Landmark Ed). 2024 Feb 4;29(2):51. doi: 10.31083/j.fbl2902051. Front Biosci (Landmark Ed). 2024. PMID: 38420825
-
Quinoa as source of type 1 ribosome inactivating proteins: A novel knowledge for a revision of its consumption.Food Chem. 2021 Apr 16;342:128337. doi: 10.1016/j.foodchem.2020.128337. Epub 2020 Oct 10. Food Chem. 2021. PMID: 33077288
-
A Novel EGFR Targeted Immunotoxin Based on Cetuximab and Type 1 RIP Quinoin Overcomes the Cetuximab Resistance in Colorectal Cancer Cells.Toxins (Basel). 2023 Jan 9;15(1):57. doi: 10.3390/toxins15010057. Toxins (Basel). 2023. PMID: 36668877 Free PMC article.
-
Involvement of Intracellular Cholesterol in Temozolomide-Induced Glioblastoma Cell Death.Neurol Med Chir (Tokyo). 2018 Jul 15;58(7):296-302. doi: 10.2176/nmc.ra.2018-0040. Epub 2018 Jun 13. Neurol Med Chir (Tokyo). 2018. PMID: 29899179 Free PMC article. Review.
Cited by
-
Chenopodium quinoa Willd. and Amaranthus hybridus L.: Ancestral Andean Food Security and Modern Anticancer and Antimicrobial Activity.Pharmaceuticals (Basel). 2023 Dec 15;16(12):1728. doi: 10.3390/ph16121728. Pharmaceuticals (Basel). 2023. PMID: 38139854 Free PMC article. Review.
-
Hortensins, Type 1 Ribosome-Inactivating Proteins from Seeds of Red Mountain Spinach: Isolation, Characterization, and Their Effect on Glioblastoma Cells.Toxins (Basel). 2024 Mar 4;16(3):135. doi: 10.3390/toxins16030135. Toxins (Basel). 2024. PMID: 38535801 Free PMC article.
-
Harnessing the Potential of Quinoa: Nutritional Profiling, Bioactive Components, and Implications for Health Promotion.Antioxidants (Basel). 2024 Jul 10;13(7):829. doi: 10.3390/antiox13070829. Antioxidants (Basel). 2024. PMID: 39061898 Free PMC article. Review.
-
Ribosomes and Ribosomal Proteins Promote Plasticity and Stemness Induction in Glioma Cells via Reprogramming.Cells. 2022 Jul 7;11(14):2142. doi: 10.3390/cells11142142. Cells. 2022. PMID: 35883585 Free PMC article. Review.
-
Ageritin-The Ribotoxin-like Protein from Poplar Mushroom (Cyclocybe aegerita) Sensitizes Primary Glioblastoma Cells to Conventional Temozolomide Chemotherapy.Molecules. 2022 Apr 7;27(8):2385. doi: 10.3390/molecules27082385. Molecules. 2022. PMID: 35458581 Free PMC article.
References
Publication types
MeSH terms
Substances
LinkOut - more resources
Full Text Sources
Miscellaneous
