. 2021 Oct 22;17(10):e1009845.
doi: 10.1371/journal.pgen.1009845. eCollection 2021 Oct.

Genome-wide analyses of light-regulated genes in Aspergillus nidulans reveal a complex interplay between different photoreceptors and novel photoreceptor functions

Affiliations

Genome-wide analyses of light-regulated genes in Aspergillus nidulans reveal a complex interplay between different photoreceptors and novel photoreceptor functions

Zhenzhong Yu et al. PLoS Genet. .

Abstract

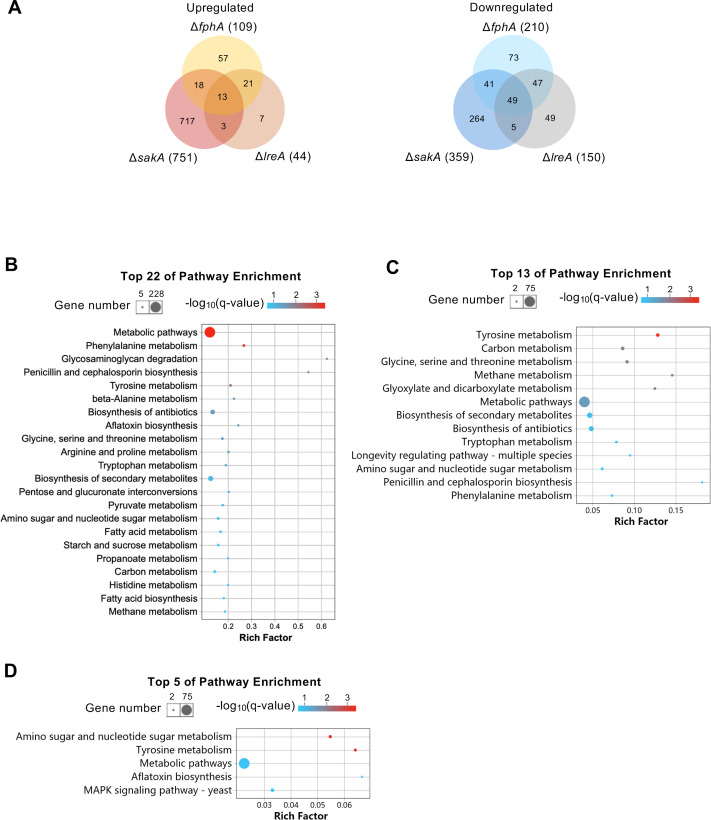
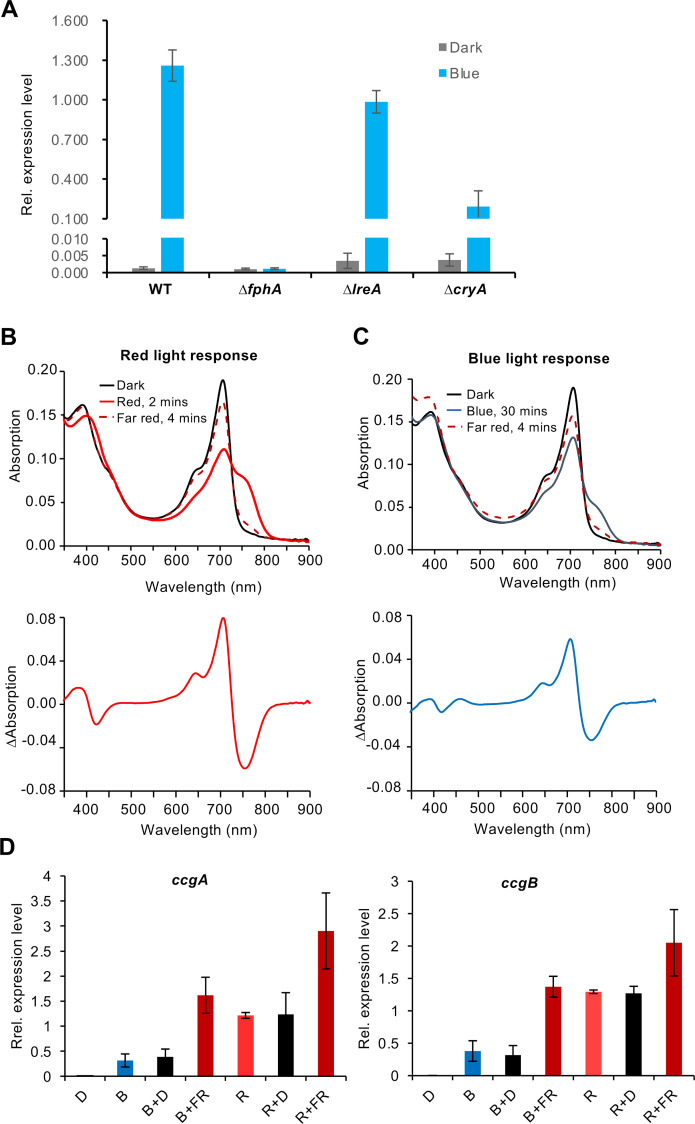
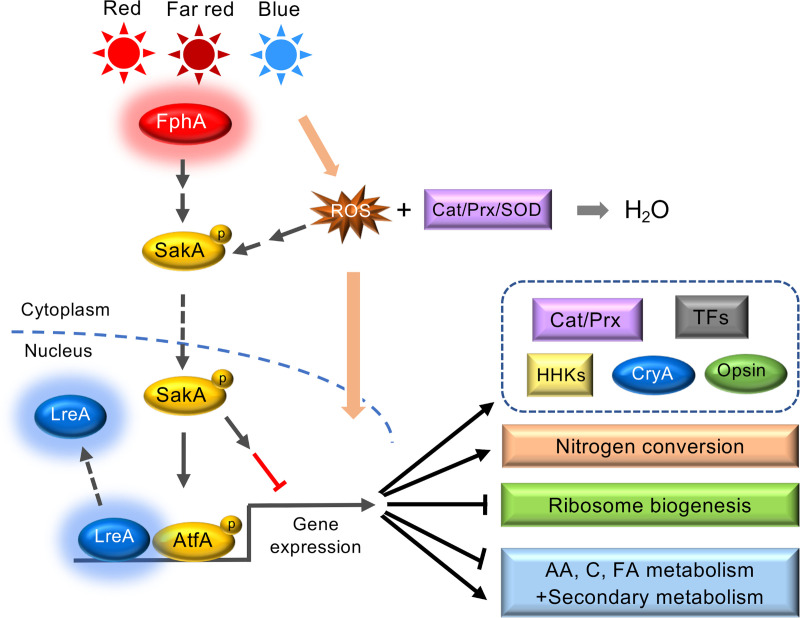
Fungi sense light of different wavelengths using blue-, green-, and red-light photoreceptors. Blue light sensing requires the "white-collar" proteins with flavin as chromophore, and red light is sensed through phytochrome. Here we analyzed genome-wide gene expression changes caused by short-term, low-light intensity illumination with blue-, red- or far-red light in Aspergillus nidulans and found that more than 1100 genes were differentially regulated. The largest number of up- and downregulated genes depended on the phytochrome FphA and the attached HOG pathway. FphA and the white-collar orthologue LreA fulfill activating but also repressing functions under all light conditions and both appear to have roles in the dark. Additionally, we found about 100 genes, which are red-light induced in the absence of phytochrome, suggesting alternative red-light sensing systems. We also found blue-light induced genes in the absence of the blue-light receptor LreA. We present evidence that cryptochrome may be part of this regulatory cue, but that phytochrome is essential for the response. In addition to in vivo data showing that FphA is involved in blue-light sensing, we performed spectroscopy of purified phytochrome and show that it responds indeed to blue light.


Conflict of interest statement

The authors have declared that no competing interests exist.

Figures

Fig 1
Fig 1. Luciferase-based reporter assay.
(A) Luciferase was cloned behind the conJ promoter and transformed into wildtype, the ΔfphA- or the ΔlreA-deletion strains. After 16 h incubation in the dark, luminescence was measured every 10 min for 90 min under the indicated light conditions. (B) Measurement was performed like in (A), but the luciferase was under the control of the ccgA promoter. The graphs represent the mean of three biological replicates with two or three technical replicates. Error bars indicate standard deviation.
Fig 2
Fig 2. Reactive oxygen species (ROS) levels in wild type (SJR2) and the ΔfphA-, the ΔlreA-, the ΔsakA- and the ΔfphA/ΔlreA-deletion strains.
(A) Expression analysis of ccgA and ccgB under oxidative stress. The mycelia grown in supplemented liquid minimal medium in shaking flasks in the dark were harvested after 30 mM hydrogen peroxide was imposed for 15 min and 30 min. The expression of ccgA and conJ was normalized to the h2b gene. The error bar was calculated from three biological replicates. Significant differences were calculated using the two-sample t-test (**P<0.01 and ***P<0.001). (B) Growth of indicated strains on minimal medium (control) and minimal medium containing 100 μM menadione at 37°C. 5000 spores were inoculated for each strain, and pictures were taken after 48 hours (control) and 120 hours (minimal medium + 100 μM menadione. (C) Representative images of the ROS signals quantified in (D). The WT and ΔfphA-strains were chosen as examples. Scale bar = 10 μm. (D) Quantification of ROS signals after blue-light illumination at 1.7 μmol photons m-2 s-1 (left) and at 17 μmol photons m-2 s-1 (right). Relative increase of ROS signals compared to the initial value (normalized to 1). Error bars indicate standard deviation.
Fig 3
Fig 3. Transcriptional response of the wild-type strain upon red, blue and far-red light exposure.
(A) Expression of ccgA and ccgB in wild type in red-, blue- and far-red light quantified by reverse transcriptase-quantitative PCR (RT-qPCR). Red, blue and far-red light with the intensity of 1.7 μmol photons m-2 s-1 was applied for 15 min before RNA isolation. The expression of ccgA and conJ was normalized to the h2b gene. The error bar was calculated from three biological replicates. (B) Venn diagram analysis of the differentially expressed genes (DEGs) (fold change ≥ 2, adjusted p-value ≤ 0.05) identified in red, far-red and blue light. (C) GO enrichment analysis of DEGs. (D) KEGG pathway analysis performed with all DEGs identified in red, far-red and blue light (p-value < 0.05). The color of the bubbles indicates the value of -log10(q-value) and the q-value represents the corrected p-value. Rich factor refers to the quotient of the number of DEGs and the total gene number in the pathway. (E) List of DEGs involved in ribosome biogenesis. Heatmap displays values of log2(fold change) of DEGs. Color scale, -1.5 ≤log2(fold change) ≤0.5.
Fig 4
Fig 4. Transcriptional response of wild type, the ΔfphA-, the ΔlreA- and the ΔsakA-deletion strains upon red, blue and far-red light exposure.
(A) Expression of ccgA and ccgB in different strains in red-, blue- and far-red light measured by reverse transcriptase-quantitative PCR (RT-qPCR). The experiment was performed as above. The error bar was calculated from three biological replicates. (B) Venn diagram analysis of DEGs identified in different strains upon red light illumination. (C) Venn diagram analysis of DEGs identified in different strains upon blue light exposure. (D) Heatmap of the DEGs involved in ribosome biogenesis in the strains indicated. The colors of heatmap represent log2(fold change) of DEGs. Color scale, -1.6≤log2(fold change)≤0.2. (E) Heatmap of the DEGs involved in nitrogen assimilation in the strains indicated. Heatmap displays log2(fold change) of DEGs. Color scale, -0.3 ≤log2(fold change)≤2.7. (F) Heatmap of the DEGs involved in two component regulatory systems. Heatmap displays log2(fold change) of DEGs. Color scale, 0 ≤log2(fold change) ≤3.9.
Fig 5
Fig 5. Venn diagram and KEGG pathway enrichment analyses of DEGs identified in the mutants in comparison to wild type in the dark.
Venn diagram analyses (A) performed with up- and downregulated genes in ΔsakA, ΔfphA, ΔlreA mutants. KEGG pathway analyses conducted with the DEGs identified in ΔsakA (B), ΔfphA (C), ΔlreA (D), respectively. The bubble charts were created with significantly enriched pathways (p-value ≤ 0.05). The color of the bubbles indicates the value of -log10(q-value) and the q-value represents corrected p-value. Rich factor refers to the quotient of the number of DEGs and the total gene amount in the pathway.
Fig 6
Fig 6. Role of cryptochrome and phytochrome in the blue-light response.
(A) ccgB expression level in wild type, the ΔfphA-, the ΔlreA- and the ΔcryA-deletion strains. The mycelia grown on the surface of the supplemented liquid minimal medium were exposed to blue light 15 min before RNA isolation. The expression of ccgB was normalized to the h2b gene. The error bar was calculated from three biological replicates. (B) Spectral analysis of phytochrome in vitro. FphA was purified from E. coli and a spectrum recorded in the dark, followed by 2 min illumination with red light to convert the Pr- into the Pfr form. The Pfr form was illuminated 4 min with far red light to recover the Pr form. (C) Like in (B), but illumination of the Pr form with blue light for 30 min. (D) Analysis of the reversibility of the light-induced gene expression. Expression of ccgA and ccgB in WT (SJR2) in dark, blue, red and blue or red followed by darkness or far-red light. The different phases were 15 min. The error bar was calculated from three biological replicates.
Fig 7
Fig 7. Model for light regulating pathways in A. nidulans.
LreA acts as repressor under blue- and red-light conditions, while FphA senses blue, red and far-red light. Besides LreA and FphA, reactive oxygen species (ROS) may be used as a read-out for illumination with blue-light. For further details refer to the Discussion.

Similar articles

Cited by

References

    1. Bodvard K, Peeters K, Roger F, Romanov N, Igbaria A, Welkenhuysen N, et al.. Light-sensing via hydrogen peroxide and a peroxiredoxin. Nat Commun. 2017;8:14791. doi: 10.1038/ncomms14791 ; PubMed Central PMCID: PMC5376668. - DOI - PMC - PubMed
    1. Corrochano LM. Light in the fungal world. Ann Rev Genet. 2019;53:149–70. doi: 10.1146/annurev-genet-120417-031415 - DOI - PubMed
    1. Schumacher J, Gorbushina A. Light sensing in plant- and rock-associated black fungi. Fungal Biol. 2020;124(5):407–17. doi: 10.1016/j.funbio.2020.01.004 - DOI - PubMed
    1. Yu Z, Fischer R. Light sensing and responses in fungi. Nat Rev Microbiol. 2019;17(1):25–36. doi: 10.1038/s41579-018-0109-x - DOI - PubMed
    1. Rodriguez-Romero J, Hedtke M, Kastner C, Müller S, Fischer R. Fungi, hidden in soil or up in the air: light makes a difference. Annu Rev Microbiol. 2010;64:585–610. doi: 10.1146/annurev.micro.112408.134000 - DOI - PubMed

Publication types

MeSH terms