. 2021 Oct 13;10(10):1605.
doi: 10.3390/antiox10101605.

Genome-Wide Transcriptome Profiling, Characterization, and Functional Identification of NAC Transcription Factors in Sorghum under Salt Stress

Affiliations

Genome-Wide Transcriptome Profiling, Characterization, and Functional Identification of NAC Transcription Factors in Sorghum under Salt Stress

Himani Punia et al. Antioxidants (Basel). .

Abstract

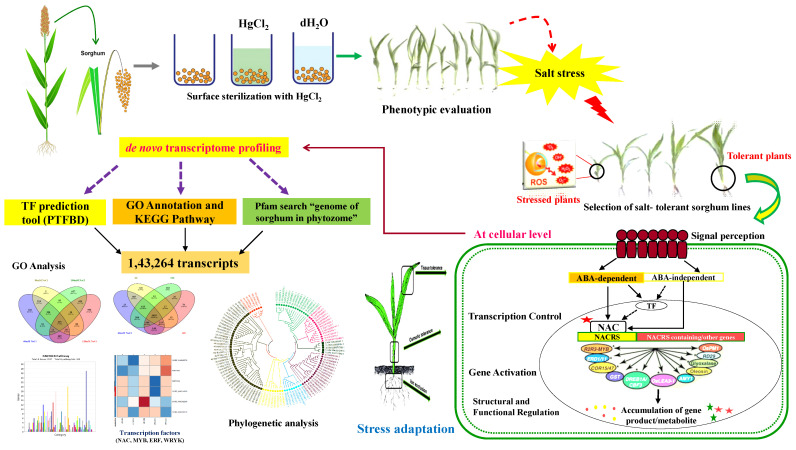
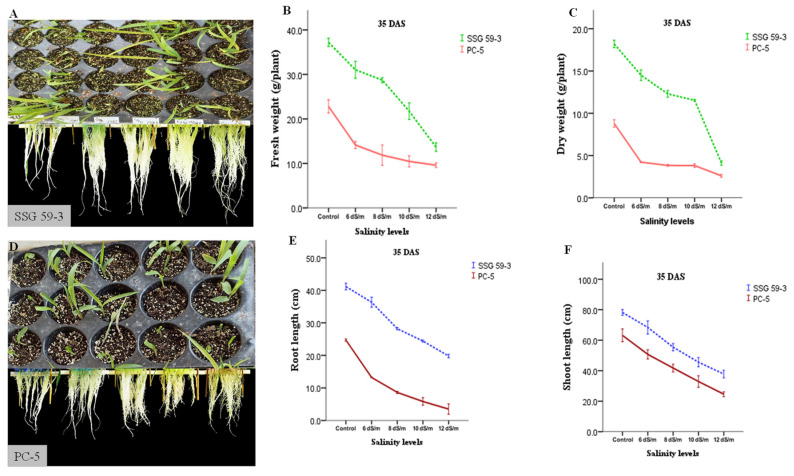
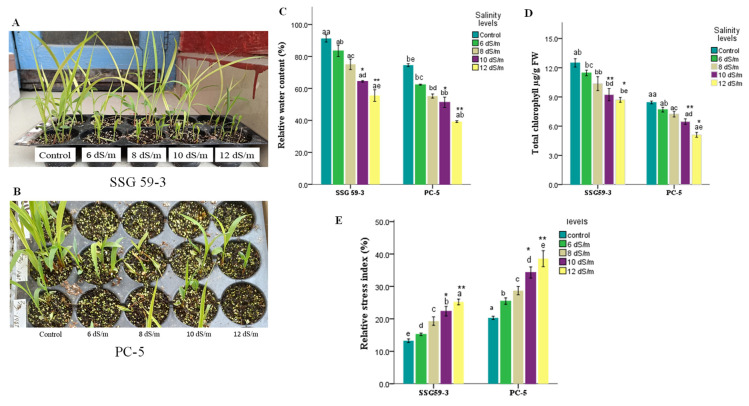
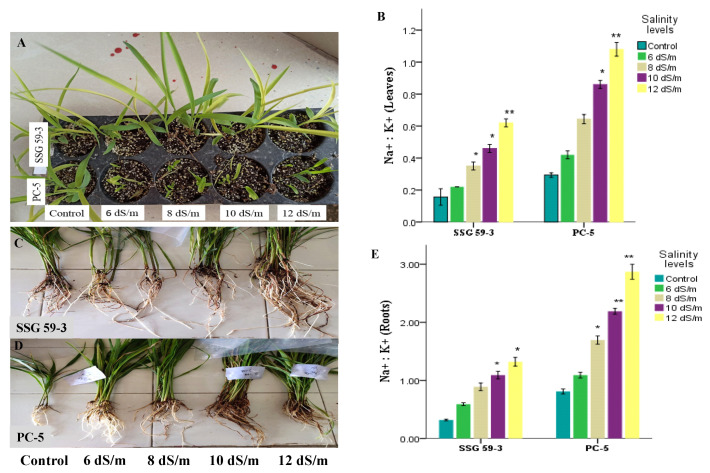
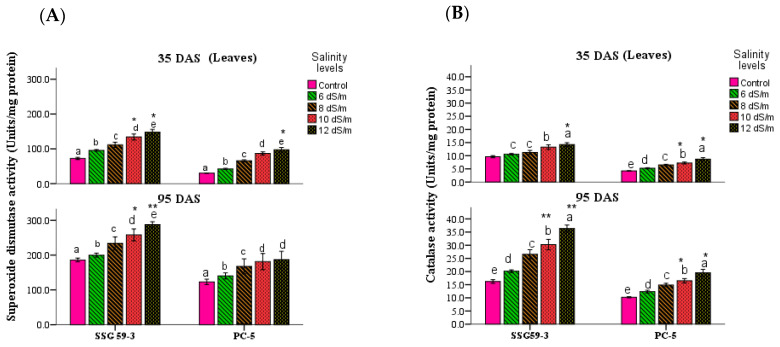
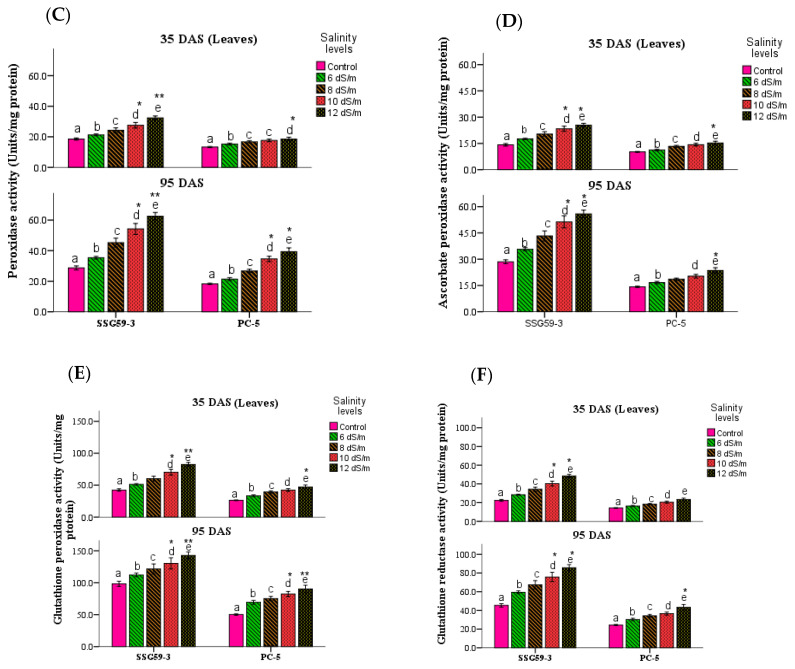
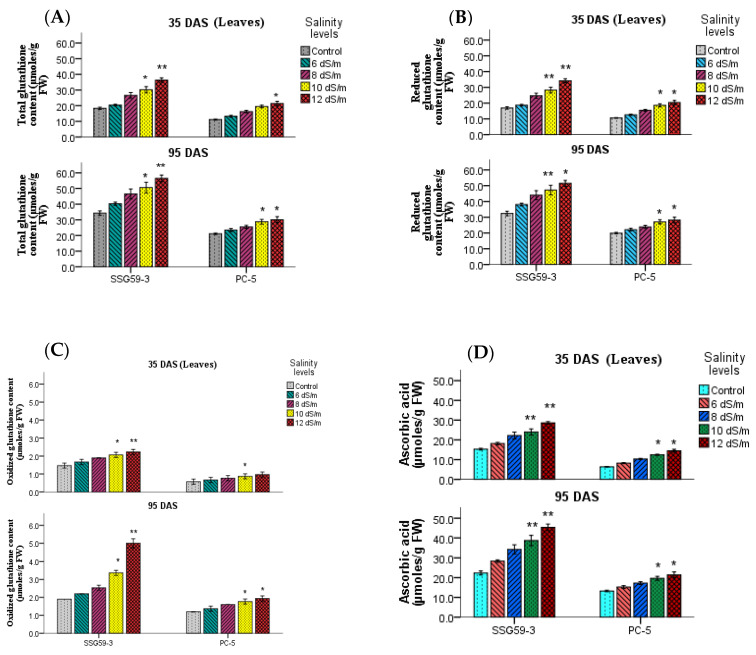
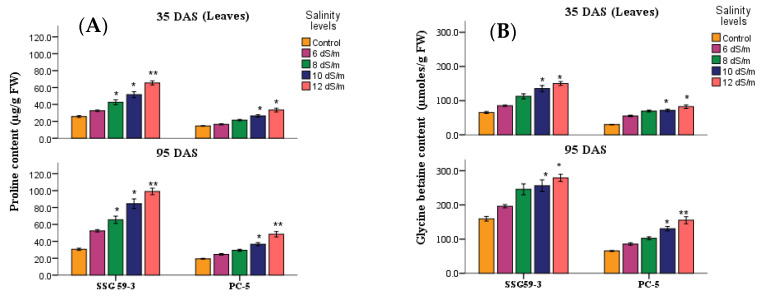
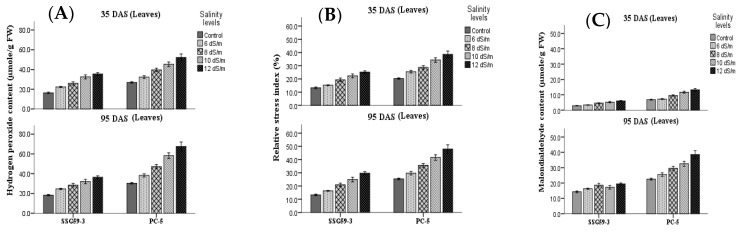
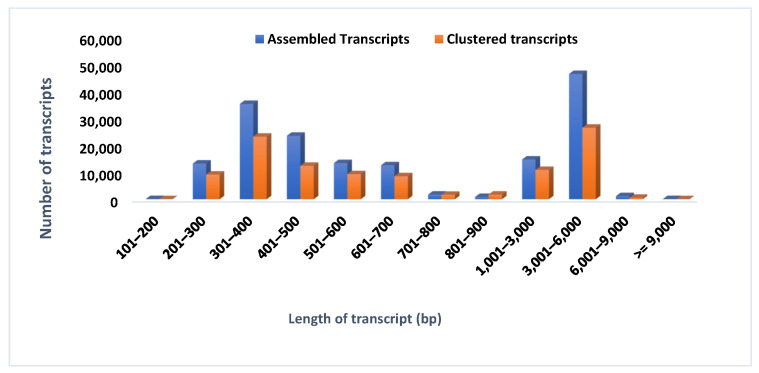
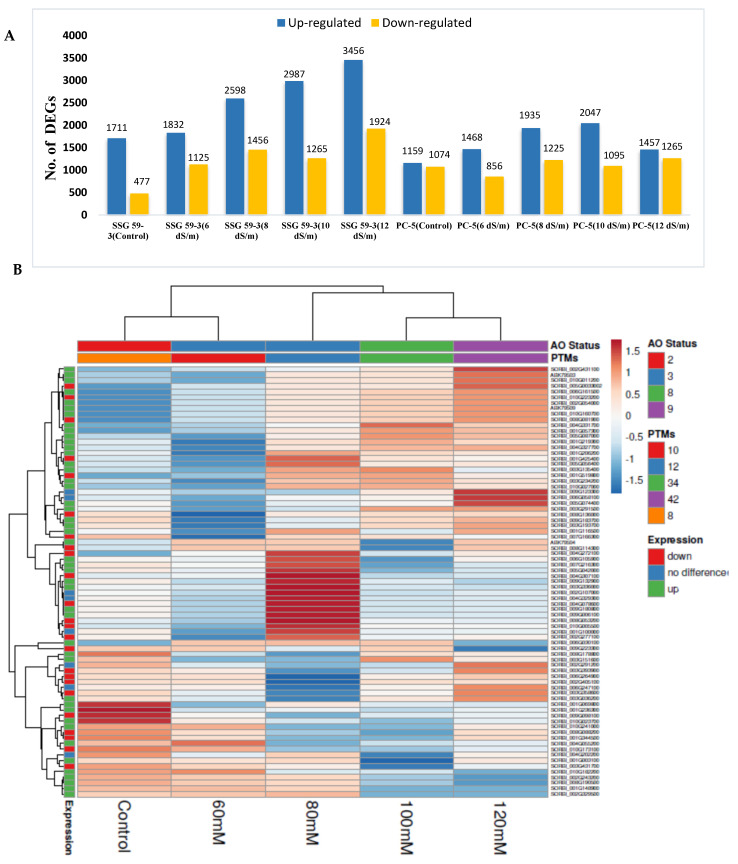
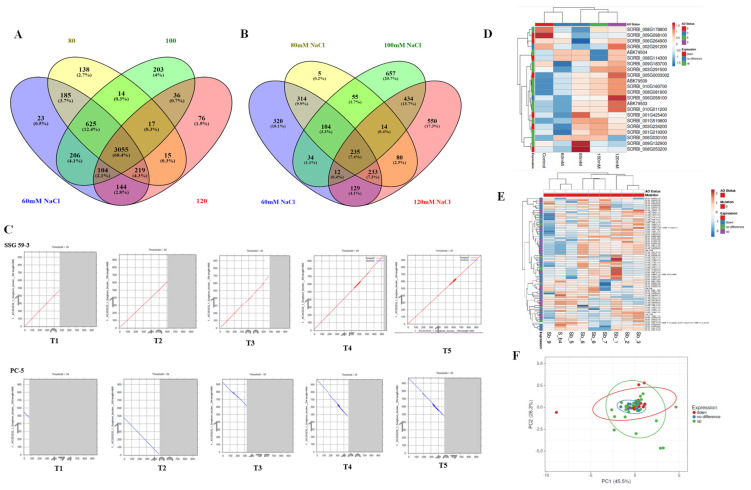
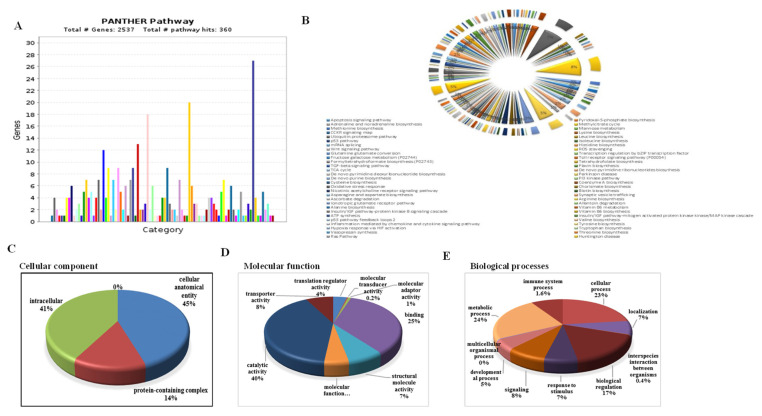
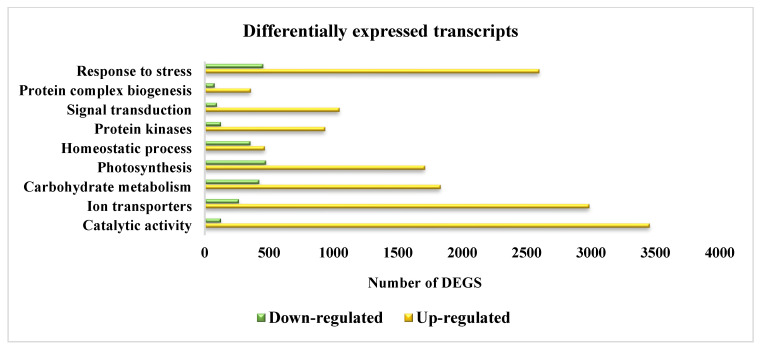
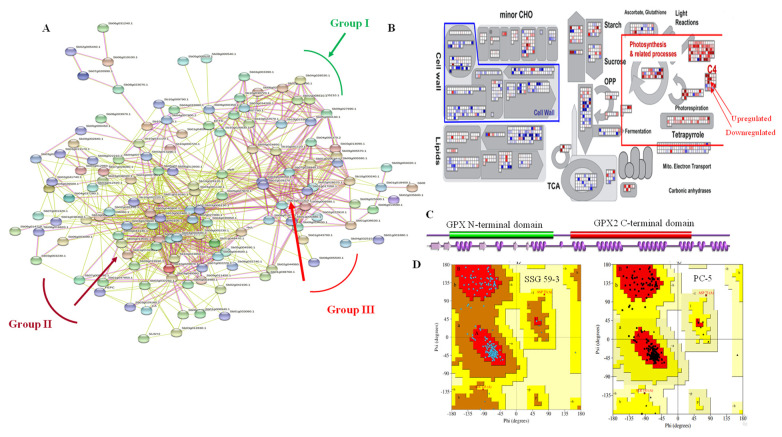
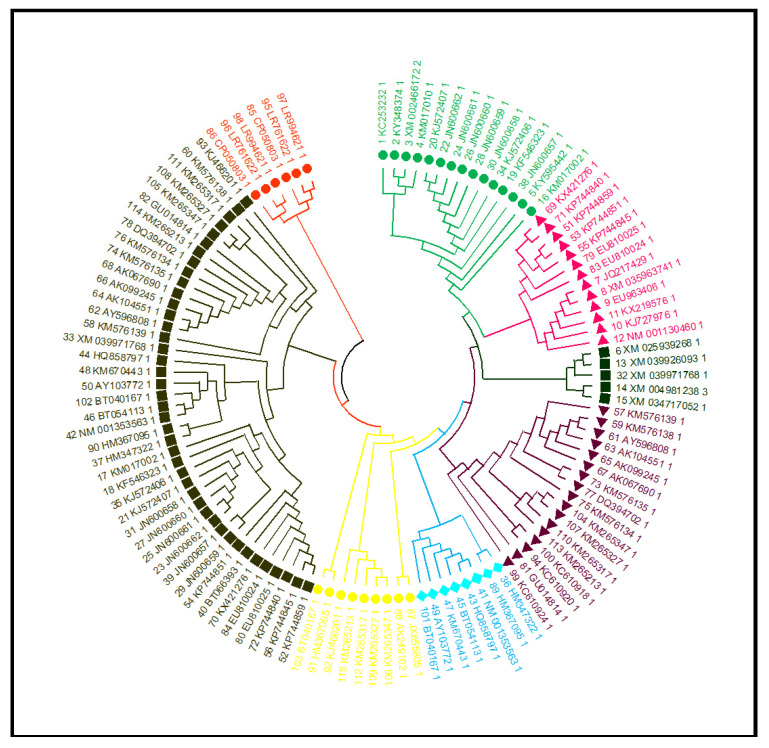
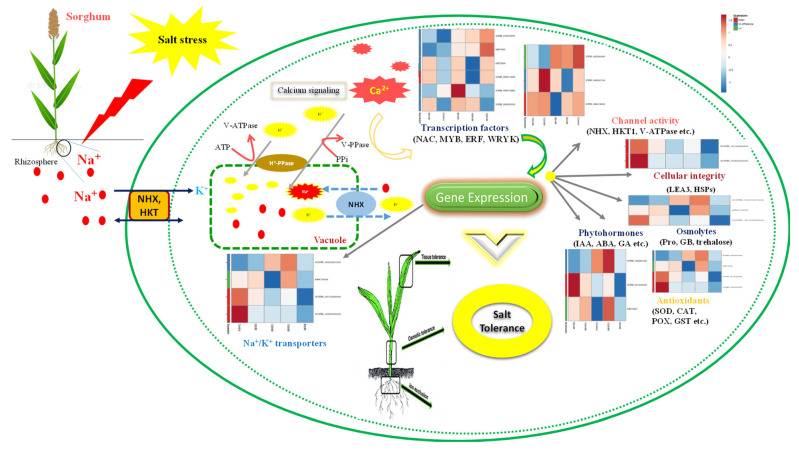
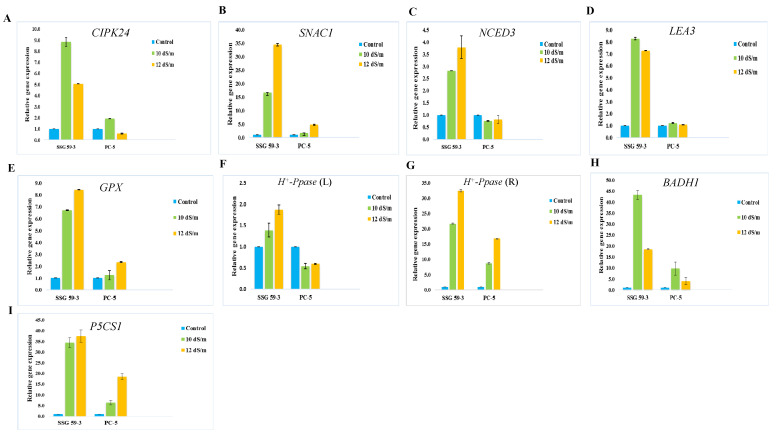
Salinity stress has become a significant concern to global food security. Revealing the mechanisms that enable plants to survive under salinity has immense significance. Sorghum has increasingly attracted researchers interested in understanding the survival and adaptation strategies to high salinity. However, systematic analysis of the DEGs (differentially expressed genes) and their relative expression has not been reported in sorghum under salt stress. The de novo transcriptomic analysis of sorghum under different salinity levels from 60 to 120 mM NaCl was generated using Illumina HiSeq. Approximately 323.49 million high-quality reads, with an average contig length of 1145 bp, were assembled de novo. On average, 62% of unigenes were functionally annotated to known proteins. These DEGs were mainly involved in several important metabolic processes, such as carbohydrate and lipid metabolism, cell wall biogenesis, photosynthesis, and hormone signaling. SSG 59-3 alleviated the adverse effects of salinity by suppressing oxidative stress (H2O2) and stimulating enzymatic and non-enzymatic antioxidant activities (SOD, APX, CAT, APX, POX, GR, GSH, ASC, proline, and GB), as well as protecting cell membrane integrity (MDA and electrolyte leakage). Significant up-regulation of transcripts encoding the NAC, MYB, and WRYK families, NHX transporters, the aquaporin protein family, photosynthetic genes, antioxidants, and compatible osmolyte proteins were observed. The tolerant line (SSG 59-3) engaged highly efficient machinery in response to elevated salinity, especially during the transport and influx of K+ ions, signal transduction, and osmotic homeostasis. Our data provide insights into the evolution of the NAC TFs gene family and further support the hypothesis that these genes are essential for plant responses to salinity. The findings may provide a molecular foundation for further exploring the potential functions of NAC TFs in developing salt-resistant sorghum lines.

Keywords: differential gene expression; gene ontology; genome-wide association; salinity; sorghum; transcription factors; transcriptomics.


Conflict of interest statement

The authors declare no conflict of interest.

Figures

Figure 1
Figure 1
Sorghum bicolor genotypes at different salinity treatments at vegetative stage.
Figure 2
Figure 2
Experimental overview|Two S. bicolor genotypes (SSG 59-3 and PC-5) with varied salt tolerance were phenotypically evaluated based on germination studies and then planted in screen house under different salt concentrations. Leaves from 5 plants were pooled and considered a biological replicate, and two such replicates were used in the analysis. Total RNA was isolated from sorghum leaves; sequencing libraries were generated. After library construction, they were sequenced on an Illumina Hiseq-2500 platform to obtain 125 bp/150 bp paired-end reads. The raw data generated were processed and differential expression analysis was performed, followed by phylogenetic analysis, as well as analyses of protein characteristics and gene structure.
Figure 3
Figure 3
Biomass accumulation and performance of two S. bicolor genotypes—SSG 59-3 (salt-tolerant) and PC-5 (salt-sensitive)—under normal (control) and salt-stressed conditions. (A) Twenty-one-day-old seedlings and roots of salt-tolerant SSG 59-3 after 48 h of salt exposure. Effect of the salt treatment on (B) Fresh weight (FW), (C) dry weight (DW), (D) 21-day-old seedlings and roots of salt-sensitive PC-5 after 48 h of salt exposure, (E) root length, and (F) shoot length. All values are the means ± SD of three biological replicates.
Figure 4
Figure 4
Effect of salt stress on morphological traits of sorghum genotypes. (A) Twenty-one-day-old seedlings of salt-tolerant SSG 59-3 after 48 h of salt exposure, (B) 21-day-old seedlings of salt-sensitive PC-5 after 48 h of salt exposure. Effect of the salt treatment on (C) relative water content (RWC), (D) total chlorophyll content, and (E) relative stress index. All values are the means ± SD of three biological replicates. Asterisks represent significant (*) and highly significant (**) differences among different treatments. a–e Values with different superscripts in the same row are significantly different at p < 0.05.
Figure 5
Figure 5
Effect of salt stress on ion profiling of sorghum genotypes. (A) Seedlings of SSG 59-3 (salt-tolerant) and PC-5 (salt-sensitive) genotypes after 48 h of salt exposure, (B) Na+/K+ ratios in leaves, (C) root biomass of SSG 59-3 (salt-tolerant), (D) root biomass of PC-5 (salt-sensitive) genotype, and (E) Na+/K+ ratios in roots. All values are the means ± SD of three biological replicates. Asterisks represent significant (*) and highly significant (**) differences among different treatments.
Figure 6
Figure 6
Effect of salt stress on superoxide dismutase (SOD, A), catalase (CAT, B), peroxidase (POX, C), ascorbate peroxidase (APX, D), glutathione peroxidase (GPX, E), and glutathione reductase (GR, F) of sorghum genotypes at 35 and 95 DAS. All values are the means ± SD of three biological replicates. Asterisks represent significant (*) and highly significant (**) differences among different treatments. a–e Values with different superscripts in the same row are significantly different at p < 0.05.
Figure 6
Figure 6
Effect of salt stress on superoxide dismutase (SOD, A), catalase (CAT, B), peroxidase (POX, C), ascorbate peroxidase (APX, D), glutathione peroxidase (GPX, E), and glutathione reductase (GR, F) of sorghum genotypes at 35 and 95 DAS. All values are the means ± SD of three biological replicates. Asterisks represent significant (*) and highly significant (**) differences among different treatments. a–e Values with different superscripts in the same row are significantly different at p < 0.05.
Figure 7
Figure 7
Effect of salt stress on total glutathione (A), reduced glutathione (GSH, B), oxidized glutathione (GSSG, C) and ascorbic acid (ASC, D) of sorghum genotypes at 35 and 95 DAS. All values are the means ± SD of three biological replicates. Asterisks represent significant (*) and highly significant (**) differences among different treatments.
Figure 8
Figure 8
Effect of salt stress on proline (Pro, A), and glycine betaine (GB, B) of sorghum genotypes at 35 and 95 DAS. All values are the means ± SD of three biological replicates. Asterisks represent significant (*) and highly significant (**) differences among different treatments.
Figure 9
Figure 9
Effect of salt stress on hydrogen peroxide (H2O2, A), relatives stress index (RSI, B), and malondialdehyde (MDA, C) of sorghum genotypes at 35 and 95 DAS. All values are the means ± SD of three biological replicates.
Figure 10
Figure 10
Sequence characterization of assembled and clustered transcripts of sorghum.
Figure 11
Figure 11
An (A) overview of DEGs in different combinations; (B) heat map and clustering of the top 50 salinity-responsive DEGs in control and stressed shoot tissues of SSG 59-3 (salt-tolerant) and PC-5 (salt-sensitive) sorghum genotypes using Clustvis (https://biit.cs.ut.ee/clustvis/, accessed on 19 June 2021).
Figure 12
Figure 12
Number and grouping of DEGs. (A,B) Venn diagram analysis of DEGs identified in sorghum genotypes under the five experimental comparisons. Principal component analysis (PCA) showing clusters under different salinity treatments in sorghum genotypes. (C) Overview of DEGs SSG59-3 and PC-5, (D,E) heatmap representing top 22 up- and downregulated transcripts, (F) principal component analysis of the clusters as per the treatment.
Figure 13
Figure 13
GO terms: (A) Gene Ontology classification of metabolic pathways, (B) frequency of highly abundant GO terms under the molecular function, biological process, and cellular component categories in Sorghum bicolor, (C) GO classification based on the cellular level, (D) GO Ontology classification based on molecular function, (E) GO classification based on biological processes.
Figure 14
Figure 14
Most highly represented pathways in Sorghum bicolor.
Figure 15
Figure 15
Network analysis: (A) STRING-based interaction network analysis of DEGs, (B) MapMan pathway analysis, (C) 3-d structure of glutathione peroxidase gene using PDBsum, (D) Ramachandran plot of amino acid residues in salt-tolerant and susceptible genotype.
Figure 16
Figure 16
Phylogenetic tree of NAC1 proteins from sorghum using the Mega X (ML method). The colored arcs display different groups. The green circles, pink triangles, green squares, brown triangles, blue stars, yellow circles, brown squares, and red circles represent Sorghum bicolor, Oryza sativa, Miscanthus lutarioriparius, Panicum virgatum, Setaria viridis, Hordeum vulgare, Zea mays, and Digitaria exilis, respectively.
Figure 17
Figure 17
Schematic representation of the molecular mechanisms underlying salinity tolerance acquisition under different salt concentrations.
Figure 18
Figure 18
The expression levels (AI) of stress-related marker genes of 10 selected DEGs based on qPCR. The PP2A gene was used as the reference gene/internal control. Data are shown as mean ± S.D. (n = 3).

References

    1. Punia H., Tokas J., Bhadu S., Mohanty A.K., Rawat P., Malik A. Satpal Proteome dynamics and transcriptome profiling in sorghum [Sorghum bicolor (L.) Moench] under salt stress. 3 Biotech. 2020;10:412. doi: 10.1007/s13205-020-02392-1. - DOI - PMC - PubMed
    1. Corwin D.L., Scudiero E. Advances in Agronomy. Volume 158. Elsevier; Amsterdam, The Netherlands: 2019. Review of soil salinity assessment for agriculture across multiple scales using proximal and/or remote sensors; pp. 1–130.
    1. Punia H., Tokas J., Malik A., Satpal, Sangwan S. Characterization of phenolic compounds and antioxidant activity in sorghum [Sorghum bicolor (L.) Moench] grains. Cereal Res. Commun. 2021 doi: 10.1007/s42976-020-00118-w. - DOI
    1. Malik A., Mor V.S., Tokas J., Punia H., Malik S., Malik K., Sangwan S., Tomar S., Singh P., Singh N. Biostimulant-Treated Seedlings under Sustainable Agriculture: A Global Perspective Facing Climate Change. Agronomy. 2020;11:14. doi: 10.3390/agronomy11010014. - DOI
    1. Punia H., Tokas J., Malik A., Singh S., Phogat D.S., Bhuker A., Mor V.S., Rani A., Sheokand R.N. Discerning morpho-physiological and quality traits contributing to salinity tolerance acquisition in sorghum [Sorghum bicolor (L.) Moench] S. Afr. J. Bot. 2021;140:409–418. doi: 10.1016/j.sajb.2020.09.036. - DOI

LinkOut - more resources