. 2021 Oct 13;11(10):2950.
doi: 10.3390/ani11102950.

Factors Associated with Fatality in Ontario Thoroughbred Racehorses: 2003-2015

Affiliations

Factors Associated with Fatality in Ontario Thoroughbred Racehorses: 2003-2015

Peter Physick-Sheard et al. Animals (Basel). .

Abstract

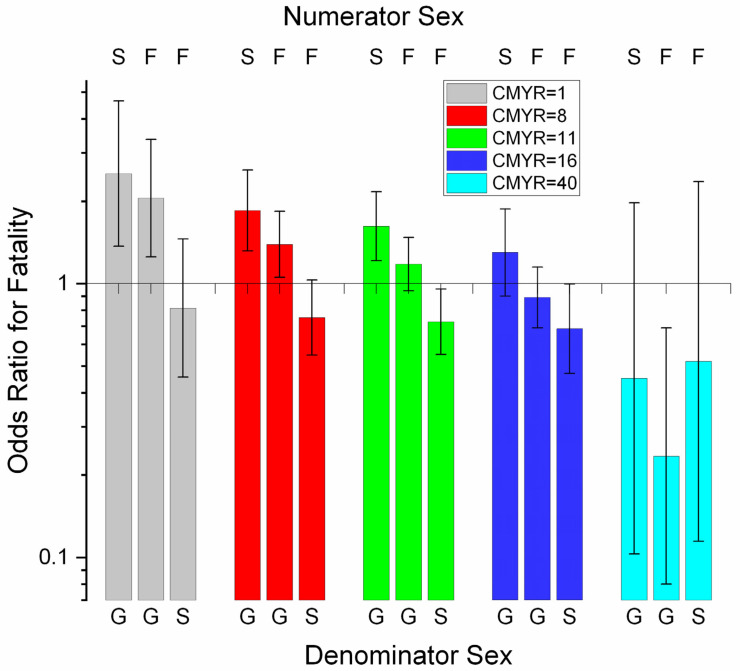
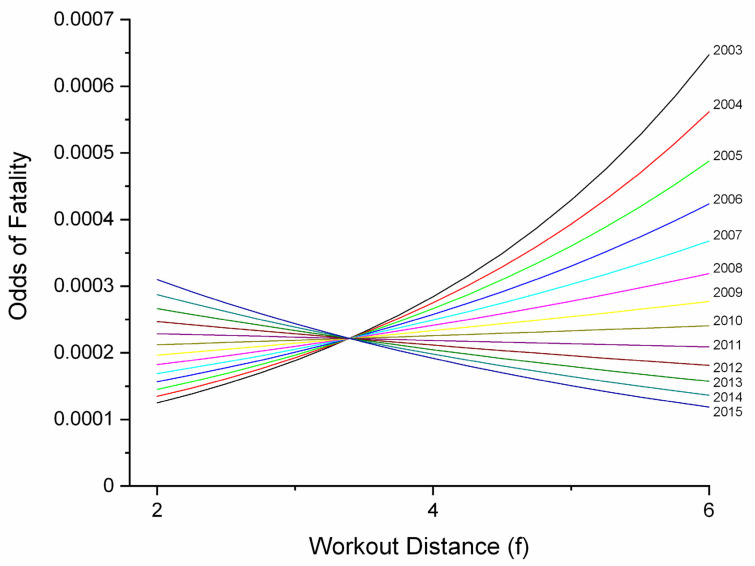
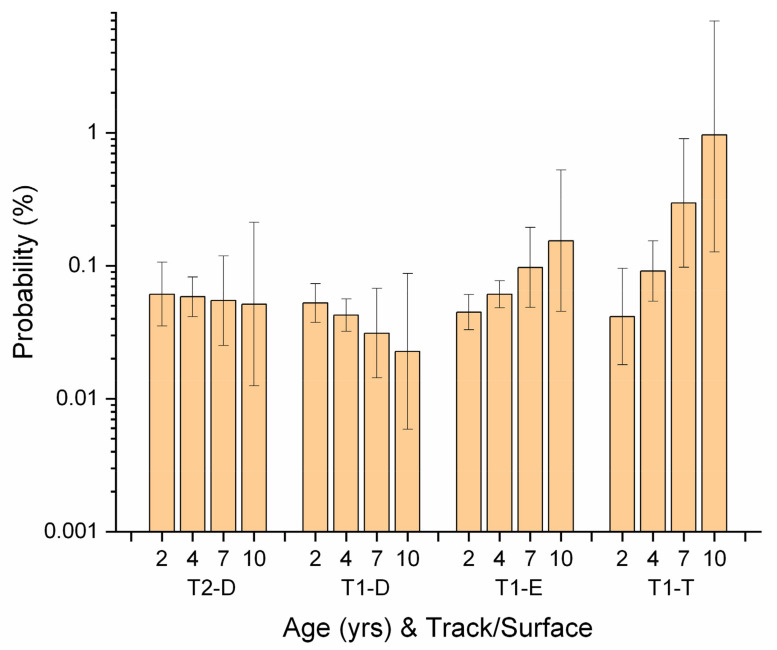
Ontario's Alcohol and Gaming Commission records equine racing fatalities through its Equine Health Program. The present study examined all Thoroughbred fatalities from 2003 to 2015, inclusive, to identify associations. Official records and details of fatalities were combined in multivariable logistic regression modelling of 236,386 race work-events (433 fatalities), and 459,013 workout work-events (252 fatalities). Fatality rates were 2.94/1000 race starts (all fatalities) and 1.96/1000 (breakdowns only) with an overall rate of 2.61% or 26.1 fatalities/1000 horses. Comparison with published reports reveals rates to be high. Musculoskeletal injury was the predominant complaint and there was a high incidence of horses dying suddenly. Liability was high for young horses early in the season with a differential according to sex and whether a male horse was gelded. Horses undertaking repeated workouts had a higher liability and liability was higher in workouts for horses switching from dirt/synthetic to turf racing and for young horses in sprints. Race distance was not significant but high fatality rates in some large field, distance races combined with effects of age and workload identified groups at particular risk. As field size increased, fatality liability increased for early-finishing horses. Findings suggest jockey strategy could be an important factor influencing fatalities. Probability of fatality declined over the study period. Findings indicate that rapid accumulation of workload in animals early in their preparation is likely to be damaging. Fatality fell toward the end of a season and for horses with a long career history of successful performance; however, horses not exhibiting this robustness and staying power represent the population of greatest concern. Associations may be characterised as representing sources of stress, current or cumulative, and identifying at-risk animals on this basis may be as productive as targeting specific, discrete mechanisms suspected to contribute to individual fatalities.

Keywords: equine welfare; musculoskeletal injury; racing industry; risk factors; social license; sudden death; sustainability; training; work intensity.


Conflict of interest statement

The authors declare no conflict of interest.

Figures

Figure 1
Figure 1
Odds of fatality by age and year for combined race-event and workout-event data for Ontario Thoroughbred racehorses for the period 2003–2015, unit of interest—work-event. This graph describes an AGE*YEAR interaction identified in multivariable logistic regression modelling of fatalities. For aged horses, odds increased over the study period, but for young horses, odds actually declined. This may be a reflection of increasing economic pressures throughout the study period.
Figure 2
Figure 2
Odds ratios for fatality for a SEX*CMYR (sex by cumulative work-events for the season) interaction identified in multivariable logistic regression modelling of fatalities among Thoroughbred racehorses in Ontario for the period 2003–2015, unit of interest—race work-event. The graph describes pairwise comparisons between SEX groups according to values of CMYR. For OR values above 1, the numerator odds of fatality are higher than the denominator odds. Intact stallions consistently had the highest odds of fatality until high levels of CMYR were reached, when geldings showed the highest fatality. Females showed intermediate fatality odds. Confidence intervals that include 1.0 are non-significant. F—female; G—gelding; S—stallion. (Note log scale on y-axis.)
Figure 3
Figure 3
Contrasts between FPOS (finish position) groups for combined race- and workout-event data for Ontario Thoroughbred racehorses for 2003–2015, unit of interest—work-event, and showing odds ratios (OR) for fatality between groups together with their 95% confidence intervals. For OR values above 1, the numerator odds of fatality are higher than the denominator odds. Differences were greatest between FPOS 12.5 (race) and FPOS 0 (workouts, OR = 18.868, 14.085–25.641). Workouts and FPOS 2.5 did not differ. This pattern reflects, in part, increasing liability for late-finishing horses with increasing field size. Confidence intervals that include 1.0 are non-significant. (FPOS 0—workout event; 2.5—finish positions 1–4; 5.5—positions 5 and 6; 9—positions 7–11; 12.5—positions greater than 11). (Note log scale on y-axis.)
Figure 4
Figure 4
Probability of fatality for Ontario Thoroughbred racehorses for the period 2003–2015 according to results of multivariable logistic regression modelling, unit of interest—race work-event. The graph shows an interaction between finish position (FPOS) group and race field size (RSIZE). Probability of fatality showed a (non-significant) increase with RSIZE for horses in FPOS group 2.5 (positions 1–4). For all other FPOS groups, probability fell within group with increasing RSIZE leading to an overall protective main effect of RSIZE. (Note log scale on y-axis.)
Figure 5
Figure 5
Odds of fatality by year (YEAR) and workout distance (DIST) for Ontario Thoroughbred racehorses for the period 2003–2015, unit of interest—workout work-event. The graph describes the interaction DIST*YEAR identified during multivariable logistic regression modelling of workout event fatalities. Fatality increased with workout distance early in the study period, but this effect disappeared by 2010, after which there was a reduction in fatality with increasing distance. Liability at 2f (mainly involving two-year-old horses) increased over the same period. (f—furlong.)
Figure 6
Figure 6
Probability (%) of fatality for workout work-events for Ontario Thoroughbred racehorses for the period 2003–2015, unit of interest—workout work-event, and describing an interaction between horse age (AGE) and track/surface combination (TS, AGE*TS) identified during multivariable logistic regression modelling. Track/surface combinations were used because not all surfaces were available at both tracks. On dirt surfaces at both tracks there was a non-significant trend to decreasing probability as AGE increased, but for Track 1 synthetic and turf surfaces, probability of fatality increased with AGE. (Note log scale on y-axis.) T2-D—Track 2 dirt; T1-D—Track 1 dirt; T1-E—Track 1 synthetic; T1-T—Track 1 turf.
Figure 7
Figure 7
Odds ratios (OR) for contrasts between combinations of track and surface (TS) and horse age (AGE) and describing an AGE*TS interaction identified in multivariable logistic regression modelling of fatalities in Ontario Thoroughbred racehorses for the period 2003–2015, unit of interest—workout event by horse-year. For OR values above 1, the numerator odds of fatality are higher than the denominator odds. The pattern for each comparison is for OR to rise as AGE increases and reflects progressively increasing fatality with age in the numerator. The effect is most marked for workouts on turf at Track 1, which show a very high liability for older horses. No workouts were recorded on turf at Track 2. (Note log scale on y-axis.) Confidence intervals that include 1.0 are non-significant.
Figure 8
Figure 8
Probability of fatality (%) by cumulative days in work (CMD) and yearday (YD) and describing a CMD*YD interaction identified during multivariable logistic regression modelling of associations with fatality for Ontario Thoroughbred racehorses for the period 2003–2015, unit of interest—race-event by horse-year. YD for each relationship is shown at the end of each curve. At the start of the season, probability is higher and there is a relatively rapid increase in fatality with increasing days in work, but as the season progresses, liability falls and the gradient of this relationship progressively decreases, then reverses. There was no second order relationship with CMD.

Similar articles

Cited by

References

    1. Bergmann I. Sustainability, thoroughbred racing and the need for change. Pferdeheilkunde. 2015;31:490–498. doi: 10.21836/PEM20150509. - DOI
    1. Ruse K., Davison A., Bridle K. Jump Horse Safety: Reconciling Public Debate and Australian Thoroughbred Jump Racing Data, 2012–2014. Animals. 2015;5:1072–1091. doi: 10.3390/ani5040399. - DOI - PMC - PubMed
    1. Graham R., McManus P. Changing Human-Animal Relationships in Sport: An Analysis of the UK and Australian Horse Racing Whips Debates. Animals. 2016;6:32. doi: 10.3390/ani6050032. - DOI - PMC - PubMed
    1. Colgate V.A., Marr C.M. Science-in-brief: Risk assessment for reducing injuries of the fetlock bones in Thoroughbred racehorses. Equine Vet. J. 2020;52:482–488. doi: 10.1111/evj.13273. - DOI - PubMed
    1. Riggs C.M. Fractures—A preventable hazard of racing thoroughbreds. Vet. J. 2002;163:19–29. doi: 10.1053/tvjl.2001.0610. - DOI - PubMed

Grants and funding