. 2021 Oct 10;13(20):5062.
doi: 10.3390/cancers13205062.

Connexin Hemichannel Activation by S-Nitrosoglutathione Synergizes Strongly with Photodynamic Therapy Potentiating Anti-Tumor Bystander Killing

Affiliations

Connexin Hemichannel Activation by S-Nitrosoglutathione Synergizes Strongly with Photodynamic Therapy Potentiating Anti-Tumor Bystander Killing

Chiara Nardin et al. Cancers (Basel). .

Abstract

In this study, we used B16-F10 cells grown in the dorsal skinfold chamber (DSC) preparation that allowed us to gain optical access to the processes triggered by photodynamic therapy (PDT). Partial irradiation of a photosensitized melanoma triggered cell death in non-irradiated tumor cells. Multiphoton intravital microscopy with genetically encoded fluorescence indicators revealed that bystander cell death was mediated by paracrine signaling due to adenosine triphosphate (ATP) release from connexin (Cx) hemichannels (HCs). Intercellular calcium (Ca2+) waves propagated from irradiated to bystander cells promoting intracellular Ca2+ transfer from the endoplasmic reticulum (ER) to mitochondria and rapid activation of apoptotic pathways. Combination treatment with S-nitrosoglutathione (GSNO), an endogenous nitric oxide (NO) donor that biases HCs towards the open state, greatly potentiated anti-tumor bystander killing via enhanced Ca2+ signaling, leading to a significant reduction of post-irradiation tumor mass. Our results demonstrate that HCs can be exploited to dramatically increase cytotoxic bystander effects and reveal a previously unappreciated role for HCs in tumor eradication promoted by PDT.

Keywords: calcium signaling; nitric oxide; photosensitization; purinergic signaling.


Conflict of interest statement

The authors declare no conflict of interests. The funders had no role in the design of the study; in the collection, analyses, or interpretation of data; in the writing of the manuscript, or in the decision to publish the results.

Figures

Figure 1
Figure 1
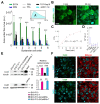
Intercellular calcium (Ca2+) waves triggered by focal photodynamic therapy in vivo. (A) Shown are GCaMP6s fluorescence emission (F) variations (ΔF = F − F0, where F0 = pre-stimulus value) at different time points after the onset of laser irradiation in standard conditions (normal extracellular medium containing 2 mM of Ca2+, NEM) or after 20 min incubation in Ca2+-free extracellular medium supplemented with ethylene glycol-bis(β-aminoethyl ether)-N,N,N′,N′-tetraacetic acid (EGTA, 5 mM). The contour of the irradiated cell is highlighted in the images captured at 5 s. Bystander cells were identified by ordinal numbers according to the distance from the irradiated cell (see, for an example, the contoured cells in the image at 70 s in EGTA conditions); scale bar: 20 µm; (B) Single-cell ΔF/F0 traces [mean (solid lines) ± standard error of the mean (s.e.m., dashed lines)] generated as pixel signal average within regions of interest contouring the cell focal plane section for each bystander cell order (from 1st to 6th); pooled data from n ≥ 6 experiments in 3 tumors for both conditions: green traces, EGTA; blue traces, NEM; vertical dashed lines mark the onset of irradiation at t = 10 s; (C) Area under ΔF/F0 curves (A, inset) computed between t = 10 s and t = 80 s (mean ± s.e.m.) vs. bystander cell order (abscissa): green bars, EGTA; blue bars, NEM; a.u., arbitrary units; n.s., not significant; *, p < 0.05; **, p < 0.01; ***; p < 0.001; the Mann-Whitney U test.
Figure 2
Figure 2
Connexin (Cx) hemichannels (HCs) expressed in melanoma cells mediate the propagation of calcium (Ca2+) waves induced by focal photodynamic therapy (fPDT) in vivo. (A) Pooled results of fPDT trials in GCaMP6s-expressing dorsal skinfold chamber (DSC) tumors in the following conditions: Ca2+-free extracellular medium (CFEM) supplemented with ethylene glycol-bis(β-aminoethyl ether)-N,N,N′,N′-tetraacetic acid (EGTA, 5 mM); normal extracellular medium containing 2 mM of Ca2+ (NEM, control); CFEM supplemented with EGTA (5 mM) plus carbenoxolone (CBX, 100 µM) or flufenamic acid (FFA, 100 µM) or TAT-Gap19 (150 µM) or abEC1.1m (1 μM). The histogram shows the area under GCaMP6s ΔF/F0 traces (A, inset) computed between the onset of fPDT (t = 10 s) and the end of the observation time window (t = 80 s) for each bystander cell order (abscissa); pooled data [mean ± standard error of the mean (s.e.m.)] for n ≥ 6 experiments in at least 2 different tumors for each condition. a.u., arbitrary units; *, p < 0.05; ***, p < 0.001, the Kruskal-Wallis test (for post hoc pairwise comparisons, see Table S1). Data for EGTA and NEM conditions are also shown in Figure 1C; (BD) In vivo 4′,6-Diamidine-2′-phenylindole dihydrochloride (DAPI) uptake experiments: GCaMP6s-expressing DSC melanomas were incubated with DAPI (5 μM) dissolved in: CFEM supplemented with 5 mM of EGTA; NEM; CFEM supplemented with 5 mM of EGTA plus FFA (100 µM) or TAT-Gap19 (150 µM) or abEC1.1m (1 μM). Fluorescence images were acquired at 5 min intervals up to 30 min; (B) Representative images acquired before (t = 0 min) and after 30 min of DAPI incubation in EGTA conditions; scale bar: 20 µm; (C) Relative variation of nuclear DAPI fluorescence intensity [F(t)/F0] in tumor cells vs. time during dye uptake in EGTA conditions (mean ± s.e.m., n = 20 cells, 2 tumors). The red dashed line was computed by data fitting with the shown function f(t) (parameter values: a = −0.1754, b = 0.0647 min−1); (D) Box plots showing the distributions of ΔF = F(30 min) − F0 for DAPI measured in n ≥ 12 nuclei for each condition. Red horizontal bars indicate the median. ***, p < 0.001, the Kruskal-Wallis test (for post hoc pairwise comparisons, see Table S2); (E) Representative western blots for Cx43 (top) and Cx26 (bottom) expression in tumors (T) derived from B16-F10 or B16-F10-GCaMP6s cells and grown in DSCs (denoted as B16-F10 T and B16-F10-GCaMP6s T, respectively) compared with B16-F10 or B16-F10-GCaMP6s cells grown in culture dishes; graphs on the right show the corresponding relative optical density (mean ± s.e.m., n = 4 independent experiments; **, p < 0.05, ANOVA on Ranks; ***, p < 0.001, ANOVA). Detailed information about the Western blotting can be found at Figure S9. (F) Confocal fluorescence images obtained by immunostaining with antibodies selective for Cx43 (top left, green), Cx26 (bottom left, green) and MelanA (right, red) in representative sections of melanomas grown in DSCs; nuclei were stained with DAPI; scale bar: 10 μm.
Figure 3
Figure 3
Whole-cell biosensors for adenosine triphosphate (ATP) detection (ATP-WCBs) are activated by extracellular ATP released during the propagation of calcium (Ca2+) waves induced by focal photodynamic therapy (fPDT) in the dorsal skinfold chamber (DSC). (A) Schematic representation of the multiphoton microscope objective lens oscillating between two focal planes for real-time detection of ATP release during fPDT stimulation (left, GCaMP6s-expressing tumor; right, Fluo-8H-loaded ATP-WCBs); (B) Representative back-projections of ΔF = FF0 (with F0 pre-stimulus value) frames acquired from tumor (top) and ATP-WCBs (bottom) during fPDT stimulation in the absence of apyrase (−APY, left) or in its presence (+APY, 250 U/mL, right) in Ca2+-free extracellular medium (CFEM). Red circles mark the location of the photoactivation laser beam; scale bar: 20 µm; (C) Average Ca2+ responses of bystander melanoma cells (top) and ATP-WCBs (bottom) to fPDT before (left) and after (right) addition of APY to the extracellular medium; ΔF/F0 signals [mean (solid lines) ± standard error of the mean (s.e.m., dashed lines)] are shown for each bystander cell order. Results are representatives of n ≥ 3 experiments performed in 2 tumors. Vertical dashed lines mark the onset of laser irradiation (t = 5 s); (D) Effect of APY on the amplitudes of fPDT-induced Ca2+ waves in CFEM supplemented with 5 mM of EGTA; the histogram shows the area under GCaMP6s ΔF/F0 signals (A, see inset) computed for each bystander cell order in the absence of APY (−APY, green bars, also shown in Figure 1C and Figure 2A) or in its presence (+APY, black bars); data (mean ± s.e.m.) were pooled from n ≥ 6 experiments in at least 2 different melanomas for each condition; a.u., arbitrary units; **, p < 0.01; ***, p < 0.001; the Mann-Whitney U test.
Figure 4
Figure 4
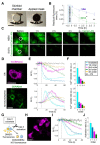
In vivo intratumor injection of ethylene glycol-bis(β-aminoethyl ether)-N,N,N′,N′-tetraacetic acid (EGTA) prior to spatially confined photodynamic therapy (scPDT) boosts bystander cell killing via calcium (Ca2+)-dependent apoptotic pathways. (AC) B16-F10 melanomas grown in the dorsal skinfold chamber (DSC) were loaded with the photosensitizer (PS) and partially irradiated (scPDT, 30 min duration, irradiance ~378 mW/cm2) after microinjection of normal extracellular medium (NEM, control conditions) or Ca2+-free extracellular medium supplemented with 5 mM of EGTA (EGTA conditions). Tumor cell demise was assayed by time-lapse microscopy using calcein-AM (co-loaded with PS); (A) DSC titanium frame (left) with applied opaque mask (right) used to restrict melanoma irradiation in scPDT experiments (central hole diameter = 1.3 mm); scale bar: 1 cm; (B) Post-irradiation variation of melanoma surface area with persistent calcein-AM fluorescence in control (NEM; n = 4, blue) and EGTA (n = 3, green) conditions. Interpolating curves (dashed lines) were computed by data fitting with the function f(t) = 1 − a + aeb(t+c) (for parameter values, see Table S3). *, p < 0.05; **, p < 0.01, two-tailed t-test; (C) Representative results of time-lapse fluorescence imaging with calcein-AM. Images were acquired before and after scPDT (within white circles) at shown time points; the black down arrow marks the time point of calcein-AM reloading in the tumors (3 h 30 min); scale bars: 1 mm; (DJ) Experiments were performed in B16-F10 syngeneic melanomas exposed to NEM, expressing one of the following genetically encoded fluorescent indicators: R-CEPIA1er, a Ca2+ indicator targeted to the endoplasmic reticulum (ER, DF, top); CEPIA2mt, a Ca2+ indicator targeted to mitochondria (DF, bottom); an indicator for caspase-3 (Cas-3) activation (GJ); (D,H) Representative fluorescence images of melanoma cells expressing the aforementioned Ca2+ (D) or Cas-3 indicators (H); scale bars: 20 μm; (E,I) Representative color-coded ΔF/F0 signals in the irradiated cell and surrounding bystander cells; black traces are representative results obtained in the absence of PS (−PS, negative control). The vertical dashed lines mark the onset of laser irradiation (t = 10 s); (F) Rates of Ca2+ signals computed up to the 4th bystander cell order as the absolute value of the average slope of the post-irradiation linear descending (ER, top) or ascending (mitochondria, bottom) trace segment. Data were pooled from n ≥ 10 experiments in at least 2 tumors for each condition and quoted as mean values ± standard error of the mean (s.e.m.); (G) Schematic representation of the mechanism of action for the fluorescent Cas-3 indicator; (J) Cas-3 activation rate computed up to the 3rd bystander cell order as the absolute value of the average slope of the linear descending post-irradiation trace segment. Data (mean ± s.e.m.) were pooled from n = 4 experiments in 2 tumors.
Figure 5
Figure 5
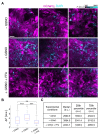
In vivo 4′,6-Diamidine-2′-phenylindole dihydrochloride (DAPI) uptake assays. (A) Representative fluorescence intensity (F) images of mCherry-expressing melanomas acquired approximately 50 µm below tumor surface after 30 min of incubation with DAPI (5 μM) dissolved in: normal extracellular medium (NEM, control conditions: −GSNO); NEM containing 1 mM of S-Nitrosoglutathione (+GSNO); NEM containing 1 mM of GSNO plus 100 µM of flufenamic acid (+GSNO +FFA); scale bar: 20 µm; a.u., arbitrary units; (B) Box plots showing the distributions of ΔF = F(30 min) − F0 (F0 = F before DAPI incubation) for DAPI fluorescence intensity measured in n ≥ 74 nuclei in −GSNO (3 tumors), +GSNO (3 tumors) or +GSNO +FFA (2 tumors) conditions; red horizontal bars represent the median; bottom and top edges of the blue boxes indicate the 25th and 75th percentiles, respectively; black tails of the boxes mark the most extreme data points in the distribution. **, p < 0.01; ***, p < 0.001, the Mann-Whitney U test; (C) Numerical values of median and quartiles for the three data distributions.
Figure 6
Figure 6
Microinjected S-Nitrosoglutathione (GSNO) enhances the efficacy of full photodynamic therapy (PDT) in murine melanoma by activating connexin hemichannels. (A) Photosensitizer (PS)-loaded melanomas grown in the dorsal skinfold chamber (DSC) and expressing mCherry were irradiated (full PDT, 60 min, irradiance ~245 mW/cm2) 20 min after microinjection of: normal extracellular medium (NEM, control conditions: −GSNO); GSNO (1 mM) dissolved in NEM (+GSNO); GSNO (1 mM) plus TAT-Gap19 (150 µM, +TAT-Gap19) dissolved in NEM or abEC1.1m (2 µM, +abEC1.1m) dissolved in NEM; tumor cell demise was assayed by time-lapse microscopy of red fluorescent mCherry. Shown are representative images acquired before and after full PDT in −GSNO and +GSNO conditions at shown time points; scale bar: 1 mm; (B) Melanoma surface area with persistent mCherry post-irradiation fluorescence in −GSNO (blue, n = 4), +GSNO (gray, n = 4), +TAT-Gap19 (magenta, n = 4) and +abEC1.1m (red, n = 4) conditions. Interpolating curves (dashed lines) are data fitting with the function f(t) = 1 − a + aeb(t+c) (for parameter values see Table S5). *, p < 0.05; **, p < 0.01, the Mann-Whitney U test; (CE) Melanomas were harvested 4 days after treatment. Controls were loaded with PS and microinjected but were not irradiated (No irradiation); (C) Tumor masses excised after treatment in each of the six conditions, scale unit: cm; (D) Tumor volumes measured by micro-computed tomography analysis; black horizontal bars mark the median. n.s., not significant; *, p < 0.05, the Kruskal-Wallis test (for post hoc pairwise comparisons see Table S6); (E) Hematoxylin and eosin staining of tumor-bearing DSC tissues exposed to full PDT in −GSNO or +GSNO conditions. Black arrows mark the edges of punch biopsies where B16-F10 melanoma cells were seeded; scale bar: 1 mm.
Figure 7
Figure 7
Schematic model for connexin (Cx) hemichannels (HC)-related signaling downstream of photosensitizer (PS) activation. (1) Reactive oxygen species (ROS), generated directly or indirectly after PS photoactivation [22], activate inositol 1,4,5-trisphosphate (IP3) receptors (Rs), promoting calcium (Ca2+) release from the endoplasmic reticulum (ER). (2) The rise in cytosolic Ca2+ concentration gates HCs from the inside, (3) permitting the release of adenosine triphosphate (ATP) from cytosol to extracellular milieu. (4) The released ATP activates metabotropic P2YRs and consequent IP3 production via G-protein-coupled activation of phospholipase C (PLC). (5) IP3 binding to IP3R in the ER potentiates ROS-mediated Ca2+ release. (6) This enhances Ca2+ uptake into the mitochondrial matrix via voltage-dependent anion-selective channel 1 (VDAC1) in the outer mitochondrial membrane (OMM) and mitochondrial Ca2+ uniporter (MCU) in the inner mitochondrial membrane (IMM). The tight spacing between ER and mitochondria, which is key for efficient ER-mitochondria Ca2+ transfer, is regulated by mitofusin (Mfn) proteins and fetal and adult testis-expressed 1 (FATE1). (7) Within the matrix, Ca2+ regulates the tricarboxylic acid (TCA) cycle by controlling the activity of three dehydrogenases, promoting increased synthesis of nicotinamide adenine dinucleotide (NADH) and flavin adenine dinucleotide (FADH2) and consequent augmented ATP production by complex V (ATP synthase) of the electron transport chain (ETC). (8) Ca2+ entry also drives potassium (K+) and water (H2O) influx into the matrix. (9) The increased internal pressure squeezes hydrogen peroxide (H2O2) out of mitochondrial cristae (C), reinforcing ROS-mediated opening of the IP3R and blockade of the Sarco-Endoplasmic Reticulum Ca2+ ATPase (SERCA) pump, which leads to irreversible ER emptying. (10) Ca2+ overload of the mitochondrial matrix enhances ROS levels and H2O2 mainly via complex I and III in the ETC, promoting mitochondrial permeability transition pore (mPTP) opening. (11) Prolonged opening of the mPTP causes depolarization of the IMM and swelling of the mitochondrial matrix, which ensues in the rupture of the OMM. (12) Consequently, cytochrome c (Cyt c) is released, thus promoting apoptotic cell death (13). ICS, intracristal space (see [57,58,60,61,62,63,64,65,66,67,68]). These events are exacerbated by nitric oxide (NO), a key diffusible byproduct of aluminum phthalocyanine chloride photoactivation in irradiated cells [20]. In bystander cells, NO concentration is increased above diffusion levels by Ca2+-dependent enzymatic production [20,21,22] and can be further increased by administration of a NO donor (S-Nitrosoglutathione), as accomplished in this article. NO favors the opening of HCs in different cell types and Cx species [48,49,69]. In this context, it potentiates the ATP release that subtends Ca2+ wave propagation. In addition, NO can inhibit the ETC, particularly complex IV, but also complex I, III, and II, by imparting modifications, such as S-nitrosation and nitration to selected residues [70]. Inhibition of complex IV by NO enhances the production of mitochondrial ROS [68]. The combination of NO with superoxide anion can generate peroxinitrite, a potentially harmful radical that drives nitration and oxidation of biomolecules [70].

Similar articles

Cited by

References

    1. Daguenet E., Louati S., Wozny A.-S., Vial N., Gras M., Guy J.-B., Vallard A., Rodriguez-Lafrasse C., Magné N. Radiation-induced bystander and abscopal effects: Important lessons from preclinical models. Br. J. Cancer. 2020;123:339–348. doi: 10.1038/s41416-020-0942-3. - DOI - PMC - PubMed
    1. Verma N., Tiku A.B. Significance and nature of bystander responses induced by various agents. Mutat. Res. Mutat. Res. 2017;773:104–121. doi: 10.1016/j.mrrev.2017.05.003. - DOI - PubMed
    1. Dahle J. The bystander effect in photodynamic inactivation of cells. Biochim. Biophys. Acta Gen. Subj. 2000;1475:273–280. doi: 10.1016/S0304-4165(00)00077-5. - DOI - PubMed
    1. Dahle J., Angell-Petersen E., Steen H.B., Moan J. Bystander effects in cell death induced by photodynamic treatment UVA radiation and inhibitors of ATP synthesis. Photochem. Photobiol. 2001;73:378–387. doi: 10.1562/0031-8655(2001)073<0378:BEICDI>2.0.CO;2. - DOI - PubMed
    1. Dabrowska A., Goś M., Janik P. Bystander effect induced by photodynamically or heat-injured ovarian carcinoma cells (OVP10) In Vitro. Med. Sci. Monit. 2005;11:324. - PubMed

LinkOut - more resources