. 2021 Sep 25;12(10):1496.
doi: 10.3390/genes12101496.

Exploring Semi-Quantitative Metagenomic Studies Using Oxford Nanopore Sequencing: A Computational and Experimental Protocol

Affiliations

Exploring Semi-Quantitative Metagenomic Studies Using Oxford Nanopore Sequencing: A Computational and Experimental Protocol

Rohia Alili et al. Genes (Basel). .

Abstract

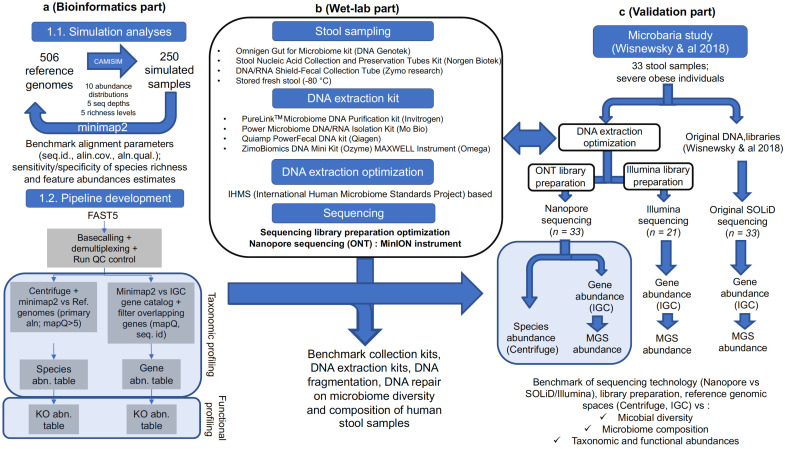
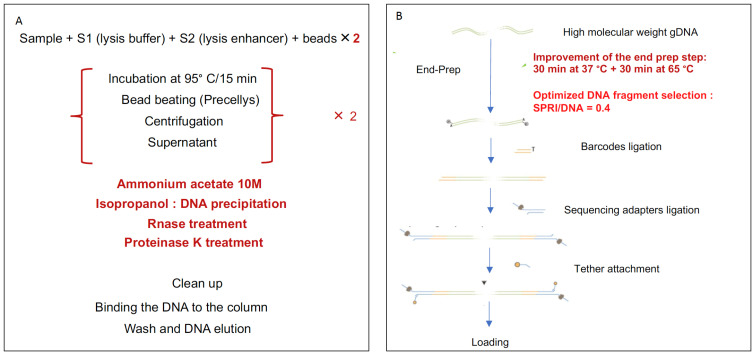
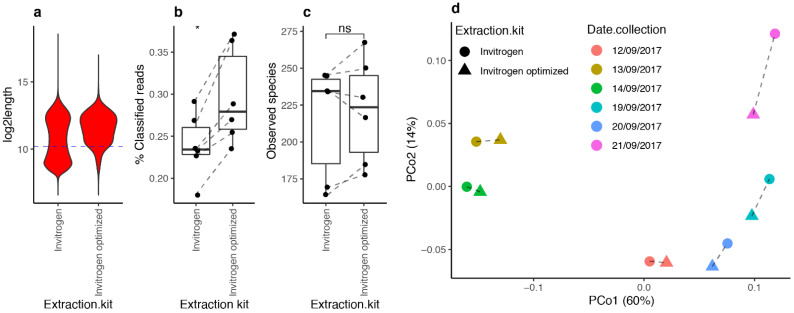
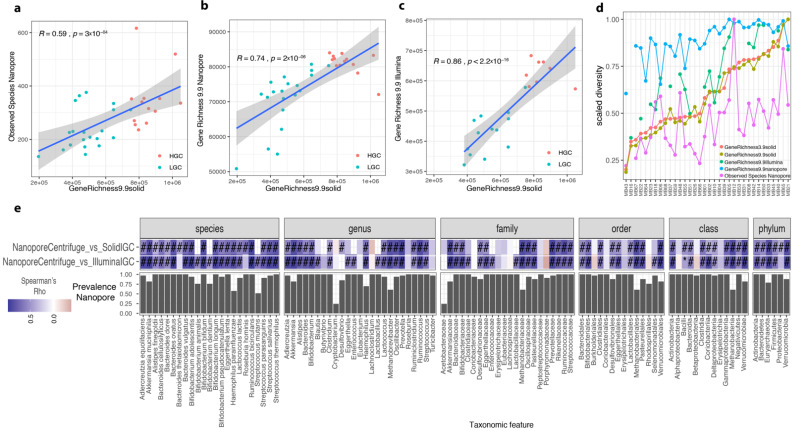
The gut microbiome plays a major role in chronic diseases, of which several are characterized by an altered composition and diversity of bacterial communities. Large-scale sequencing projects allowed for characterizing the perturbations of these communities. However, translating these discoveries into clinical applications remains a challenge. To facilitate routine implementation of microbiome profiling in clinical settings, portable, real-time, and low-cost sequencing technologies are needed. Here, we propose a computational and experimental protocol for whole-genome semi-quantitative metagenomic studies of human gut microbiome with Oxford Nanopore sequencing technology (ONT) that could be applied to other microbial ecosystems. We developed a bioinformatics protocol to analyze ONT sequences taxonomically and functionally and optimized preanalytic protocols, including stool collection and DNA extraction methods to maximize read length. This is a critical parameter for the sequence alignment and classification. Our protocol was evaluated using simulations of metagenomic communities, which reflect naturally occurring compositional variations. Next, we validated both protocols using stool samples from a bariatric surgery cohort, sequenced with ONT, Illumina, and SOLiD technologies. Results revealed similar diversity and microbial composition profiles. This protocol can be implemented in a clinical or research setting, bringing rapid personalized whole-genome profiling of target microbiome species.

Keywords: MinION; Oxford Nanopore Technologies; gut microbiota; microbial DNA extraction; microbiome; obesity; semi-quantitative metagenomics; sequencing; simulation.


Conflict of interest statement

K.C. is a consultant for Danone Research, LNC Therapeutics, and Confo Therapeutics for work unassociated with the present study. J.-D.Z. is a consultant for Quinten for work unassociated with the present study.

Figures

Figure 1
Figure 1
Summary of the workflow: (a) Simulated data processing. (b) Wet-lab optimization. (c) Summary of ONT sequencing comparison with Illumina and SOLiD technologies. IGC: Integrated Gene Catalog, MGS: metagenomic species, ONT: Oxford Nanopore Technologies.
Figure 2
Figure 2
Metagenomic profiles from simulated samples between minimap2 results and minimap2 results filtered from secondary alignments. (a) Boxplots of mean lengths of ONT reads of 250 simulated samples (y-axis) between those aligned and unaligned over the 506 reference genomes from minimap2 results (x-axis). (b) Boxplots of recall values of species richness estimates in 250 simulated samples (y-axis) between metagenomic profiles inferred from all minimap2 alignments (mmap2 raw) and from minimap2 primary alignments only (mmap2APfilt, x-axis). For simulated samples not reaching the recall of 1, the sequencing depth is highlighted in different colors. (c) Boxplots of precision values of species richness estimates in 250 simulated samples (y-axis) between metagenomic profiles inferred from all minimap2 alignments (mmap2 raw) and from minimap2 primary alignments only (mmap2APfilt, x-axis). (d) PCoA of metagenomic profiles from the reference and 250 simulated samples inferred from all minimap2 alignments (mmap2raw) and from minimap2 primary alignments only (mmap2APfilt, x-axis). Dashed lines connect points coming from the same sample (reference, simulated ones; 3 points per sample).
Figure 3
Figure 3
Impact of filtering minimap2 primary alignments of Nanopore reads at different thresholds of mapQ score. Boxplots of recall (a) and precision (b) values of species richness estimates in 250 simulated samples (y-axis) between metagenomic profiles inferred from primary alignments of ONT reads filtered by different thresholds of mapQ score (from 0 to 50; x-axis) stratified by the number of species in reference metagenomic profiles. (c) Boxplots of F1 scores (harmonic mean of precision and recall) in species richness estimates between simulated datasets filtered by alignment identity and mapQ scores stratified by the number of species in reference metagenomic profiles. p-Values of product of Wilcoxon rank-sum tests are shown for each pairwise comparison. (d) Boxplots of Spearman rho coefficients in correlation analyses between taxonomic profiles of reference and simulated samples (y-axis) at different thresholds of sequence identity (from 0% to 90%; x-axis) stratified by the number of species in reference metagenomic profiles. Points are colored according to the sequencing depth of simulated samples.
Figure 4
Figure 4
DNA extraction kits, fragmentation, and end-repair impact on human stool metagenomic composition from ONT sequencing data. Read length distributions of ONT reads across different DNA extraction kits ((a) n = 29) and between DNA fragmentation ((b) n = 6 paired samples fragmented/nonfragmented) and DNA end repair ((c) n = 6 paired samples end vs. no end repair) steps for Invitrogen samples. Blue dashed lines correspond to the median value of log2-transformed read lengths used to stratify reads as long or short. (d) Differences between the fraction of classified reads by the Centrifuge approach between long and short reads for 29 samples in panel (a). (e) Differences in microbial diversity (observed species) between extraction kits (n = 29). (f) Differences in microbial diversity (observed species) by DNA fragmentation (n = 4 paired samples). (g) Differences in microbial diversity (observed species) by DNA end-repair step (n = 4 paired samples). (h) PCoA ordination of 29 samples in panel (a) colored by extraction kit. (i) PCoA ordination of 8 samples in panel (f). (j) PCoA of 8 samples of panel (g) colored by DNA end-repair step. ns (panel (f,g)) = nonsignificant differences in paired Wilcoxon rank-sum tests. **** = p-value < 0.0001 in paired Wilcoxon rank-sum test.
Figure 5
Figure 5
Optimization of DNA extraction and library preparation protocols. (A) Steps of the bacterial DNA extraction protocol. In black, the steps include the protocol of the Invitrogen kit, in red, the improvement steps recommended by the IHMS consortium. (B) Improvement of library preparation by the application of NEB recommendation and decrease in the SPRI/DNA ratio.
Figure 6
Figure 6
Impact of Invitrogen optimized protocol on human stool metagenomic composition from Nanopore sequencing data. (a) Read length distributions of ONT reads in n = 6 samples extracted with original (Invitrogen) and optimized (Invitrogen optimized) protocols. Blue dashed lines correspond to the median value of log2-transformed read lengths used to stratify reads as long or short. (b) Differences in the fraction of classified reads between protocols (n = 6 paired samples; * = p-value < 0.05, paired Wilcoxon rank-sum test). (c) Differences in microbial diversity between protocols (n = 6 paired samples; ns = p-value > 0.05, paired Wilcoxon rank-sum test). (d) PCoA ordination from genus-level beta-diversity matrix (Bray–Curtis) of 12 samples extracted with Invitrogen optimized kit and original Invitrogen kit. Dashed lines connect samples coming from the same fecal stool sample collected at different dates.
Figure 7
Figure 7
Comparison of semi-quantitative metagenomic profiles of Microbaria samples between sequencing technologies. Correlation between gene richness from SOLiD sequencing (x-axis) and observed species inferred from Nanopore (ONT) sequencing data using Centrifuge approach ((a) n = 33), gene richness inferred from ONT sequencing data ((b) n = 33), and gene richness inferred from Illumina sequencing data ((c) n = 21). The strength of the similarities was evaluated with Spearman correlation test (Spearman rho and p-value included in the scatterplots). (d) Line plots representing the scaled diversity (from 0 to 1) of Microbaria samples from different diversity metrics based on SOLiD, ONT, and Illumina sequencing data. Samples in x-axis are ordered based on the scaled diversity of the gene richness from the original Microbaria study (GeneRichness3.9SOLiD). (e) Heatmap of Spearman rho representing similarities in abundance vectors of taxonomic features in x-axis between ONT quantifications based on Centrifuge data and Illumina and SOLiD quantifications based on metagenomic species of the IGC (y-axis; #= p-value adj < 0.05, BH method; * = p-value < 0.05). On the bottom of the heatmap is represented the prevalence of taxonomic features in x-axis based on ONT sequencing data.

References

    1. Prifti E., Chevaleyre Y., Hanczar B., Belda E., Danchin A., Clément K., Zucker J.D. Interpretable and accurate prediction models for metagenomics data. Gigascience. 2020;9 doi: 10.1093/gigascience/giaa010. - DOI - PMC - PubMed
    1. Qin J., Li R., Raes J., Arumugam M., Burgdorf K.S., Manichanh C., Nielsen T., Pons N., Levenez F., Yamada T., et al. A human gut microbial gene catalogue established by metagenomic sequencing. Nature. 2010;464:59–65. doi: 10.1038/nature08821. - DOI - PMC - PubMed
    1. Vieira-Silva S., Falony G., Belda E., Nielsen T., Aron-Wisnewsky J., Chakaroun R., Forslund S.K., Assmann K., Valles-Colomer M., Nguyen T.T.D., et al. Statin Therapy Is Associated with Lower Prevalence of Gut Microbiota Dysbiosis. Nature. 2020;581:310–315. doi: 10.1038/s41586-020-2269-x. - DOI - PubMed
    1. Aron-Wisnewsky J., Gaborit B., Dutour A., Clement K. Gut microbiota and non-alcoholic fatty liver disease: New insights. Clin. Microbiol. Infect. 2013;19:338–348. doi: 10.1111/1469-0691.12140. - DOI - PubMed
    1. Aron-Wisnewsky J., Vigliotti C., Witjes J., Le P., Holleboom A.G., Verheij J., Nieuwdorp M., Clément K. Gut microbiota and human NAFLD: Disentangling microbial signatures from metabolic disorders. Nat. Rev. Gastroenterol. Hepatol. 2020;17:279–297. doi: 10.1038/s41575-020-0269-9. - DOI - PubMed

Publication types

MeSH terms

LinkOut - more resources