. 2021 Sep 30;12(10):1558.
doi: 10.3390/genes12101558.

Improved SNV Discovery in Barcode-Stratified scRNA-seq Alignments

Affiliations

Improved SNV Discovery in Barcode-Stratified scRNA-seq Alignments

Prashant N M et al. Genes (Basel). .

Abstract

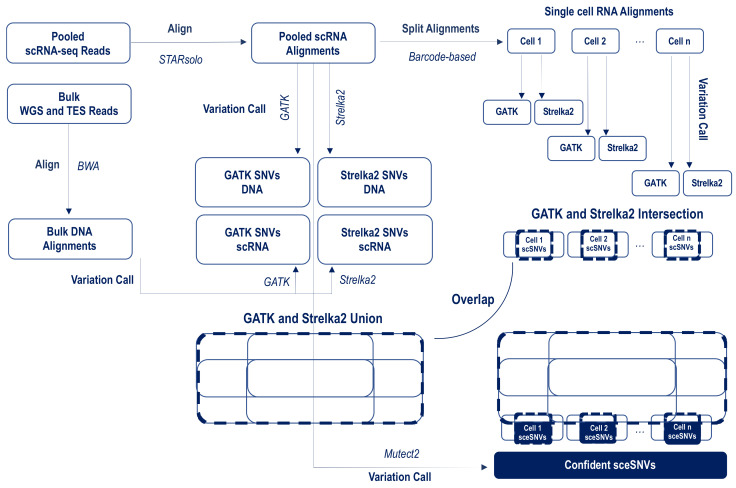
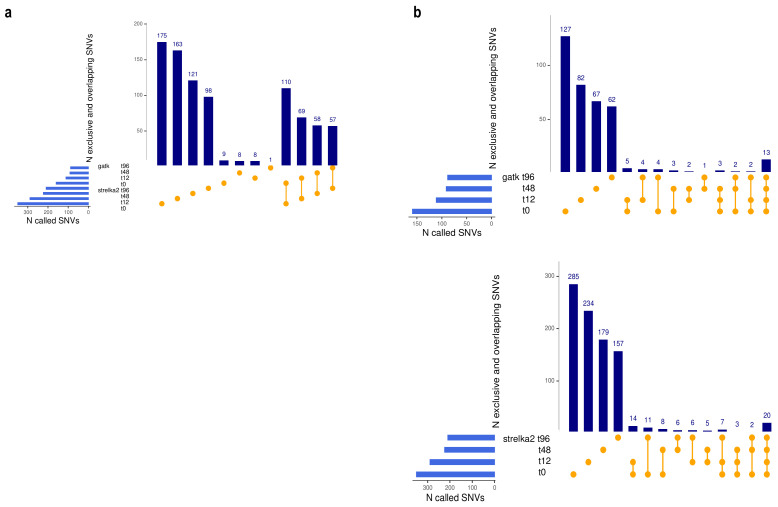
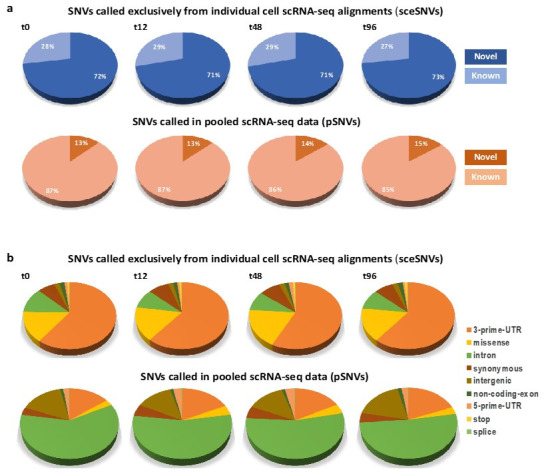
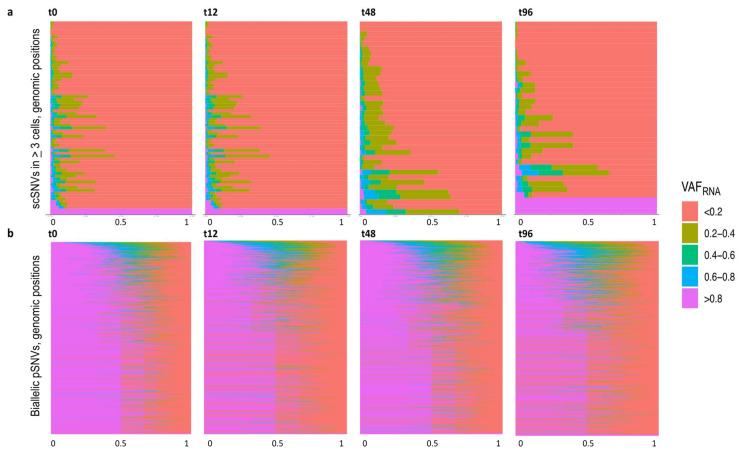
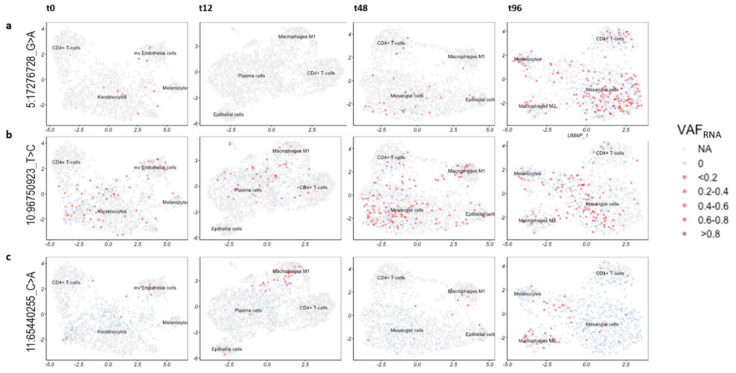
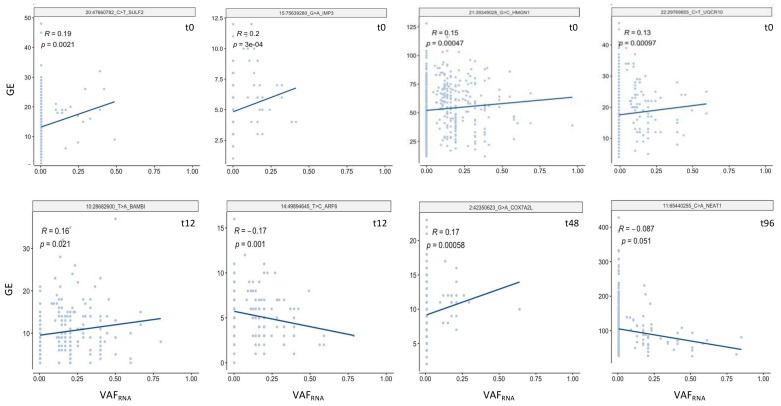
Currently, the detection of single nucleotide variants (SNVs) from 10 x Genomics single-cell RNA sequencing data (scRNA-seq) is typically performed on the pooled sequencing reads across all cells in a sample. Here, we assess the gaining of information regarding SNV assessments from individual cell scRNA-seq data, wherein the alignments are split by cellular barcode prior to the variant call. We also reanalyze publicly available data on the MCF7 cell line during anticancer treatment. We assessed SNV calls by three variant callers-GATK, Strelka2, and Mutect2, in combination with a method for the cell-level tabulation of the sequencing read counts bearing variant alleles-SCReadCounts (single-cell read counts). Our analysis shows that variant calls on individual cell alignments identify at least a two-fold higher number of SNVs as compared to the pooled scRNA-seq; these SNVs are enriched in novel variants and in stop-codon and missense substitutions. Our study indicates an immense potential of SNV calls from individual cell scRNA-seq data and emphasizes the need for cell-level variant detection approaches and tools, which can contribute to the understanding of the cellular heterogeneity and the relationships to phenotypes, and help elucidate somatic mutation evolution and functionality.

Keywords: SNP; SNV; SNV expression; expressed SNVs; mutation; scRNA-seq; somatic mutation.


Conflict of interest statement

The authors declare no conflict of interest.

Figures

Figure 1
Figure 1
Analytical workflow for the identification of confident SNVs calls exclusively in the individual scRNA-seq alignments. The raw sequencing reads were aligned to GRCh38, using BWA for the DNA and STARsolo for the RNA data. GATK and Strelka were applied in parallel on both the pooled and individual scRNA-seq alignments. For the pooled/bulk data, all SNVs called by either GATK or Strelka2 SNVs were retained; for the individual alignments, the SNVs that were called confidently by both GATK and Strelka2 in each cell were retained. Single-cell exclusive SNVs (sceSNVs) were then outlined via overlapping the union of GATK and Strelka2 calls from the pooled/bulk scRNA and DNA, and the intersection of the GATK and Strelka2 calls from each individual alignment. To assess what percentage of sceSNVs are identifiable with callers specifically targeting SNVs in a low proportion of cells, we applied Mutect2 on the pooled alignments.
Figure 2
Figure 2
(a). Concordance between GATK and Strelka2 in variant calling from individual cell alignments. A higher number of SNVs were called by Strelka2, which also identifies the vast majority of the GATK calls. Note that the UpSet plots show the first 12 of all possible overlaps. (b). Shared and exclusive sceSNVs called by GATK (top) and Strelka2 (bottom) from scRNA-seq data generated at four time-points during drug treatment, showing the low overlap indicative of de novo SNVs.
Figure 3
Figure 3
(a). Percentage of novel and known SNVs called exclusively in the individual alignments (sceSNVs, top) and in the pooled scRNA-seq data (pSNVs, bottom). An approximately 5-fold higher percentage of novel SNVs was seen in the individual cell alignments. (b). Distribution of functional annotations among the SNVs called exclusively in the individual alignments (top), as compared to the pooled scRNA-seq data (bottom). Significantly higher proportions of 3’-prime-UTR, missense and stop-codon SNVs were called in the individual alignments.
Figure 4
Figure 4
(a). ScVAFRNA estimated at positions covered by a minimum of 3 sequencing reads (minR = 3) for sceSNVs called in 3 and more cells per dataset (y-axis). The majority of the positions have a VAFRNA up to 0.2. Note that the plot is inclusive for all the cells with minR = 3 in the corresponding position, including those covered with reference reads only. The percentage of cells with a corresponding VAFRNA is displayed on the x-axis. (b). ScVAFRNA estimated at those positions covered by a minimum of 3 sequencing reads for biallelic pSNVs (y-axis). For most of the pSNVs, the VAFRNA distribution is centered around 0.5, which is expected for germline heterozygous SNVs not subjected to monoallelic expression.
Figure 5
Figure 5
Two-dimensional UMAP projections with quantitative visualization (red) of sceSNVs VAFRNA. The light blue color indicates that the position is covered by at least 3 unique sequencing reads bearing the reference nucleotide, thereby signifying non-0 expression at the position. (a). SNV rs1161976348 (5:17276721_G > A) in the 3’-UTR of the gene BASP1. A higher proportion of cells appear to express the SNV at later time-points post-anti-cancer treatment, especially at t96. (b). Novel intergenic SNV (10:96750923_T > C) showing a relatively even distribution across the different cell types and clusters of the 4 post-treatment time-points. (c). Novel SNV positioned at 11:65440255 (C > A) in a non-coding exon of the gene NEAT1, expressed preferentially in the microphages.
Figure 6
Figure 6
Examples of significant (FDR  =  0.05) cis-scReQTL correlations between sceSNVs and the expression of their harboring gene.

References

    1. Zhou W., Yang F., Xu Z., Luo M., Wang P., Guo Y., Nie H., Yao L., Jiang Q. Comprehensive Analysis of Copy Number Variations in Kidney Cancer by Single-Cell Exome Sequencing. Front. Genet. 2020;10:1379. doi: 10.3389/fgene.2019.01379. - DOI - PMC - PubMed
    1. Zhang L., Dong X., Lee M., Maslov A.Y., Wang T., Vijg J. Single-cell whole-genome sequencing reveals the functional landscape of somatic mutations in B lymphocytes across the human lifespan. Proc. Natl. Acad. Sci. USA. 2019;116:9014–9019. doi: 10.1073/pnas.1902510116. - DOI - PMC - PubMed
    1. Laks E., McPherson A., Zahn H., Lai D., Steif A., Brimhall J., Biele J., Wang B., Masud T., Ting J., et al. Clonal Decomposition and DNA Replication States Defined by Scaled Single-Cell Genome Sequencing. Cell. 2019;179:1207–1221.e22. doi: 10.1016/j.cell.2019.10.026. - DOI - PMC - PubMed
    1. Yin Y., Jiang Y., Lam K.-W.G., Berletch J.B., Disteche C.M., Noble W.S., Steemers F.J., Camerini-Otero R.D., Adey A.C., Shendure J. High-Throughput Single-Cell Sequencing with Linear Amplification. Mol. Cell. 2019;76:676–690.e10. doi: 10.1016/j.molcel.2019.08.002. - DOI - PMC - PubMed
    1. Ross E., Markowetz F. OncoNEM: Inferring tumor evolution from single-cell sequencing data. Genome Biol. 2016;17:1–14. doi: 10.1186/s13059-016-0929-9. - DOI - PMC - PubMed

Publication types

LinkOut - more resources