. 2021 Oct 14;12(10):1619.
doi: 10.3390/genes12101619.

More Than a Moggy; A Population Genetics Analysis of the United Kingdom's Non-Pedigree Cats

Affiliations

More Than a Moggy; A Population Genetics Analysis of the United Kingdom's Non-Pedigree Cats

Jennifer Irving McGrath et al. Genes (Basel). .

Abstract

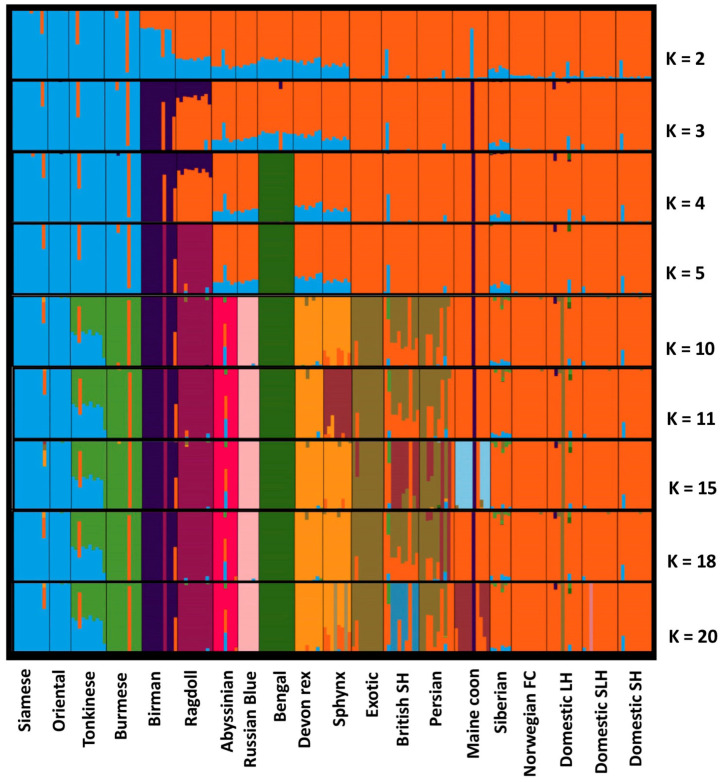
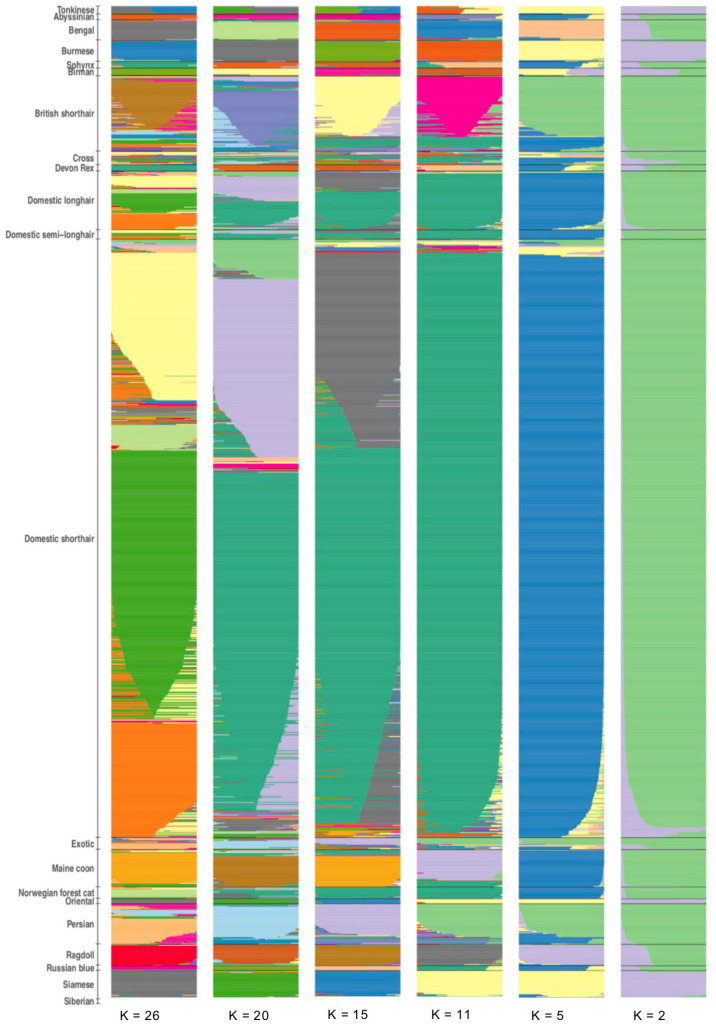
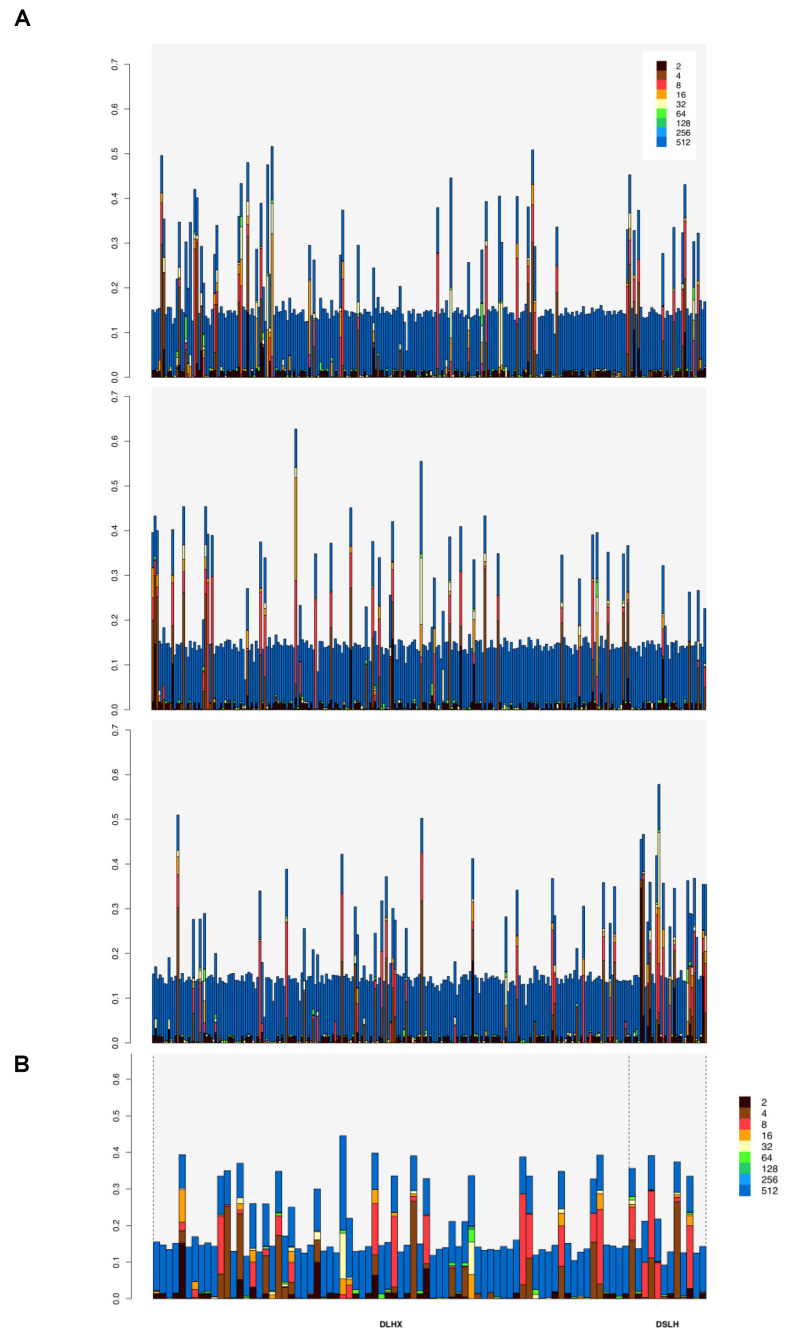
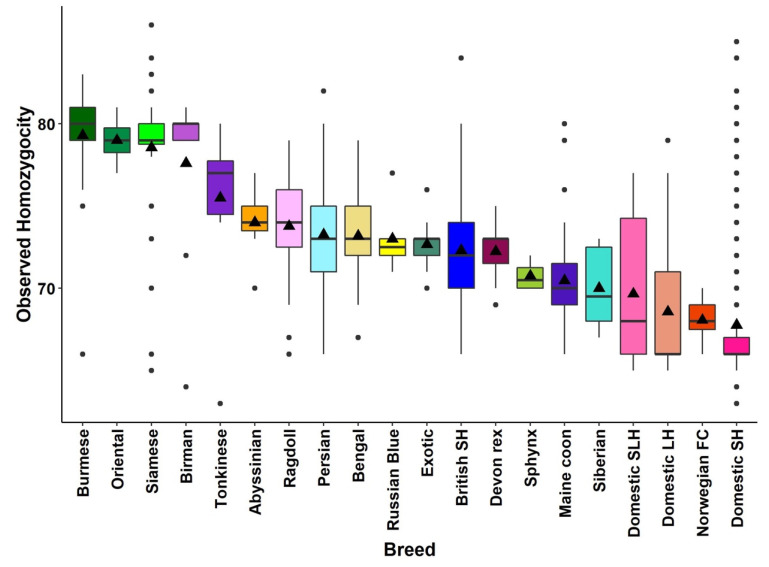
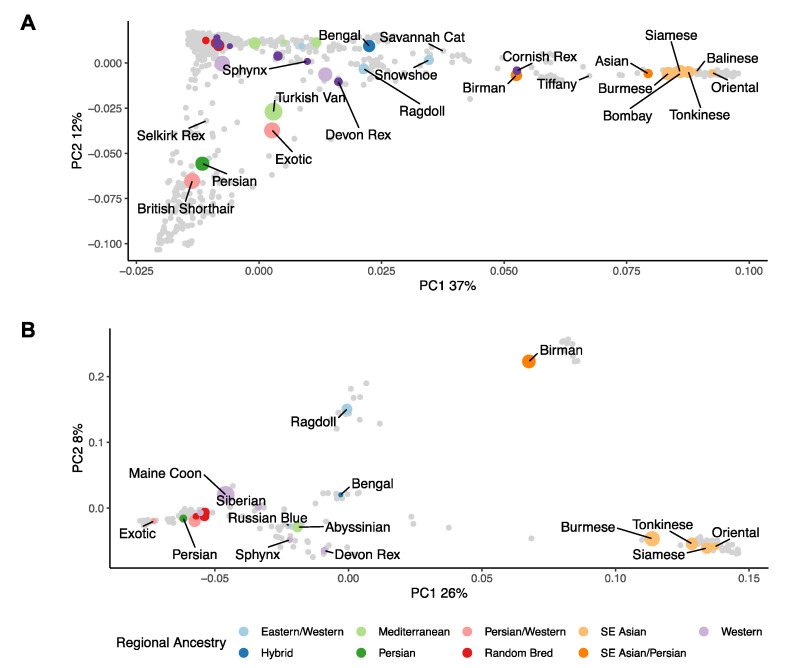
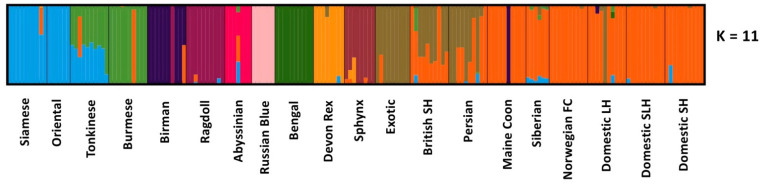
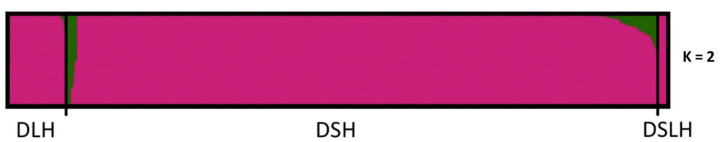
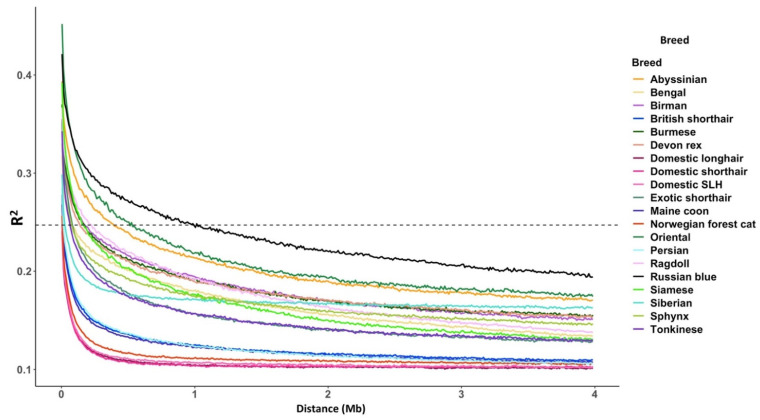
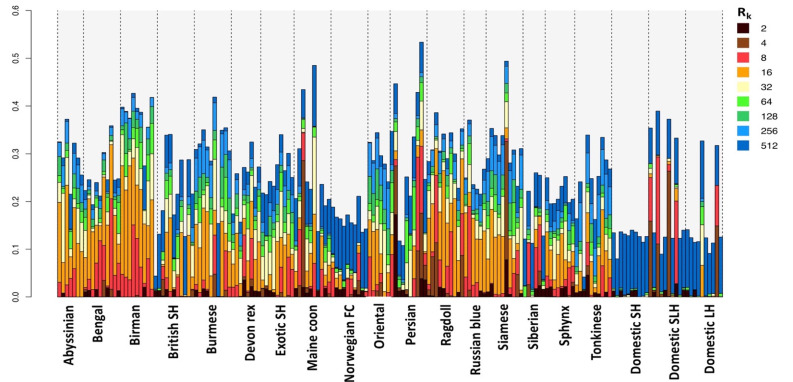
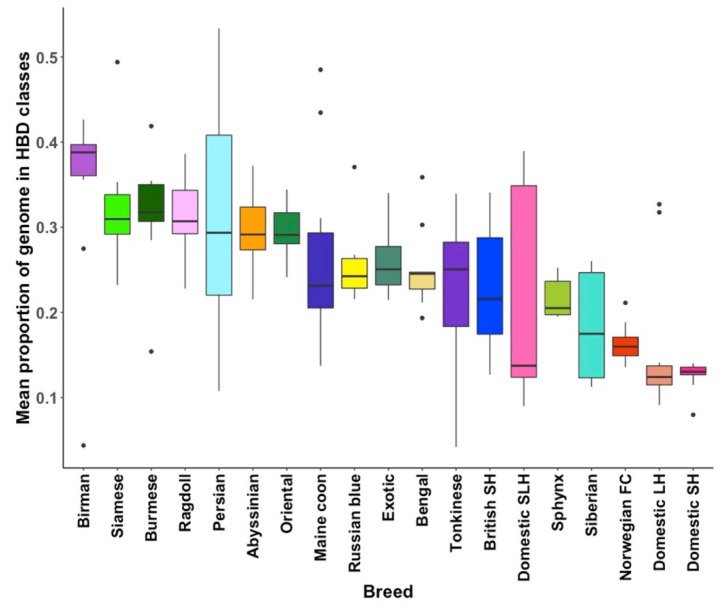
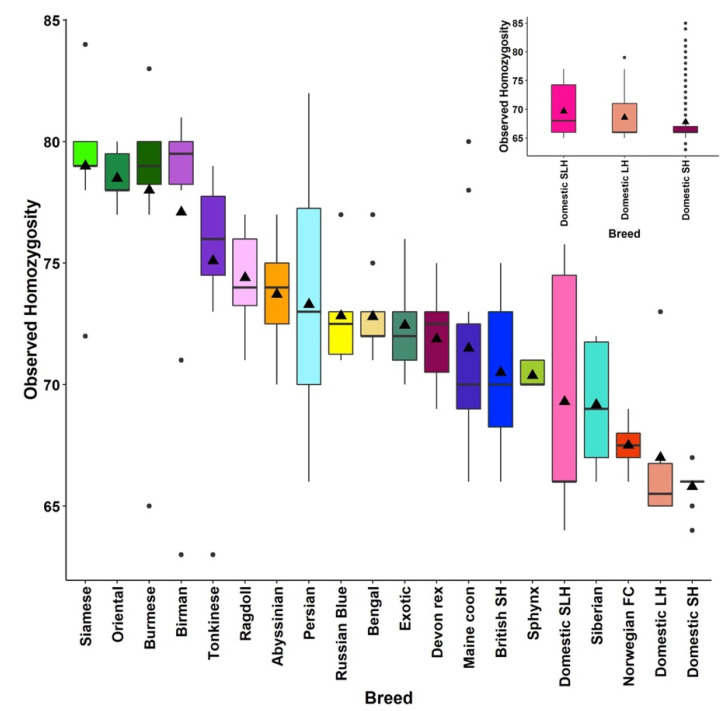
The domestic cat is one of the most popular pets in the world. It is estimated that 89-92% of domestic cats in the UK are non-pedigree Domestic shorthair (DSH), Domestic longhair (DLH), or Domestic semi-longhair cats (DSLH). Despite their popularity, little is known of the UK non-pedigree cats' population structure and breeding dynamics. Using a custom designed single nucleotide variant (SNV) array, this study investigated the population genetics of 1344 UK cats. Principal components analysis (PCA) and fastSTRUCTURE analysis verified that the UK's DSH, DLH, and DSLH cats are random-bred, rather than admixed, mix breed, or crossbred. In contrast to pedigree cats, the linkage disequilibrium of these random-bred cats was least extensive and decayed rapidly. Homozygosity by descent (HBD) analysis showed the majority of non-pedigree cats had proportionally less of their genome in HBD segments compared to pedigree cats, and that these segments were older. Together, these findings suggest that the DSH, DLH, and DSLH cats should be considered as a population of random-bred cats rather than a crossbred or pedigree-admixed cat. Unexpectedly, 19% of random-bred cat genomes displayed a higher proportion of HBD segments associated with more recent inbreeding events. Therefore, while non-pedigree cats as a whole are genetically diverse, they are not impervious to inbreeding and its health risks.

Keywords: SNV; autozygosity; cat; genotype; inbreeding; population genetics; random-bred; structure.


Conflict of interest statement

Jennifer Irving McGrath is a recipient of the Hills Pet Nutrition PhD studentship at the University of Edinburgh. Jeffrey J. Schoenebeck, Richard Mellanby, and Danielle Gunn-Moore received research support from Hills Pet Nutrition. Jeffrey A. Brockman and Regina Hollar are employees of Hills Pet Nutrition. Alison Collings is an employee of Idexx Laboratories. Roger Powell is an employee and co-founder of DragonVet Consulting Ltd. Rob D Foale and Nicola Thurley are employees of Dick White Referrals.

Figures

Figure A1
Figure A1
IBS matrix of the balanced data ordered by hierarchical clustering.
Figure A2
Figure A2
Principal components of the full dataset coloured by breed/group.
Figure A3
Figure A3
PCA for three additional balanced datasets (randomly chosen). Comparison of panel A to other panels’ PC2 axes reveals instability in the ancestry described by this PC.
Figure A4
Figure A4
Combinations of PC1-PC4 for the balanced dataset. Coloured points reflect regional ancestry while the circle size reflects the maximal standard deviation across the depicted PCs.
Figure A5
Figure A5
fastSTRUCTURE analysis on the balanced dataset. Each column represents an individual cat. Each cluster (K) is represented by a unique colour. The model complexity maximizing marginal likelihood was K= 10. Model components used to explain structure in the dataset (Kc) was K = 11. This suggests that 11 is the minimum number of populations in the balanced dataset that have a cumulative ancestry contribution of at least 99.99%.
Figure A6
Figure A6
FastSTRUCTURE analysis of the full dataset (showing only breeds with 10 or more samples for display purposes). The model complexity that maximised marginal likelihood was K = 26, whilst model components used to explain structure in the data were K = 11.
Figure A7
Figure A7
Genomic content of homozygosity by descent (HBD) segments domestic cats. HBD segments were classified by segments’ ages with respect to inferred generation time. The colour legend indicates the HBD class, defined by Rk, to reflect the inheritance of HBD from common ancestors across many generations. (A) Genomic content of HBD segments for DSH cats (n = 754) and (B) of the DLH cats (n = 74) cats and DSLH cats (n = 12).
Figure A8
Figure A8
The observed homozygosity of all samples in the full dataset, only showing breeds included in the balanced dataset.
Figure 1
Figure 1
Principal component analysis (PCA). (A) PCA analysis for all 1290 samples. (B) PCA analysis for all samples in the balanced dataset. A subset of breeds is labelled to avoid overplotting.
Figure 2
Figure 2
fastSTRUCTURE analysis on the balanced dataset. Each column represents an individual cat. Each cluster (K) is represented by a unique colour. The model component used to explain structure in the dataset (Kc) was K = 11.
Figure 3
Figure 3
fastSTRUCTURE analysis of 840 DSH, DLH, and DSLH cats. At K = 2, 91% (n = 772) random-bred cats had little evidence of admixture. Model complexity that maximized marginal likelihood was K = 2, and the model components used to explain structure in the data were K = 2.
Figure 4
Figure 4
The genome wide rate of linkage disequilibrium decay. The dashed line marks R2 = 0.247 the maximum R squared in the random-bred population.
Figure 5
Figure 5
Genomic content of homozygosity by descent (HBD) segments. HBD segments were classified by segments’ ages with respect to inferred generation time. The colour legend indicates the HBD class rates, defined by Rk. The rate of a class is equal to twice the number of generations to the common ancestors associated with that class [37].
Figure 6
Figure 6
A boxplot diagram representing the mean proportion of each breed’s genome partitioned into HBD segments. On average, random-bred (i.e., DSH, DLH, DSLH) cats have the lowest proportion of their genome in HBD segments, whilst the Birmans had the highest proportion of their genome in HBD segments.
Figure 7
Figure 7
A boxplot diagram, representing the observed homozygosity for the balanced dataset, the range for the random-bred cats (i.e., DSH, DLH, and DSLH) is 64–76%. When all random-bred cats in the full dataset are examined, the range of observed homozygosity is 63–85% (inset). The black triangle symbol represents the mean observed homozygosity.

References

    1. Statista Cats in the United States Since 2000. [(accessed on 3 March 2021)]. Available online: https://www.statista.com/statistics/198102/cats-in-the-united-states-sin....
    1. PDSA PDSA Animal Welfare (PAW) Report. [(accessed on 1 February 2021)]. Available online: https://www.pdsa.org.uk/media/10540/pdsa-paw-report-2020.pdf.
    1. O’Neill D., Church D., McGreevy P., Thomson P., Brodbelt D. Prevalence of disorders recorded in cats attending primary-care veterinary practices in England. Veter. J. 2014;202:286–291. doi: 10.1016/j.tvjl.2014.08.004. - DOI - PubMed
    1. O’Neill D.G., Church D.B., McGreevy P., Thomson P., Brodbelt D. Longevity and mortality of cats attending primary care veterinary practices in England. J. Feline Med. Surg. 2014;17:125–133. doi: 10.1177/1098612X14536176. - DOI - PMC - PubMed
    1. Lipinski M.J., Froenicke L., Baysac K.C., Billings N.C., Leutenegger C.M., Levy A.M., Longeri M., Niini T., Ozpinar H., Slater M.R., et al. The ascent of cat breeds: Genetic evaluations of breeds and worldwide random-bred populations. Genomics. 2008;91:12–21. doi: 10.1016/j.ygeno.2007.10.009. - DOI - PMC - PubMed

Publication types

LinkOut - more resources