. 2021 Sep 22;10(10):946.
doi: 10.3390/biology10100946.

Associations of Hyperactivity and Inattention Scores with Theta and Beta Oscillatory Dynamics of EEG in Stop-Signal Task in Healthy Children 7-10 Years Old

Affiliations

Associations of Hyperactivity and Inattention Scores with Theta and Beta Oscillatory Dynamics of EEG in Stop-Signal Task in Healthy Children 7-10 Years Old

Andrey V Bocharov et al. Biology (Basel). .

Abstract

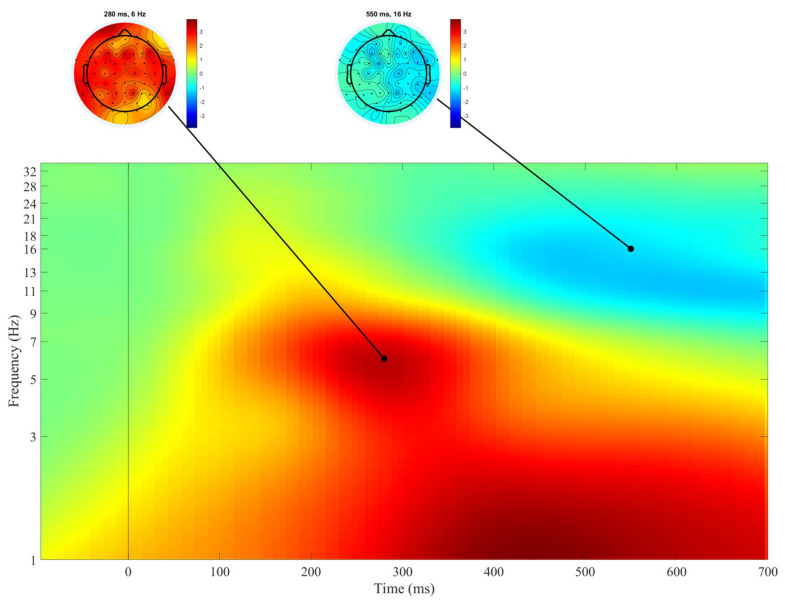
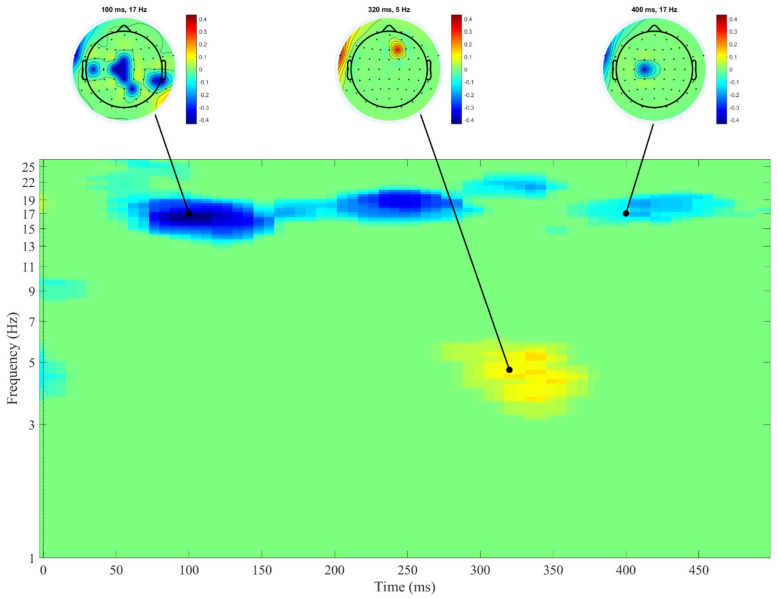
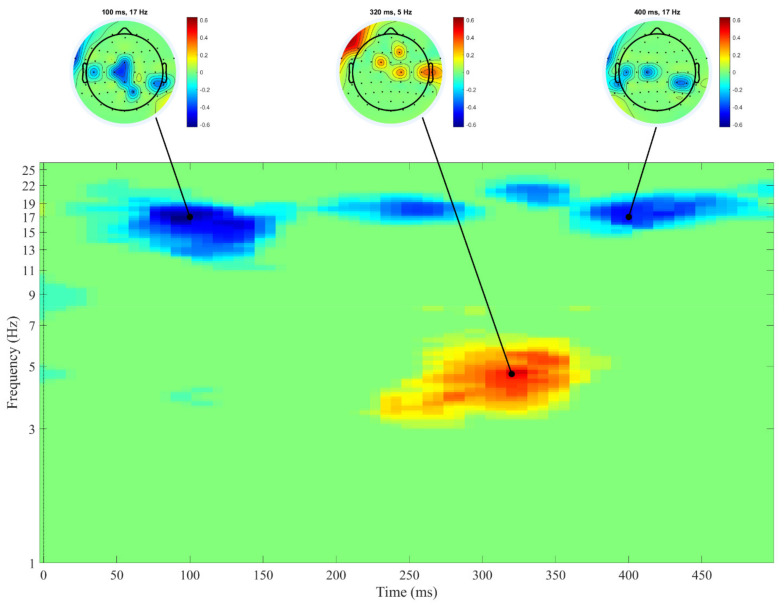
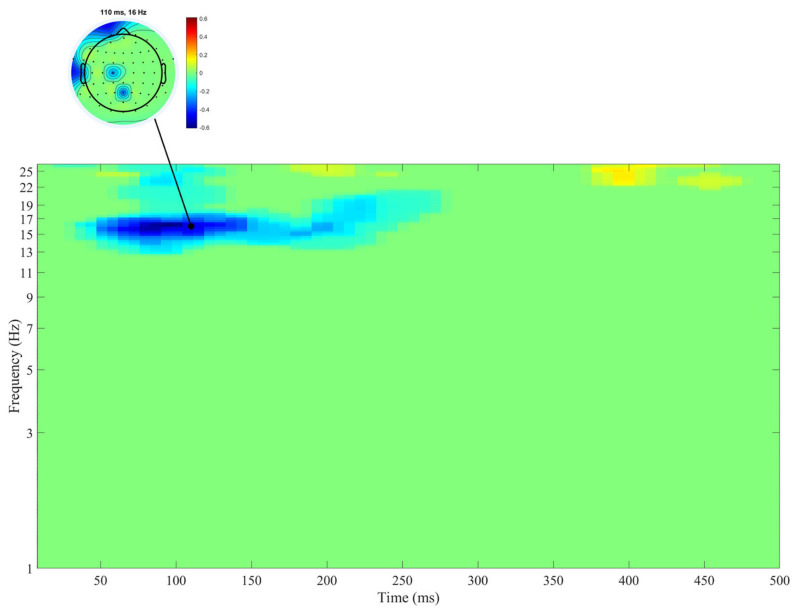
In the current study, we aimed to investigate the associations between the natural variability in hyperactivity and inattention scores, as well as their combination with EEG oscillatory responses in the Stop-Signal task in a sample of healthy children. During performance, the Stop-Signal task EEGs were recorded in 94 Caucasian children (40 girls) from 7 to 10 years. Hyperactivity/inattention and inattention scores positively correlated with RT variability. Hyperactivity/inattention and inattention scores negatively correlated with an increase in beta spectral power in the first 200 ms after presentation of the Go stimulus. Such results are in line with the lack of arousal model in ADHD children and can be associated with less sensory arousal in the early stages of perception in children with symptoms of inattention. The subsequent greater increase in theta rhythm at about 300 ms after presentation of the Go stimulus in children with higher inattention scores may be associated with increased attention processes and compensation for insufficient vigilance in the early stages of perception.

Keywords: ADHD; Stop-Signal task; beta oscillations; children; hyperactivity; inattention; theta oscillations.


Conflict of interest statement

The authors declare no conflict of interest. The funders had no role in the design of the study, in the collection, analyses, or interpretation of data, in the writing of the manuscript, in the decision to publish the results.

Figures

Figure 1
Figure 1
Averaged event-related spectral perturbations (ERSPs) (log test–log baseline) across all electrodes and all subjects in the Go condition. The cortical distribution of the most pronounced effects is displayed by the cortical maps at the top of the figure. An increase in spectral power is illustrated by warm colors, a decrease in spectral power by cool colors. The moment when the stimulus was presented is represented by 0. n = 94.
Figure 2
Figure 2
Correlations between hyperactivity/inattention scores and ERSPs after the presentation of Go stimulus. Positive correlation coefficients are shown in warm colors, negative correlation coefficients are shown in cool colors. Darker colors correspond to stronger correlations (see vertical bars for exact values). Time-frequency areas with non-significant correlation coefficients are shown in green. The moment when the stimulus was presented is represented by 0. Heads at the top of the figure display the distribution of significant correlation coefficients across the electrodes. n = 94.
Figure 3
Figure 3
Correlations between inattention scores and ERSPs after the presentation of the Go stimulus. Positive correlation coefficients are shown in warm colors, negative correlation coefficients are shown in cool colors. Darker colors correspond to stronger correlations (see vertical bars for exact values). Time-frequency areas with non-significant correlation coefficients are shown in green. The moment when the stimulus was presented is represented by 0. Heads at the top of the figure display the distribution of significant correlation coefficients in the maps of electrodes. n = 94.
Figure 4
Figure 4
Correlations between SD RTs and ERSPs after the presentation of the Go stimulus. Negative correlation coefficients are shown in cool colors. Darker colors correspond to stronger correlations (see vertical bars for exact values). Time-frequency areas with non-significant correlation coefficients are shown in green. The moment when the stimulus was presented is represented by 0. Heads at the top of the figure display the distribution of significant correlation coefficients in the maps of electrodes. n = 94.

References

    1. Rader R., McCauley L., Callen E.C. Current strategies in the diagnosis and treatment of childhood attention-deficit/hyperactivity disorder. Am. Fam. Physician. 2009;79:657–665. - PubMed
    1. Barry R.J., Johnstone S.J., Clarke A.R. A review of electrophysiology in attention-deficit/hyperactivity disorder: II. Event-related potentials. Clin. Neurophysiol. 2003;114:184–198. doi: 10.1016/S1388-2457(02)00363-2. - DOI - PubMed
    1. Bocharov A.V., Knyazev G.G., Savostyanov A.N., Tamozhnikov S.S., Saprygin A.E., Bairova N.B., Slobodskaya H.R. Correlation of emotional problems and hyperactivity with components of event related potencial in oddball paradigm in children. Zhurnal Vysshei Nervnoi Deyatelnosti Imeni Ip Pavlova. 2019;69:314–324.
    1. Einziger T., Ben-Shachar M.S., Devor T., Shmueli M., Auerbach J.G., Berger A. “My Brain Can Stop”: An ERP Study of Longitudinal Prediction of Inhibitory Control in Adolescence. Brain Sci. 2021;11:100. doi: 10.3390/brainsci11010100. - DOI - PMC - PubMed
    1. Chen C., Yang H., Du Y., Zhai G., Xiong H., Yao D., Li F. Altered Functional Connectivity in Children with ADHD Revealed by Scalp EEG: An ERP Study. Neural Plast. 2021;2021:1–9. - PMC - PubMed

LinkOut - more resources