. 2021 Oct 14;10(10):2449.
doi: 10.3390/foods10102449.

Global Proteomic Analysis of Listeria monocytogenes' Response to Linalool

Affiliations

Global Proteomic Analysis of Listeria monocytogenes' Response to Linalool

Zhipeng Gao et al. Foods. .

Abstract

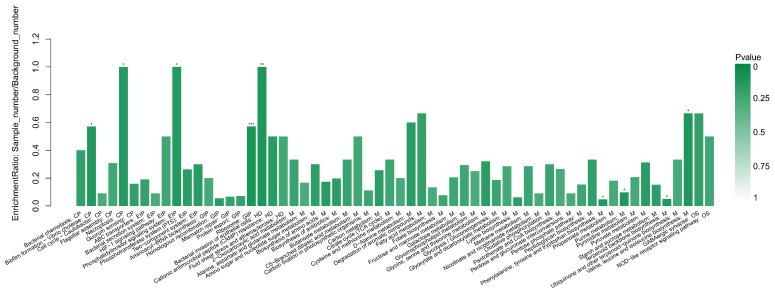
Listeria monocytogenes (LM) is one of the most serious foodborne pathogens. Listeriosis, the disease caused by LM infection, has drawn attention worldwide because of its high hospitalization and mortality rates. Linalool is a vital constituent found in many essential oils; our previous studies have proved that linalool exhibits strong anti-Listeria activity. In this study, iTRAQ-based quantitative proteomics analysis was performed to explore the response of LM exposed to linalool, and to unravel the mode of action and drug targets of linalool against LM. A total of 445 differentially expressed proteins (DEPs) were screened out, including 211 up-regulated and 234 down-regulated proteins which participated in different biological functions and pathways. Thirty-one significantly enriched gene ontology (GO) functional categories were obtained, including 12 categories in "Biological Process", 10 categories in "Cell Component", and 9 categories in "Molecular Function". Sixty significantly enriched biological pathways were classified, including 6 pathways in "Cell Process", 6 pathways in "Environmental Information Processing", 3 pathways in "Human Disease", 40 pathways in "Metabolism", and 2 pathways in "Organic System". GO and Kyoto Encyclopedia of Genes (KEGG) enrichment analysis together with flow cytometry data implied that cell membranes, cell walls, nucleoids, and ribosomes might be the targets of linalool against LM. Our study provides good evidence for the proteomic analysis of bacteria, especially LM, exposed to antibacterial agents. Further, those drug targets discovered by proteomic analysis can provide theoretical support for the development of new drugs against LM.

Keywords: Listeria monocytogenes; antimicrobial; linalool; proteomics.


Conflict of interest statement

The authors declare no conflict of interest.

Figures

Figure 1
Figure 1
The quality assessments of proteomics sequencing. (A) Histogram of peptide length distribution. The abscissa represents the range of peptide length, and the ordinate represents the number of peptides of the corresponding length. (B) Histogram of peptide quantity distribution. The abscissa represents the range of the number of peptides covering the proteins, and the ordinate represents the number of the proteins. (C) Statistical histogram of different types of identified proteins. (D) Histogram of protein molecular weight distribution. The abscissa represents the distribution range of protein molecular weight, and the ordinate represents the number of proteins corresponding to the molecular weight.
Figure 2
Figure 2
The annotation and analysis of all the identified proteins. (A) Annotation based on GO function classification. Each column represents a secondary classification. The ordinate represents the secondary classification term of GO, and the capital letters in front of the term represent the following categories: BP, biological process; CC, cellular component; MF, molecular function. (B) The top 20 KEGG pathways with the largest number of proteins. The abscissa represents the name of pathways, and the ordinate represents the number of proteins within each pathway.
Figure 3
Figure 3
DEPs of LM cells analyzed between the treated group (treated with linalool) and the control group (untreated with linalool). (A) Volcano plot of DEPs. The abscissa represents the fold change value of the difference between control and treated samples. The difference value is obtained by dividing the expression level of control sample by treated sample, and this value is logarithmized. The ordinate represents p-value (by the analysis of statistical t-test) of the difference of protein expressions. The smaller the p-value, the more significant the difference in protein expression. Each point represents a specific protein: the yellow point (significantly up-regulated, p < 0.05), the red point (significantly up-regulated, p < 0.01), the light blue point (significantly down-regulated, p < 0.05), the blue point (significantly down-regulated, p < 0.01), and the black dots (non-significantly different proteins, p > 0.05). (B) Heat map of DEPs. The left (CK1, control group) and right columns (TR1, treated group) represent control and treated groups, respectively. Each row represents a protein. Red and green colors represent the high and low expression levels of the protein, respectively. On the left is the dendrogram of protein clustering, and on the right is the name of the protein.
Figure 4
Figure 4
The GO enrichment analyzed between the treated group (treated with linalool) and the control group (untreated with linalool). (A) Histogram of GO enrichment of DEPs. Each column represents a GO term, and the abscissa represents the name and category of GO. The ordinate represents the enrichment rate. The color represents the significance of enrichment. p < 0.05, p < 0.01, p < 0.001 are marked as *, **, and ***, respectively. Subfigures (BD) are chord diagrams of the GO enrichment of DEPs, respectively showing the (B) different proteins participating in specific functions in the three GO categories of biological process, (C) cell composition, (D) and molecular function.
Figure 5
Figure 5
The enrichment of the DEPs in KEGG pathways analyzed between the treated group (treated with linalool) and the control group (untreated with linalool). Each column represents a pathway, and the abscissa represents the name and classification of the pathway: CP (cellular process), EIP (environmental information processing), GIP (genetic information processing), HD (human diseases), M (metabolism), and OS (organismal systems). The height of the column or the ordinate represents the enrichment rate. The color represents the significance of enrichment. p < 0.05, p < 0.01, and p < 0.001 are marked as *, **, and ***, respectively.
Figure 6
Figure 6
Fluorescence density plots of LM treated (treated) and untreated (control) with linalool stained with (A) PI and TO, (B) PI and BOX, (C) EB, and (D) CTC. For subfigures (A) and (B), the vertical and horizontal axis indicate the fluorescence intensity. The percentages of the cell population in each gate are demonstrated in the four corners of each plot.

References

    1. King T., Cole M., Farber J.M., Eisenbrand G., Zabaras D., Fox E.M., Hill J.P. Food safety for food security: Relationship between global megatrends and developments in food safety. Trends Food Sci. Technol. 2017;68:160–175. doi: 10.1016/j.tifs.2017.08.014. - DOI
    1. Radoshevich L., Cossart P. Listeria monocytogenes: Towards a complete picture of its physiology and pathogenesis. Nat. Rev. Microbiol. 2018;16:32–46. doi: 10.1038/nrmicro.2017.126. - DOI - PubMed
    1. Freitag N.E., Port G.C., Miner M.D. Listeria monocytogenes—From saprophyte to intracellular pathogen. Nat. Rev. Microbiol. 2009;7:623–628. doi: 10.1038/nrmicro2171. - DOI - PMC - PubMed
    1. Pizarro-Cerda J., Cossart P. Listeria monocytogenes: Cell biology of invasion and intracellular growth. Microbiol. Spectr. 2018;6:6.6. 05. doi: 10.1128/microbiolspec.GPP3-0013-2018. - DOI - PMC - PubMed
    1. European Food Safety Authority, European Centre for Disease Prevention and Control The European Union One Health 2019 Zoonoses Report. EFSA J. 2021;19:e06406. - PMC - PubMed

LinkOut - more resources