. 2021 Oct 11;22(20):10948.
doi: 10.3390/ijms222010948.

Bisphenol a Induces Autophagy Defects and AIF-Dependent Apoptosis via HO-1 and AMPK to Degenerate N2a Neurons

Affiliations

Bisphenol a Induces Autophagy Defects and AIF-Dependent Apoptosis via HO-1 and AMPK to Degenerate N2a Neurons

Ching-Tien Lee et al. Int J Mol Sci. .

Abstract

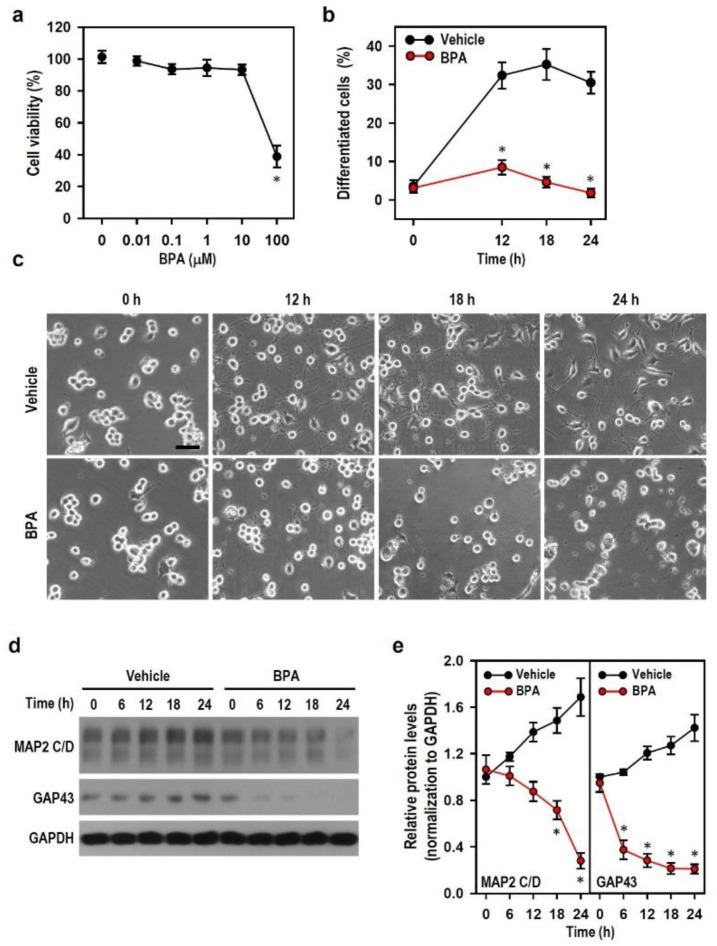
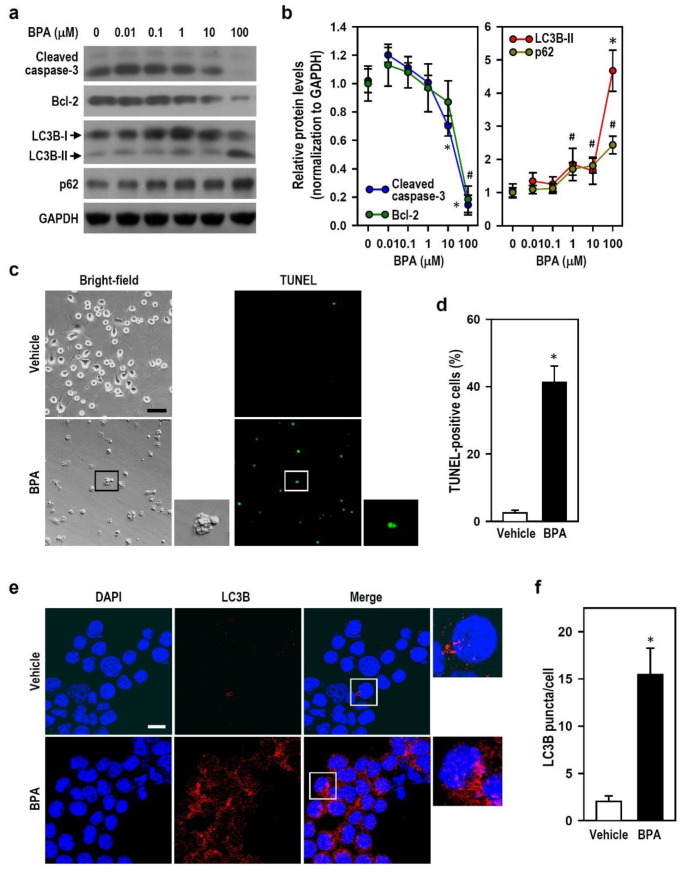
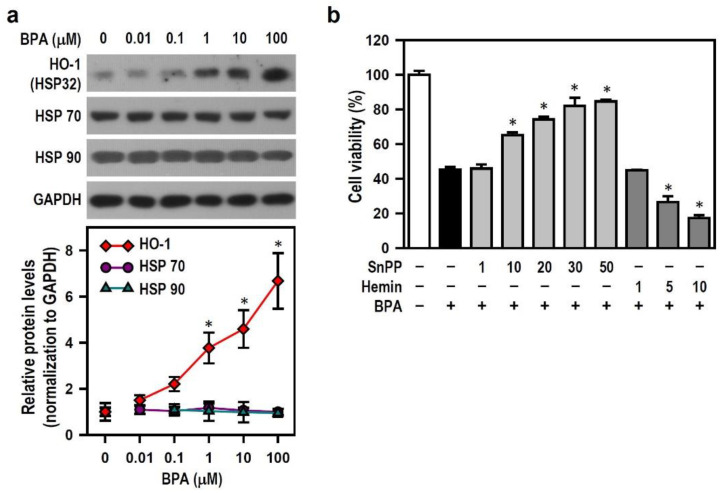
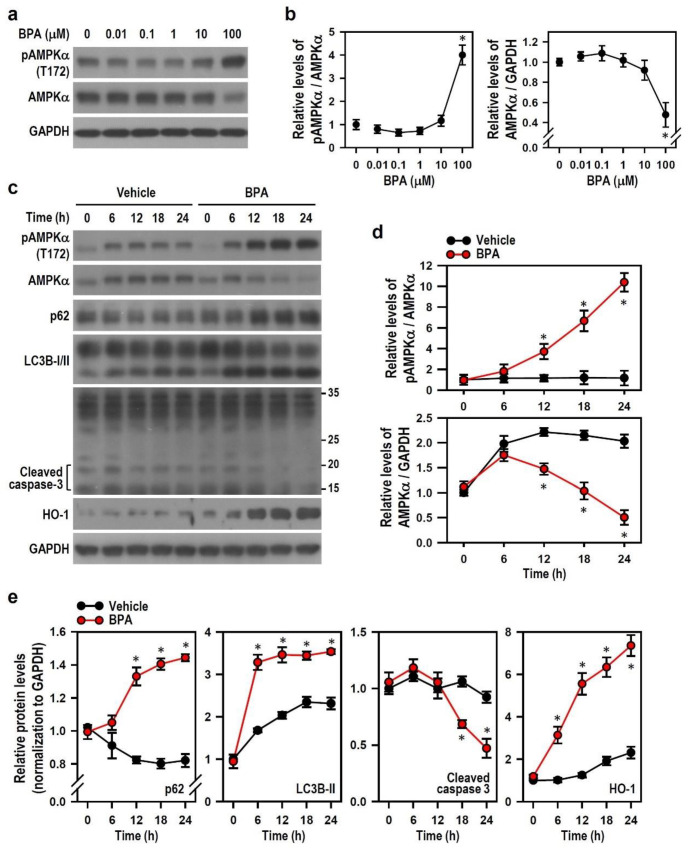
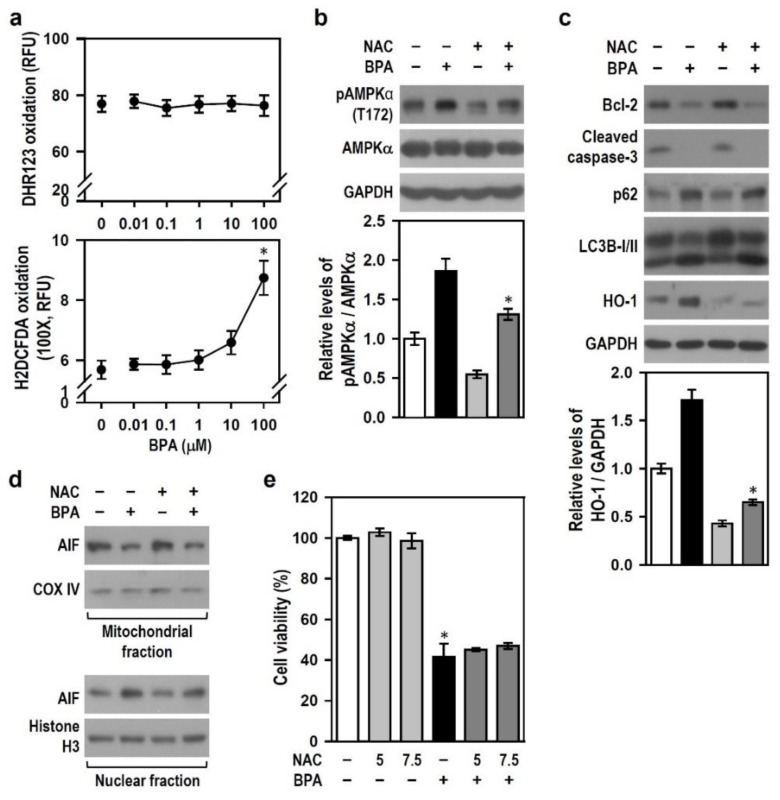
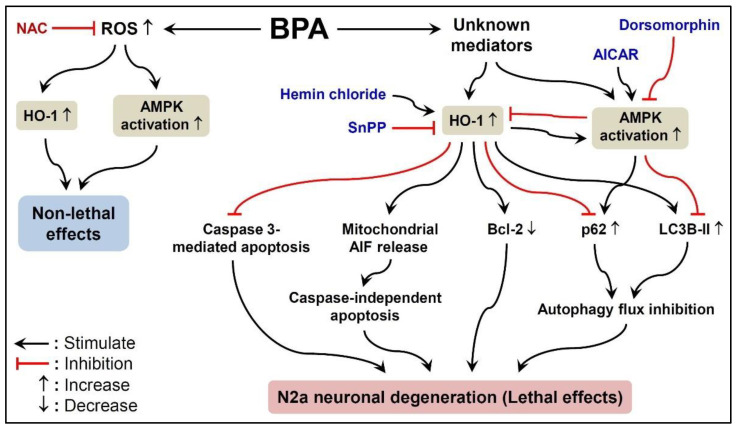
Bisphenol A (BPA) is an environmental contaminant widely suspected to be a neurological toxicant. Epidemiological studies have demonstrated close links between BPA exposure, pathogenetic brain degeneration, and altered neurobehaviors, considering BPA a risk factor for cognitive dysfunction. However, the mechanisms of BPA resulting in neurodegeneration remain unclear. Herein, cultured N2a neurons were subjected to BPA treatment, and neurotoxicity was assessed using neuronal viability and differentiation assays. Signaling cascades related to cellular self-degradation were also evaluated. BPA decreased cell viability and axon outgrowth (e.g., by down-regulating MAP2 and GAP43), thus confirming its role as a neurotoxicant. BPA induced neurotoxicity by down-regulating Bcl-2 and initiating apoptosis and autophagy flux inhibition (featured by nuclear translocation of apoptosis-inducing factor (AIF), light chain 3B (LC3B) aggregation, and p62 accumulation). Both heme oxygenase (HO)-1 and AMP-activated protein kinase (AMPK) up-regulated/activated by BPA mediated the molecular signalings involved in apoptosis and autophagy. HO-1 inhibition or AIF silencing effectively reduced BPA-induced neuronal death. Although BPA elicited intracellular oxygen free radical production, ROS scavenger NAC exerted no effect against BPA insults. These results suggest that BPA induces N2a neurotoxicity characterized by AIF-dependent apoptosis and p62-related autophagy defects via HO-1 up-regulation and AMPK activation, thereby resulting in neuronal degeneration.

Keywords: AMPK; Bisphenol A; apoptosis; autophagy; heme oxygenase-1; neurodegeneration.


Conflict of interest statement

The authors declare no conflict of interest. The funders had no role in the design of the study; in the collection, analyses, or interpretation of data; in the writing of the manuscript, or in the decision to publish the results.

Figures

Figure 1
Figure 1
Bisphenol A (BPA) reduces cell viability and neuron-like differentiation in Neuro-2a (N2a) cells. (a,b) Cultures were treated with various BPA concentrations (0 to 100 μM) for 24 h and incubated with 100 μM BPA or vehicle for different time lengths (0 to 24 h). The untreated culture (0 μM BPA) was regarded as the control group. The cell viability and differentiation levels were separately determined by analyzing the MTT reduction capacity of the treated group relative to the control group (assigned a value of 100%) and by calculating the number of cells (% of total) bearing axon-like neurites longer than two cell-body in diameter. Each point represents the mean ± SEM (n = 4, triplicate). * p < 0.05 vs. control group (a) or vehicle group at identical time point (b). (c) Representative photos show cell morphology at specific time points after treating 100 μM BPA. Vehicle-treated culture served as a control. Neuron-like differentiation is indicated by the extent of axon outgrowth. Scale bar = 50 μm. (d,e) Cultures were treated with vehicle or 100 μM BPA for various time periods (0 to 24 h). Both levels of microtubule-associated protein 2 (MAP2) C/D and growth associated protein 43 (GAP43) were detected by Western blots. The line plots show the relative quantitation values normalized by GAPDH levels. The protein level at a time point of 0 h is assigned a value of 1. Data are represented as mean ± SEM (n = 4). * p < 0.05 vs. vehicle group at identical time point.
Figure 2
Figure 2
BPA interferes with autophagy and caspase-3-mediated apoptosis in N2a cells. (a,b) Cultures were treated with various BPA concentrations for 24 h. The levels of light chain 3B (LC3B), p62, cleaved caspase-3, and Bcl-2 were analyzed by Western blots. The line plots show the relative protein levels compared to untreated control group (0 μM BPA; assigned a value of 1). Each point represents the mean ± SEM (n = 4). * p < 0.05 vs. untreated group in cleaved caspase-3 or LC3B-II plot. # p < 0.05 vs. untreated group in Bcl-2 or p62 plot. (c,d) Terminal deoxynucleotidyl transferase-mediated dUTP nick end labelling (TUNEL) assay was performed 24 h after vehicle or 100 μM BPA treatment in cultures. Representative photos show the matching bright-field and TUNEL-FITC fluorescence (scale bar = 50 μm). For clarity, a selective area with higher magnification is displayed on the side. A bar plot shows the relative quantitation data expressed as the percentage of TUNEL-positive cells (green fluorescence). Values are represented as mean ± SEM (n = 3). * p < 0.05 vs. vehicle group. (e,f) Representative fluorescence images of LC3B staining are shown (scale bar = 20 μm). Cells grown on coverslips were harvested 24 h after vehicle or 100 μM BPA treatment. Immunostaining was executed using an antibody against LC3B (red), and the nucleus (blue) is marked by 4′,6-diamidino-2-phenylindole (DAPI). The side insert at higher magnification shows the pattern of LC3 puncta. A bar plot shows the relative quantitation results of LC3B immunoreactivity in cultures. Data are represented as mean ± SEM (n = 3). * p < 0.05 vs. vehicle group.
Figure 3
Figure 3
BPA induces autophagy flux inhibition and caspase-independent apoptosis in N2a cells. (a,b) Cultures were treated with pharmacological inhibitors, i.e., 40 μM Z-VAD-FMK, 30 μM chloroquine (CQ), and 2 mM 3-methyladenine (3-MA), for 30 min and then exposed or not to 100 μM BPA for 24 h. The untreated cultures served as a control. The levels of LC3B, p62, cleaved caspase-3, and Bcl-2 were analyzed by Western blots. The bar plots show the quantitative data (normalized by GAPDH) for each protein relative to the control group (assigned a value of 1). Data are represented as mean ± SEM (n = 4). * p < 0.05 vs. control group; # p < 0.05 vs. BPA alone. (c) Similar manipulation was performed as (a), and the cultures were harvested to determine cell viability. The untreated control group is assigned a survival rate of 100%. Data are represented as mean ± SEM (n = 4, triplicate). * p < 0.05 vs. control group; # p < 0.05 vs. BPA alone.
Figure 4
Figure 4
BPA impairs the cytochrome c/caspase-9/caspase-3 apoptotic axis and elicits a nuclear translocation of mitochondrial apoptosis-inducing factor (AIF) in N2a cells. (a) Cultures treated with vehicle or 100 μM BPA for 12 h were harvested and subjected to subcellular fractionation. AIF level was detected by Western blots. Cytochrome c oxidase (COX) IV and histone H3 were the markers of mitochondrial and nuclear subcellular fractions, respectively. (b) Representative fluorescence images of AIF immunoreactivity (green) are shown (scale bar = 10 μm). Cells grown on coverslips were harvested 12 h after vehicle or 100 μM BPA treatment. DAPI staining (Nucleus, dark blue) allows identification of the nuclear translocation of AIF (Merge, light blue). (c) Transient transfection of small interfering RNA (siRNA) was used to silence AIF protein formation. Cultures were untreated or treated with control- or AIF-siRNA (50 nM) as indicated, and the silencing efficacy was evaluated by Western blots. Additionally, the siRNA-transfected cultures were exposed or not to BPA for 24 h. Cell viability was assessed by MTT reduction assay. The bar plot shows the survival percent compared to the untreated control group (assigned a value of 100%). Values are represented as mean ± SEM (n = 4, triplicate). * p < 0.05 vs. BPA alone. (d) Similar manipulation was conducted as (a), and cytochrome c level was detected by Western blots. COX IV and GAPDH were mitochondrial and cytoplasmic markers, respectively. 3-morpholinosyndomine (SIN-1) at 1 mM was a positive control to induce apoptosis. (e) Cultures exposing to vehicle or the indicated agents for 24 h were harvested and subjected to Western blots to detect procaspase-9, cleaved caspase-9, procaspase-3, and cleaved caspase-3 levels. The bar plots show the relative quantitation data of these proteins. Values are represented as mean ± SEM (n = 4). * p < 0.05 vs. vehicle group.
Figure 5
Figure 5
BPA selectively induces the production of heme oxygenase (HO)-1 but not HSP70 and HSP90, leading to the N2a cell survival decline. (a) Cultures were treated with different BPA concentrations for 24 h, and untreated culture (0 μM BPA) was regarded as the control group. HO-1, HSP70 and HSP90 levels were detected using Western blots. A line plot shows the relative quantitation data of these HSPs. Each point represents the mean ± SEM (n = 4). * p < 0.05 vs. control group. (b) Cultures were exposed to various concentrations (μM) of HO-1-related pharmacological agents, hemin chloride (Hemin), or tin protoporphyrin IX (SnPP), for 30 min before being treated with 100 μM BPA for 24 h. Cell viability was assessed by MTT reduction assay. A bar plot shows the survival percent relative to the untreated control group (assigned a value of 100%). Data are represented as mean ± SEM (n = 4, triplicate). * p < 0.05 vs. BPA alone.
Figure 6
Figure 6
HO-1 mediates BPA effects on autophagy activation, nuclear translocation of AIF, and AMP-activated protein kinase (AMPK)α phosphorylation, as well as the down-regulation of cleaved caspase-3, Bcl-2, and AMPKα. (a) Cultures were exposed to 30 μM SnPP or 10 μM hemin for 30 min before being treated with or without 100 μM BPA for 24 h. HO-1, Bcl-2, cleaved caspase-3, LC3B, and p62 levels were detected by Western blots. The bar plots show the relative quantitation data of these proteins. Values are represented as mean ± SEM (n = 4). * p < 0.05 vs. BPA alone. (b) Cultures were pretreated with 30 μM SnPP or 10 μM hemin for 30 min and continuously incubated with 100 μM BPA for 12 h. Cultures were subjected to subcellular fractionation after harvest. AIF level was detected by Western blots. COX IV and histone H3 were markers standing separately for mitochondrial and nuclear fractions. The bar plots show the quantitative results relative to the untreated control group (assigned a value of 1). Data are represented as mean ± SEM (n = 4). * p < 0.05 vs. BPA alone. (c) Similar manipulation was conducted as (a), and pAMPKα and AMPKα levels were detected by Western blots. The bar plots show the quantitative values of pAMPKα (normalized by AMPKα) and AMPKα (normalized by GAPDH) relative to the untreated control group (assigned a value of 1). Data are represented as mean ± SEM (n = 4). * p < 0.05 vs. control group; # p < 0.05 vs. BPA alone.
Figure 7
Figure 7
BPA enables activation of AMPK and time-dependently causes an AMPKα phosphorylation, accompanied by up-regulation of LC3B, p62, and HO-1 and down-regulation of cleaved caspase-3. (a,b) Cultures were treated with various BPA concentrations for 24 h. The levels of pAMPKα and AMPKα were detected by Western blots. The line plots show the quantitative data of pAMPKα (normalized by AMPKα) and AMPKα (normalized by GAPDH) relative to the untreated control group (0 μM BPA; assigned a value of 1). Each point represents the mean ± SEM (n = 4). * p < 0.05 vs. control group. (ce) Cultures were treated with vehicle or 100 μM BPA for various time periods as indicated. The levels of pAMPKα, AMPKα, p62, LC3B, caspase-3, and HO-1 were detected by Western blots. The line plots show the relative quantitation values after normalization. The protein level at a time point of 0 h is assigned a value of 1. Data are represented as mean ± SEM (n = 4). * p < 0.05 vs. vehicle group at identical time point.
Figure 8
Figure 8
AMPK activated by BPA is related to the levels of p62 and LC3B; AICAR lessens BPA-induced formation of LC3B and HO-1, while dorsomorphin reduces BPA-induced p62 accumulation and aggravates N2a cell death caused by BPA. (a) Cultures were exposed to AMPK-related pharmacological agents, i.e., 2 mM 5-aminoimidazole-4-carboxamide riboside (AICAR) or 10 μM dorsomorphin (Dorso), for 30 min before being treated with or without 100 μM BPA for 24 h. The levels of pAMPKα and AMPKα were detected by Western blots. The bar plots show the quantitative data of pAMPKα (normalized by AMPKα) and AMPKα (normalized by GAPDH) relative to the untreated control group (assigned a value of 1). Data are represented as mean ± SEM (n = 4). * p < 0.05 vs. control group; # p < 0.05 vs. BPA alone. (b) Similar manipulation was performed as (a), and the levels of Bcl-2, cleaved caspase-3, LC3B, p62, and HO-1 were detected by Western blots. The bar plots show the quantitative data of these proteins (normalized by GAPDH) relative to the untreated control group (assigned a value of 1). Values are represented as mean ± SEM (n = 4). * p < 0.05 vs. control group; # p < 0.05 vs. BPA alone; a p < 0.05 vs. AICAR alone; b p < 0.05 vs. dorsomorphin alone. (c) Similar manipulation was performed as (a), and cultures were subjected to MTT reduction assay to assess cell viability. A bar plot shows the survival percent relative to untreated control group (assigned a value of 100%). Data are represented as mean ± SEM (n = 4, triplicate). * p < 0.05 vs. control group; # p < 0.05 vs. BPA alone.
Figure 9
Figure 9
N-acetyl-L-cysteine (NAC) reduces BPA-induced AMPKα phosphorylation and HO-1 production but exerts no effect on stress signalings related to cell degradation. (a) Cultures were treated with various BPA concentrations for 24 h and then subjected to the determination of intracellular peroxides and ROS. The line plots show the quantitative data (RFU: relative fluorescence unit), and the untreated cultures (0 μM BPA) served as a control. Each point represents the mean ± SEM (n = 4, triplicate). * p < 0.05 vs. control group. (b) Cultures were exposed or not to 5 mM NAC for 30 min and then treated with or without 100 μM BPA for 24 h. Both pAMPKα and AMPKα levels were detected by Western blots. A bar plot shows the quantitative pAMPKα/AMPKα levels relative to the untreated control group (assigned a value of 1). Data are represented as mean ± SEM (n = 4). * p < 0.05 vs. BPA alone. (c) Similar manipulation was performed as (b), and cultures were subjected to Western blots to detect HO-1, Bcl-2, cleaved caspase-3, p62, and LC3B levels. The relative quantitation values of HO-1 level are represented as mean ± SEM (n = 4) shown below the representative blot. *p < 0.05 vs. BPA alone. (d) Similar manipulation was executed as (b). Cultures were harvested and subjected to subcellular fractionation after 12-h incubation. AIF level was detected by Western blots. COX IV and histone H3 were markers standing separately for mitochondrial and nuclear fractions. (e) Cultures pretreated with NAC (5 or 7.5 mM) for 30 min were incubated with or without 100 μM BPA for 24 h. A bar plot shows the cell viability percent relative to untreated control group (assigned a value of 100%). Data are represented as mean ± SEM (n = 4, triplicate). * p < 0.05 vs. control group.
Figure 10
Figure 10
The schematic diagram depicts the degeneration of N2a neurons induced by BPA. BPA, through AMPK activation and HO-1 induction, causes Bcl-2 down-regulation, autophagy defects (characterized by p62 accumulation and LC3B aggregation), and AIF-driven apoptosis, leading to N2a neurotoxicity (e.g., the decline of cell viability and the collapse of neuron-like axon outgrowth). However, caspase-3-mediated apoptosis is not involved.

Similar articles

Cited by

References

    1. Abraham A., Chakraborty P. A review on sources and health impacts of bisphenol A. Rev. Environ. Health. 2020;35:201–210. doi: 10.1515/reveh-2019-0034. - DOI - PubMed
    1. Sonavane M., Gassman N.R. Bisphenol A co-exposure effects: A key factor in understanding BPA’s complex mechanism and health outcomes. Crit. Rev. Toxicol. 2019;49:371–386. doi: 10.1080/10408444.2019.1621263. - DOI - PMC - PubMed
    1. Rubin B.S. Bisphenol A: An endocrine disruptor with widespread exposure and multiple effects. J. Steroid Biochem. Mol. Biol. 2011;127:27–34. doi: 10.1016/j.jsbmb.2011.05.002. - DOI - PubMed
    1. Vandenberg L.N., Chahoud I., Heindel J.J., Padmanabhan V., Paumgartten F.J., Schoenfelder G. Urinary, circulating, and tissue biomonitoring studies indicate widespread exposure to bisphenol A. Environ. Health Perspect. 2010;118:1055–1070. doi: 10.1289/ehp.0901716. - DOI - PMC - PubMed
    1. Santoro A., Chianese R., Troisi J., Richards S., Nori S.L., Fasano S., Guida M., Plunk E., Viggiano A., Pierantoni R., et al. Neuro-toxic and reproductive effects of BPA. Curr. Neuropharmacol. 2019;17:1109–1132. doi: 10.2174/1570159X17666190726112101. - DOI - PMC - PubMed

MeSH terms

LinkOut - more resources