. 2021 Oct 14;22(20):11068.
doi: 10.3390/ijms222011068.

MicroRNA-124 Alleviates Retinal Vasoregression via Regulating Microglial Polarization

Affiliations

MicroRNA-124 Alleviates Retinal Vasoregression via Regulating Microglial Polarization

Ying Chen et al. Int J Mol Sci. .

Abstract

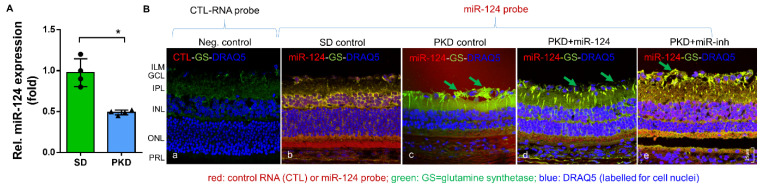
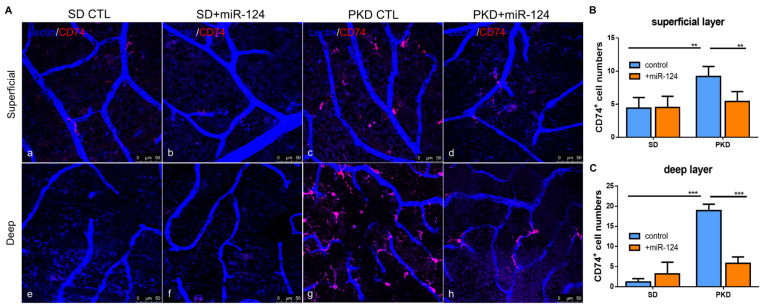
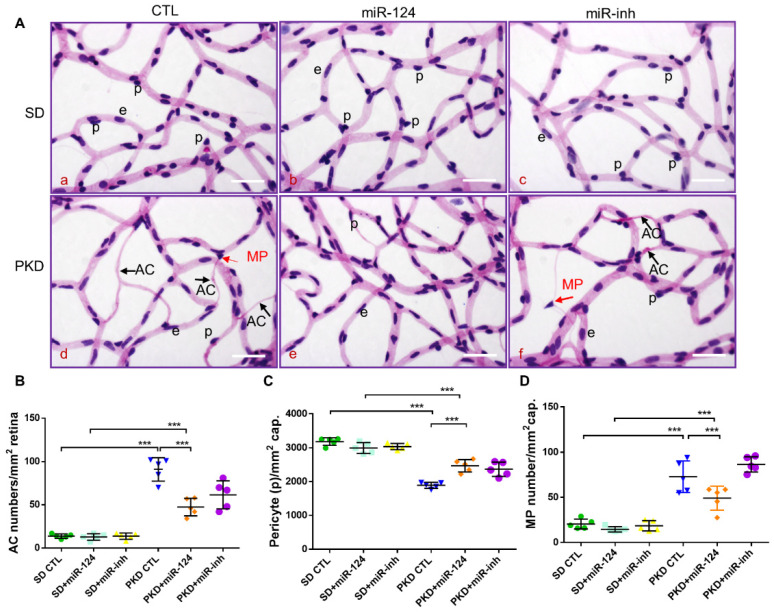
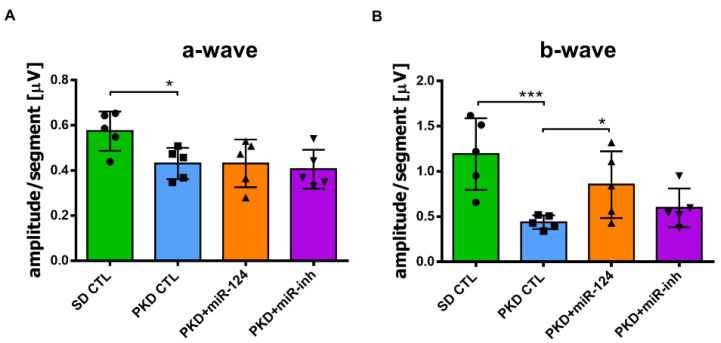
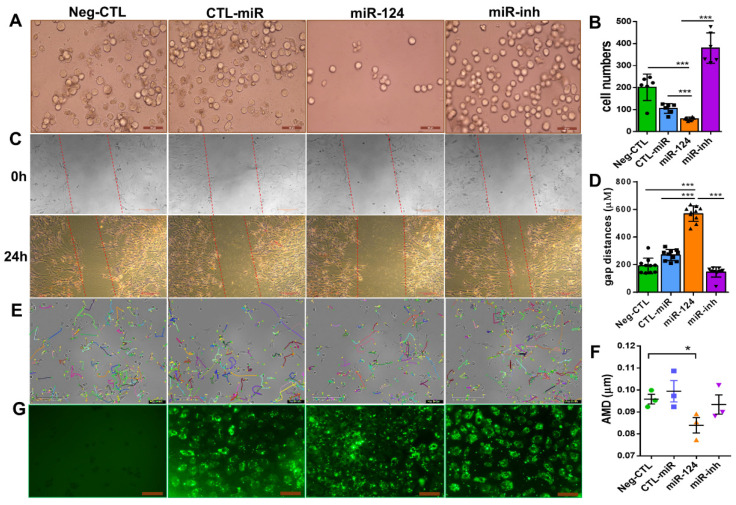
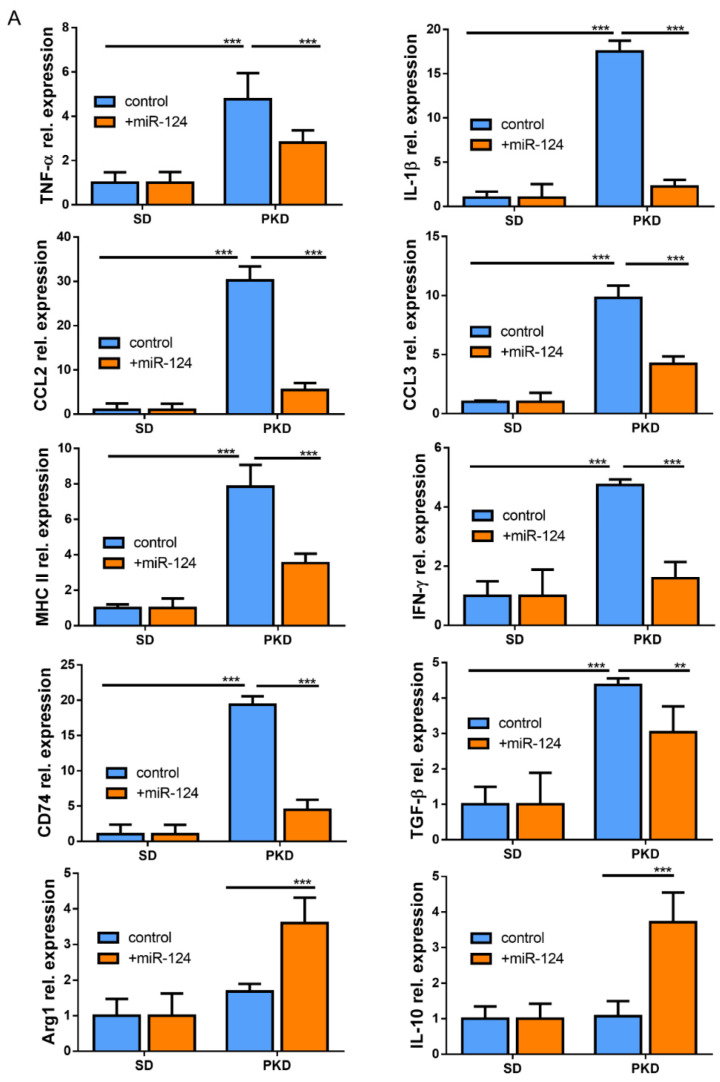
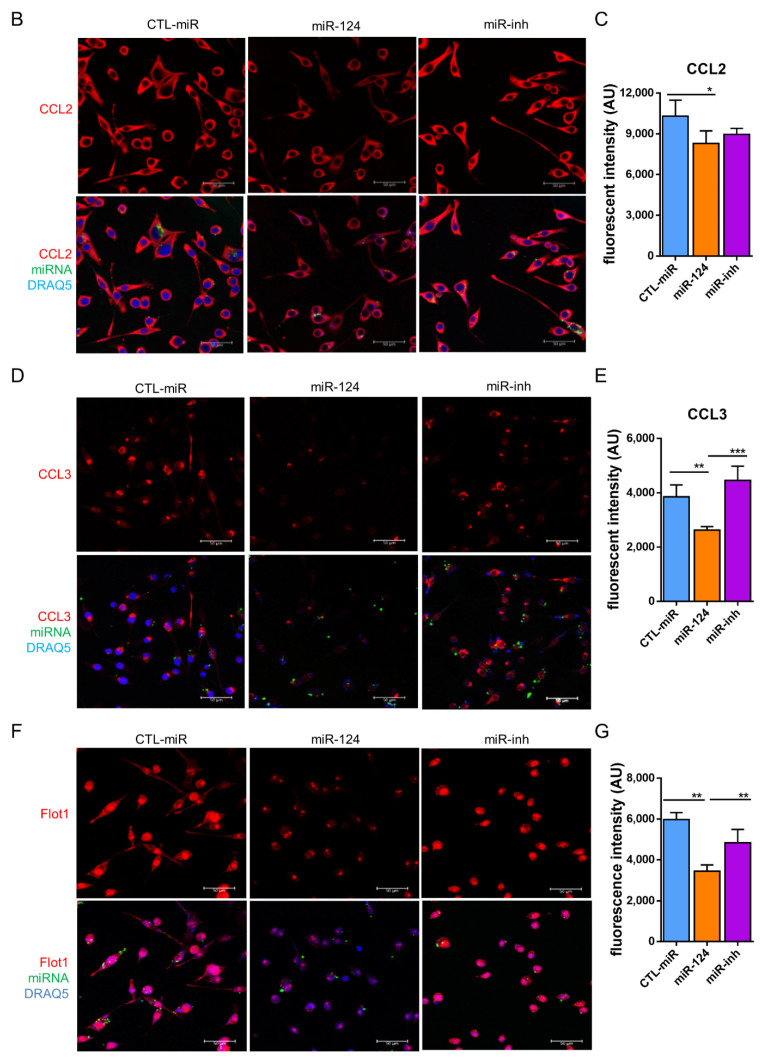
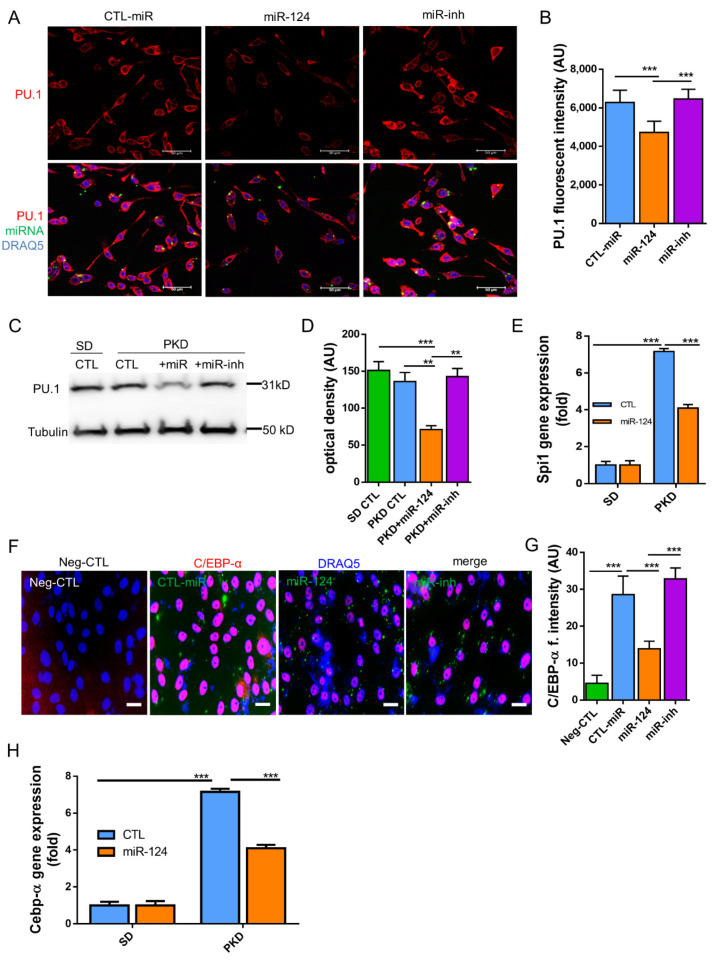
Microglial activation is implicated in retinal vasoregression of the neurodegenerative ciliopathy-associated disease rat model (i.e., the polycystic kidney disease (PKD) model). microRNA can regulate microglial activation and vascular function, but the effect of microRNA-124 (miR-124) on retinal vasoregression remains unclear. Transgenic PKD and wild-type Sprague Dawley (SD) rats received miR-124 at 8 and 10 weeks of age intravitreally. Retinal glia activation was assessed by immunofluorescent staining and in situ hybridization. Vasoregression and neuroretinal function were evaluated by quantitative retinal morphometry and electroretinography (ERG), respectively. Microglial polarization was determined by immunocytochemistry and qRT-PCR. Microglial motility was examined via transwell migration assays, wound healing assays, and single-cell tracking. Our data showed that miR-124 inhibited glial activation and improved vasoregession, as evidenced by the reduced pericyte loss and decreased acellular capillary formation. In addition, miR-124 improved neuroretinal function. miR-124 shifted microglial polarization in the PKD retina from the pro-inflammatory M1 phenotype to the anti-inflammatory M2 phenotype by suppressing TNF-α, IL-1β, CCL2, CCL3, MHC-II, and IFN-γ and upregulating Arg1 and IL-10. miR-124 also decreased microglial motility in the migration assays. The transcriptional factor of C/EBP-α-PU.1 signaling, suppressed by miR-124 both in vivo (PKD retina) and in vitro (microglial cells), could serve as a key regulator in microglial activation and polarization. Our data illustrate that miR-124 regulates microglial activation and polarization. miR-124 inhibits pericyte loss and thereby alleviates vasoregression and ameliorates neurovascular function.

Keywords: miR-124; microglia; polarization; vasoregression.


Conflict of interest statement

The authors declare no conflict of interest.

Figures

Figure 1
Figure 1
miR-124 expression was reduced in the retinae of PKD rats and inactivated the Müller glia. (A) Relative expression of miR-124 in the retinae of SD and PKD rats measured by RT-qPCR using hsp-miR-124-3p specific primers. Data are normalized to the expression of U6 snRNA, exhibited as means ± SD, n = 4. The p value determined by a Student’s t test was * p < 0.05. (B) ISH combined with fluorescent immunohistochemistry. A control RNA probe (a) or miR-124 probe (be) was used to detect paraffin-embedded retinal vertical sections from the SD (a,b) and PKD rats with (d) or without miR-124 (c) or miR-inh (e) injection. The miR-124 probe was labeled with donkey anti-sheep Alexa Fluor 555 (red), the glutamate synthetase (GS) was labeled with chicken anti-rabbit Alexa Fluor 488 (green), and the nuclei were labeled with DRAQ5TM (blue). A section from the SD retina probed with the control miRNA probe (CTL-RNA probe) served as a negative control (a). The images were taken with Leica confocal microscope TCS SP8, and scale bar shown in B, e = 25 µm.
Figure 2
Figure 2
Microglial distribution and activation in SD and PKD retinae, with whole-mount immunofluorescent staining of CD74 in retinae from SD (a,b,e,f) and PKD (c,d,g,h) rats treated with either control miRNA (CTL) (a,c,e,g) or an miR-124 mimic (miR-124) (b,d,f,h). Microglia were labeled with CD74 (red). Retinal vessels were labeled with iso-lectin B4 (blue). (A) Representative images of microglial activation (CD74+) in the superficial layer (upper panel) and in the deep layer (lower panel). (B) Quantification of the CD74+ microglia in the superficial layer (upper panel A). (C) Quantification of the CD74+ microglia in the deep layer (lower panel A). The images were taken with a Leica confocal microscope TCS SP8 with scale bars = 50 µm. Data (B,C) are exhibited as means ± SD, n = 5. The p values were determined by two-way ANOVA with Tukey’s multiple comparisons test were ** p < 0.01 and *** p < 0.001.
Figure 3
Figure 3
miR-124 ameliorates pericyte loss and reduces vasoregression in PKD retinae. Retinal morphometry was measured in SD and PKD rats treated with or without miR-124. Two-month-old SD and PKD rats were treated with 25 pmol of control microRNA (CTL), an miR-124 mimic, or miR-124 inhibitor (miR-inh) for 4 weeks. (A) Representative images of PAS and hematoxylin-stained retinal vasculature from retinal digest preparation taken by an Olympus BX51 microscope. Black arrows indicate acellular capillaries (ACs), red arrows indicate migrating pericytes (MPs), p = pericyte, e = endothelial cell, and scale bars = 50 µm. (BD) Quantification of acellular capillaries (number of ACs/mm2 retinal area) (B); quantification of pericytes (number of pericytes/mm2 retinal area) (C); and quantification of migrating pericytes (number of MP/mm2 retinal area) (D) were analyzed using CellF software from Olympus. (BD) n = 5 and *** p < 0.001 (one-way ANOVA with Tukey’s multiple comparisons test).
Figure 4
Figure 4
miR-124 ameliorated neuroretinal function in the PKD rats. The neuroretinal function was measured via electroretinography (ERG) in the SD and PKD rats. SD and PKD rats were intravitreally administrated with 25 pmol of the control miRNA (CTL), miR-124 mimic, or miR-124 inhibitor (miR-inh) at week 8 and week 10, respectively. ERG was performed at week 12. Data are presented as means ± SD, n = 5. The p values were determined by one-way ANOVA with Tukey’s multiple comparisons test, where * p < 0.05 and *** p < 0.001. (A) Represented a-wave amplitudes in ERG. (B) Represented b-wave amplitudes in ERG.
Figure 5
Figure 5
miR-124 reduced microglial cell motility. BV2 microglial cells (A,E,G) and rat primary microglial cells (C) were transfected with Lipofectamine 2000 Transfection Reagent as a negative control (Neg-CTL), control microRNA (CTL-miR), microRNA-124 (miR-124), and miR-124 inhibitor (miR-inh) for 24 h (A,C,E,G). (A) Images of transwell migration assays taken with a Zeiss Axio Observer Z1 microscope, where the scale bars = 50 µm. (B) Quantification showed that the migrating cells moved downward well with the serum-free medium after 24 h. (C) Images of wound healing assays with rat primary microglial cells at time point 0 h (upper panel) and end time point 24 h (low panel), with scale bars = 200 µm. (D) Quantification of the gap sizes from the 24 h-panel of (C). (E) Tracking of single BV2 cell movement. After 24 h of transfection, cells were applied to live cell imaging with an Incucyte S3 phase contrast microscope. Images of three fields per well were taken at 30-min intervals, and cell tracking was monitored for 10 h. Tracks of individual cells are shown in different colors, where the scale bars = 200 µm. (F) Quantification of the average migration distance (AMD in µm) of a single cell was analyzed with the TimeLapse Analyzer (TLA). Three fields each of 100 cells were analyzed, where n = 3 and * p < 0.05 (one-way ANOVA with Tukey’s multiple comparisons test). (G) Transfection evidence of BV2 cells with FAM-conjugated control miRNA, an miR-124 mimic, or miR-124 inhibitor observed using a Zeiss Axio Observer Z1 phase-contrast fluorescent microscope, with scale bars = 100 µm. (B) n = 5. (D) n = 10 and *** p < 0.001 (one-way ANOVA with Tukey’s multiple comparisons test).
Figure 6
Figure 6
miR-124 reduced expression of pro-inflammatory cytokines in the PKD rat. (A) Quantitative M1 and M2 gene expressions in SD and PKD rats treated with or without the miR-124 mimic. RT-qPCR was performed to evaluate the genes specially expressed in the M1 state (TNF-α, IL-1β, IFN-γ, CCL2, CCL3, MHC-II, CD74, and TGF-β) and M2 state (Arg1 and IL-10). The expression of the house-keeping gene, rat Gapdh, was used as a control. Relative gene expression (fold versus Gapdh) was calculated using the ∆∆CT method. (B,D,F) Representative images of fluorescent immunocytochemistry (ICC) of CCL2 (B), CCL3 (D), and Flot1 (F) in BV2 cells. BV2 cells were transfected with FAM-labeled miR-124 or an miR-124 inhibitor (miR-inh) (green) for 24 h. Antibodies of CCL2, CCL3, and Flot1 were labeled with Alexa Fluor 555 (red), and the nuclei were labeled with DRAQ5TM (blue). Images were taken using a Leica confocal microscope TCS SP8, with scale bars = 50 µm. (C,E,G) Quantification of CCL2 (C), CCL3 (E), and Flot1 (G) expressions from ICC fluorescence intensity using Image J software. Data are shown in arbitrary units (AU). (A,C,E,G) n = 5, * p < 0.05, ** p < 0.01, and *** p < 0.001 (two-way ANOVA with Tukey’s multiple comparisons test).
Figure 6
Figure 6
miR-124 reduced expression of pro-inflammatory cytokines in the PKD rat. (A) Quantitative M1 and M2 gene expressions in SD and PKD rats treated with or without the miR-124 mimic. RT-qPCR was performed to evaluate the genes specially expressed in the M1 state (TNF-α, IL-1β, IFN-γ, CCL2, CCL3, MHC-II, CD74, and TGF-β) and M2 state (Arg1 and IL-10). The expression of the house-keeping gene, rat Gapdh, was used as a control. Relative gene expression (fold versus Gapdh) was calculated using the ∆∆CT method. (B,D,F) Representative images of fluorescent immunocytochemistry (ICC) of CCL2 (B), CCL3 (D), and Flot1 (F) in BV2 cells. BV2 cells were transfected with FAM-labeled miR-124 or an miR-124 inhibitor (miR-inh) (green) for 24 h. Antibodies of CCL2, CCL3, and Flot1 were labeled with Alexa Fluor 555 (red), and the nuclei were labeled with DRAQ5TM (blue). Images were taken using a Leica confocal microscope TCS SP8, with scale bars = 50 µm. (C,E,G) Quantification of CCL2 (C), CCL3 (E), and Flot1 (G) expressions from ICC fluorescence intensity using Image J software. Data are shown in arbitrary units (AU). (A,C,E,G) n = 5, * p < 0.05, ** p < 0.01, and *** p < 0.001 (two-way ANOVA with Tukey’s multiple comparisons test).
Figure 7
Figure 7
miR-124 regulated the expression of PU.1 and C/EBP-α in microglial cells and in PKD retinae. (A,F) Immunocytochemistry (ICC) of PU.1 and C/EBP-α expression in BV2 cells. BV2 cells were transfected with an miR-124 mimic (miR-124), control miRNA (CTL-miR), or miR-124 inhibitor (miR-inh). Cells transfected with only Lipofectamine 2000 Transfection Reagent were used as a negative control (Neg-CTL). PU.1 (A) and C/EBP-α (F) were detected using an Alexa 555-labeled secondary antibody (red), miRNA localization was visualized by FITC (green), and cell nuclei were labeled with DRAQ5TM (blue). Images were taken using a Leica confocal microscope TCS SP8, with scale bars = 50 µm. (B,G) Quantification of ICC fluorescence from PU.1 (B) and C/EBP-α (G). (C) Western blot detection of PU.1 in the lysates of SD and PKD retinae, where 10 µg of total protein preparation from retina tissue was separated in 4–20% SDS-PAGE gel, and an anti-PU.1 antibody 1:1000 dilution was used for detection. Protein expression of α-Tubulin was used as an internal control. (D) Quantification of western blots by optical intensity. Data are represented as means ± SEM. (E,H) Gene expression of Spi1 (PU.1) and Cebp-α in miR-124 mimic- or control miRNA-treated retinae of SD and PKD rats was evaluated by RT-qPCR. The rat Gapdh gene was used as a housekeeping control. The immunostaining density was quantified with Image J software (B,G). Data are shown as the mean fluorescent intensity of five images of each condition, where n = 5, ** p < 0.01, and *** p < 0.001 (one-way ANOVA with Tukey’s multiple comparisons test) (AH).

Similar articles

Cited by

References

    1. Hammes H.P., Feng Y., Pfister F., Brownlee M. Diabetic retinopathy: Targeting vasoregression. Diabetes. 2011;60:9–16. doi: 10.2337/db10-0454. - DOI - PMC - PubMed
    1. Karlstetter M., Scholz R., Rutar M., Wong W.T., Provis J.M., Langmann T. Retinal microglia: Just bystander or target for therapy? Prog. Retin. Eye Res. 2015;45:30–57. doi: 10.1016/j.preteyeres.2014.11.004. - DOI - PubMed
    1. Vecino E., Rodriguez F.D., Ruzafa N., Pereiro X., Sharma S.C. Glia-neuron interactions in the mammalian retina. Prog. Retin. Eye Res. 2016;51:1–40. doi: 10.1016/j.preteyeres.2015.06.003. - DOI - PubMed
    1. Rashid K., Akhtar-Schaefer I., Langmann T. Microglia in Retinal Degeneration. Front. Immunol. 2019;10:1975. doi: 10.3389/fimmu.2019.01975. - DOI - PMC - PubMed
    1. Bellver-Landete V., Bretheau F., Mailhot B., Vallieres N., Lessard M., Janelle M.E., Vernoux N., Tremblay M.E., Fuehrmann T., Shoichet M.S., et al. Microglia are an essential component of the neuroprotective scar that forms after spinal cord injury. Nat. Commun. 2019;10:518. doi: 10.1038/s41467-019-08446-0. - DOI - PMC - PubMed

MeSH terms

Grants and funding